
Abstract
Image or feature matching-based indoor localization still faces many technical challenges. Image-tag-based schemes using pose estimation are accurate and robust, but they still cannot be deployed widely because their performance degrades significantly when the tag-camera distance is large, which requires densely distributed tags, and the designed system generally is specific to some special tags and lenses. Also, the lens distortion degrades the performance appreciably and is difficult to correct, especially for the wide-angle lenses. This article develops an image-tag-based indoor localization system using end-to-end learning to overcome these issues. It is a deep learning–based system that can learn the mapping from the original tag image to the final 2D location directly from training examples through self-learned features. It achieves consistent performance even when the tag-camera distance is large or when the image has a low resolution. The mapping learned by the deep learning model factors in all kinds of distortions without requiring any distortion estimation. The tag design is based on shape features to make it robust to lighting changes. The system can be easily adapted to new lenses/cameras and/or new tags. Thus, it facilitates easy and rapid deployment without requiring knowledge from domain experts. A drawback of the general deep learning model is its high computational requirements. We discuss practical solutions to enable real-time applications of the proposed scheme even when it is running on a mobile or embedded device. The performance of the proposed scheme is evaluated via a set of experiments in a real setting and has achieved less than 20 cm of positioning errors.
Introduction
Image-based indoor localization1–10 finds many use scenarios such as drone and robot navigation. In such methods, images of the environment where localization takes place are pre-captured, structured, and stored in a database, using methods such as image matching and bundle adjustment algorithms. Each image’s relative pose such as its position and orientation is estimated and the semantic locations of the images are tagged. The camera’s position (or the position of a user) is localized by matching the camera’s captured image to one of the images in the database, for example, by combining quick image searching, feature matching (such as Scale Invariant Feature Transform (SIFT) features),4–6 and relative orientation. Image-based methods still suffer from issues such as high computational requirements, blind spot issues, and being not robust.
Image-tag-based (or marker-based) indoor localization avoids these issues using pre-defined image tags.11–19 In such methods, pre-designed tags are attached at certain known locations in the environment. If a photo taken by a camera contains any of the tags, the tag can be detected and used to determine the pose of the camera with reference to the location and pose of the tag through pose estimation (PE). This requires the camera to be calibrated properly and with a known calibration matrix. Image-tag-based methods can achieve a high accuracy when the tag is clearly present in the image. They can also provide robust and continuous localization when the tags are densely distributed in the environment.
However, as discussed in Liao and Tsai 14 and Anwar et al., 19 the accuracy of PE relies on the detection accuracy of the local corners or points in the image. When the image is blurred or taken from far away, or when the tag is partially covered, PE accuracy decreases. Also, camera lenses have different kinds of distortions (e.g. barrel distortion), which will degrade the localization accuracy, especially for cameras with wide-angle lens. Existing PE algorithms either do not consider such distortions, resulting in dramatically decreased accuracy as the range increases, especially for cameras with wide-angle lens, 12 or they have considered such distortions at the expense of much increased complexity and computational needs in order to correct these distortions on the original full-size image. 16 Also, the distortions often come from a combination of different sources and are complex and highly non-linear. The corrections would at best be an approximation and the errors are unevenly distributed over the image. 20 These errors propagate into the next steps of the PE algorithms. While using cameras with wide-angle lenses is attractive for reducing the tag density, the resulting distortion–correction errors are more substantial. With PE algorithms, if the lenses have changed and/or if the tags have been redesigned, the algorithms must be revised accordingly, preventing them from being deployed conveniently. Another problem is that existing tags are color based for easy detection and processing, but they are not robust to lighting changes.11–17
The results in Liao and Tsai 14 have shown that image-tag-based localization using machine learning (ML) achieves better accuracy than using PE algorithms, especially in the long-range scenarios. This article designs an image-tag-based indoor localization using end-to-end learning, in which tags designed are placed on the walls with known IDs and positions. The camera that acquires images for positioning could be from any handheld devices or from a moving vehicle. The proposed system resolves many of the aforementioned drawbacks and has the following unique features:
It is a deep learning (DL)–based method with better learning abilities. The ML scheme 14 only accepts vectors as inputs and generally relies on manually designed features. Using manually designed features requires domain knowledge and the designed features are not necessary optimized for learning the mapping from input to the label. The proposed approach uses DL to automatically learn the necessary features directly from the input images. Also, since DL models can learn any arbitrary mappings, they achieve consistent performance in cases such as when the input images are blurred, have low resolution, or are partially covered, as long as they see similar samples in the training sets.
It takes into account all potential distortions, including the wide-angle lens distortion, via end-to-end learning. Instead of trying to estimate the distortions with few parameters as done in Wu et al., 20 DL models are able to learn the highly non-linear mappings directly from the original tag images to the final two-dimensional (2D) position of the camera through training. Within these mappings, all distortions introduced by the lens and/or camera are represented. Therefore, the proposed scheme does not require distortion estimation, nor suffer from estimation error issues.
The tag designed in this proposed system is shape-based, rather than color-based. Therefore, it is more robust to lighting changes in the environment.
The proposed system is designed to be easily adapted to new lenses/cameras and/or new tags, allowing fast and easy deployment without requiring knowledge from domain experts.
Finally, since the DL model has a higher computational need than ML, new algorithms are developed to make it suitable for real-time applications running on mobile or embedded devices.
In summary, the proposed method can learn the mapping from original tag images to the final position of camera through automatic feature extraction. And it accounts for all potential distortions when doing the mapping learning. In addition, the tags were specially designed to against the lighting change. We will discuss the proposed scheme in detail in section “Image-tag-based localization with DL,” including tag requirements and appropriate tag designs, tag segmentation and classification, distance and angle extraction, and camera position estimation using distance and angle information. Section “Experiments and results” presents a comprehensive set of experiments in a real environment and discusses a complexity issue of the proposed system, as well as potential solutions to help achieve real-time performance even on a mobile or embedded device. A discussion on the possibility of a standard flow for the proposed system to be quickly deployed and adaptively accommodate new changes to the tags and/or lenses/cameras is also provided in this section.
Image-tag-based localization with DL
Figure 1 shows the process of the proposed scheme. First,

The image-tag-based localization framework.
For localization as illustrated in Figure 2, first, a camera automatically scans its environment. If the scanned photo contains at least one tag, then the tag(s) is segmented out and is used to estimate the tag ID, distance, and angle information via the pre-trained CNNs. Distance here refers to the distance between the camera and the tag, while angle refers to the angle between the line perpendicular to the tag and the line between the user and the tag,

Illustration of localization process.

Determining location with information extracted from the tag image.
The CNN model could map the tag image to a final 2D position of the camera directly. In this article, we estimate the distance as well as angle because the distance estimation is much more reliable than the angle estimation. Therefore, if multiple tags are present, it is better to use distances from the tags to estimate the location, just like the radio-frequency (RF) signal localization schemes do.21–30
Tag design
To effectively extract useful information from an image of the tag through a CNN, the design of the tag should meet the following requirements: (1) it is easy to create a large number of different tags in order to cover a large area; (2) it has simple features, so that it can be seen clearly from far distances; (3) it has non-symmetric features, to distinguish positive and negative angles; (4) for reliable detection or segmentation, the features should be shape-based, not color-based. Although it is easier to segment the tag from the photo with color-based features,11–19 features from color are not robust since lighting variations could fail the segmentation; (5) all tags should have a common feature for tag segmentation as well as distance and angle information extraction.
There are existing tags designed for different purposes. Examples of existing tags are shown in Figure 4 and a summary of such tags is listed as follows:11–19,31,32
QR-Code: it uses a quadrilateral visual tag where information is stored in a binary pixel matrix of 1817–7089 characters, depending on the alphabet used. A main problem of its visual tag is its rather low detection speed, due to the large amount of information stored in it.31,33
Maxicode: this system, which is used in the US postal services, is a quadrilateral visual tag, where information is stored in a hexagonal binary pixel matrix. Unlike the QR-Code, its visual tag can store up to 93 characters, and thus can be detected quickly.31,34
CyberCode: in this system, information is stored in a binary pixel matrix. Unlike QR-Code and Maxicode, its visual tag is designed for quick and robust detection.31,35
ReacTIVision: this system, which is used in “Reactable,” uses a very simplistic quadrilateral visual tag, wherein the information is stored according to the shape of its internal pattern.31,34
ARToolkit: it is probably the first one for positioning applications. It uses a quadrilateral visual tag where information is stored according to the shape of its internal pattern. Because detection is based on recognizing the pattern of its visual tag, this pattern should be unique to be easily detectable in a natural environment, and be simple to be quickly detectable.31,34
ARTag: this system, a successor of the ARToolKit, uses a quadrilateral visual tag, wherein up to 36 characters of information can be stored in a binary pixel matrix, which is protected by an FEC code. Its visual tag is quick to detect since the matrix contains very little information. It is robust against rotation and perspective views.31,34

Existing tags designed for different purposes.
The QR-Code and Maxicode are used only for near distance applications whereas other tags could be read from long distances, but they either miss a common feature or not have a non-symmetric pattern. None of these tags meet all the requirements for the proposed localization system.
An example of the tag that meets all the requirements is shown in Figure 5. The top-left, non-symmetric square that consists of small circles is designed for segmentation as well as distance and angle information extraction. Since the squares form the boundary of the tag, segmentation is done by identifying the boundary. The reason for the use of small circles, rather than solid lines, to form the square is that the small circles enrich the features. The rich features can help distinguish the tag from the background and, therefore, simplify segmentation. However, overly complex features will cause issues; for example, they cannot be seen clearly from a far distance. The square is the common feature of all tags, but its shape and size will change when seen from different distances and angles. So, the distance and angle information is encoded in the “distortion” of the square seen in the image.

A tag design example.
The bottom left of Figure 5 shows some features that are used to fill the inner blank space of the square to generate different tags through combination and permutation of their features. Note that many more such features can be designed. Therefore, a large number of different tags can be designed easily. The right-hand side of Figure 5 shows an example tag with filled features.
Tag detection
As shown in Figure 1, tag identification, and distance and angle estimations all depend on tag detection. Object detection has been a well-studied problem in DL, like the Single Shot MultiBox Detector (SSD) 36 and You Only Look Once (YOLO) 37 architectures, which have achieved real-time performance with high accuracy and have already been widely used in many applications. However, training these models requires extensive manually labeled examples, making them difficult for fast deployment. In addition, if the designed localization system needs to adapt to new lenses or newly designed tags, then all training samples must be relabeled manually, which is a time-consuming and labor-intensive task. To this end, instead of using SSD or YOLO models to detect the tag in the image, the template matching style method is used.
For the proposed image-tag-based localization, only the square feature is needed, rather than the exact boundary of the object. Note that the outer square feature could become a parallel, echelon, or other shapes when viewed from different angles and distances. Thus, making full use of the common feature for all tags is critical. The square as shown in Figure 5 aims to provide simple, accurate, and robust detection. It is also possible that one image could capture more than one tag. In such a case, all tags captured should be correctly detected.
A good detection should be precise and complete, as illustrated in Figure 6. The best-known template matching methods are SIFT 38 and speeded-up robust features (SURF). 39 An issue with SIFT is that it is not robust to changing light conditions and when the image is blurred; in such cases, it may result in incomplete and occluded segmentations. We develop an accurate and robust segmentation method that involves three steps: key feature searching, clustering, and prediction.

Example of segmented tags.
Key feature searching
Key feature searching learns the key features in the template and extracts similar features in the target image and locates them. The top plot of Figure 7 shows examples of some key features extracted (the dots). Note that part of the extracted features are caused by the environment, instead of the tags, albeit they resemble the key features.
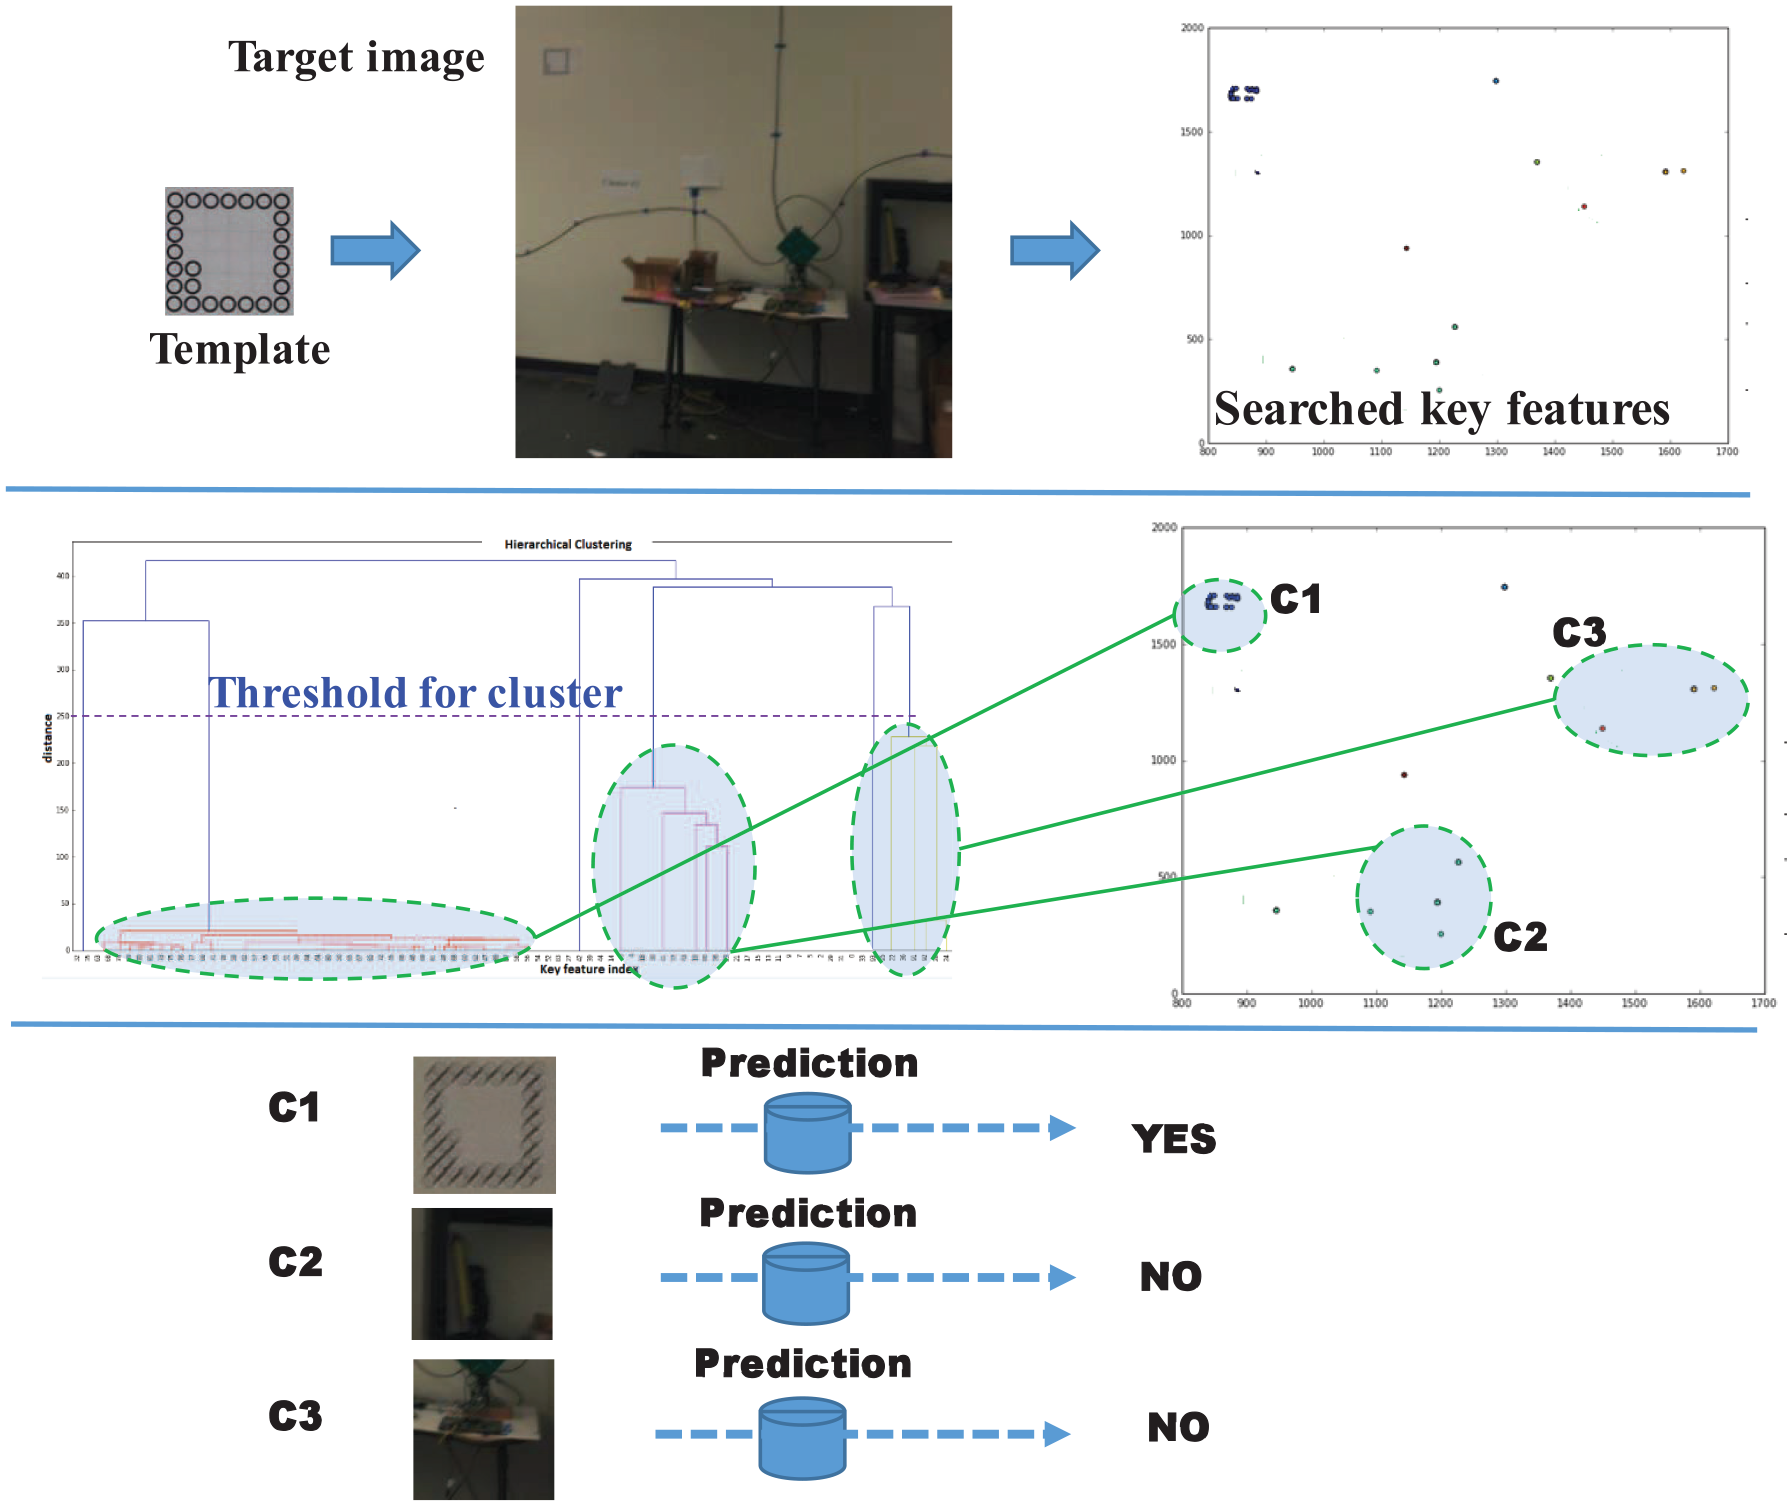
Tag segmentation.
Hierarchical clustering
The second step employs the hierarchical clustering method
40
to cluster the key features. With some proper threshold, several main clusters can be formed. The example in the middle of Figure 7 shows that there are three main clusters, labeled as
Prediction with one-class CNN model
In the third step, a small CNN model is trained to determine whether the segmented patch is a complete tag or not. Only patches with complete tags are kept and other patches are discarded. The CNN here is basically a one-class CNN problem, as it only tries to predict whether the input is a tag or not. 41 It is easy to define what the class is with one-class classification. For example, the input segmented patches are judged to be tags if they contain a tag. However, it is difficult to define what is not a tag, as the environment could be different, and it is therefore unable to emulate all scenarios that are not tags. In our case, tags occluded by a large portion are considered as non-tag. To get the training data for this model, the samples of tags are generated via image transformation such as affine transformation, while randomly sampled environmental images are used for non-tag class. Therefore, no manual labeling is involved.
Tag classification
Since tags are distributed in the building and are associated with their real positions, if the segmented tags can be correctly identified, then the location of the camera can be determined. Since each tag has its own special features (or a combination of features), an exact mapping between tags and IDs can be established. To identify each tag, a neural network with manually made features is used in Anwar et al. 19 Those manually made features are specially designed for their tags and are not guaranteed to be the best features. To improve the performance, a VGG16-based CNN 42 is trained to predict the ID of the segmented tag. The CNN model is able to automatically extract better features toward the target tasks than those manually made features. The configuration for the classification-based CNN is shown on the left side of Figure 8. The VGG16 architecture contains 16 layers, and it follows this arrangement of convolution and max pool layers consistently throughout the whole architecture. In the end, it has two fully connected layers followed by a softmax for output. This model achieves 92.7% top-5 test accuracy in ImageNet, which is a data set of over 14 million images belonging to 1000 classes. It was one of the famous models submitted to ILSVRC-2014.
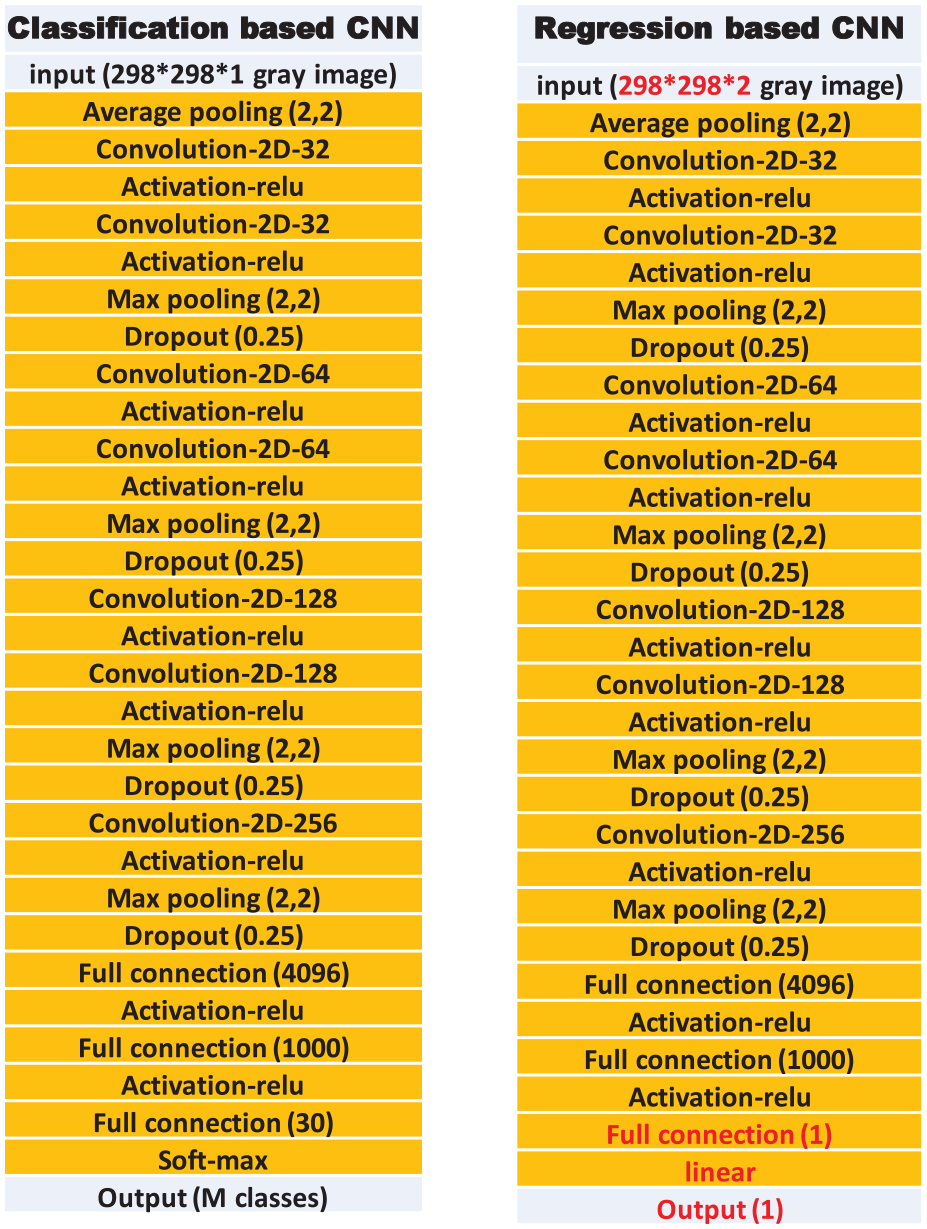
Configuration for the classification and regression-based CNN.
Distance and angle extraction
In the proposed system, the tag-camera distance and angle information is extracted from the segmented tag as illustrated in Figure 2. There is a certain relationship/mapping between the distance and the shape as well as the size of the tag that appears in the photo when the photo is taken from different angles. This mapping is a many-to-one mapping, mathematically written as


where
An example of such mapping is shown in Figure 9, where the images of the tags at the top are taken from 3 m away while the bottom ones are taken 7 m away at different angles.

An example of the mapping between distance and the size of the segmented tag.
Similarly, there exists a relationship/mapping between the angle


Camera rotation. Left: without rotation. Right: with rotation
where
This effect is caused by a combination of different distortions introduced by the lens, and will be much worse with wide-angle lenses. So, this distortion should be considered in both distance and angle extraction. Although it can be estimated, the distortion comes from a combination of many different sources and is highly non-linear and complex. Thus, the correction is at best an approximation with few parameters and the errors are unevenly distributed over the image.
20
The error of the corrected image with estimated distortions will affect the accuracy of localization since it is sensitive to the transformed tag shape in the image. When the camera is rotated in different angles, the tag will appear in different locations in the image, as shown in Figure 11. Also, the mapping between the rotation angle

where the


An example for rotating the phone horizontally when fixing the location of the phone and the tag on the wall.
Instead of using distortion estimation and PE algorithms to estimate the location, CNN models are used. CNN models are able to learn the highly non-linear mappings directly from the original tag images to the final 2D position of the camera through training examples. Within these mappings, all distortions introduced by lenses and/or cameras have already been represented, avoiding the error of distortion estimation. This is also applicable to the distortions with wide-angle lenses.
The distortion is location dependent; for example, the barrel distortion along the border of an image is more severe than that at the middle. However, correction is done on the full-size image, which requires additional computation. For CNN models, the full-size images will greatly increase the computation if they are used as inputs. Instead of using full-size images as the input, to clearly tell the CNN the location of the tag in the image, we manually make an image, as shown in the left of Figure 12, where some black points in a blank (white color) image are used to represent the location of the tag in the image. The size of the manually made image is shrunk to the same size of the segmented tag, so that they can be concatenated and passed to the CNN. This manually made image could be done easily since after tag segmentation, since the location of the tag in the photo is known.
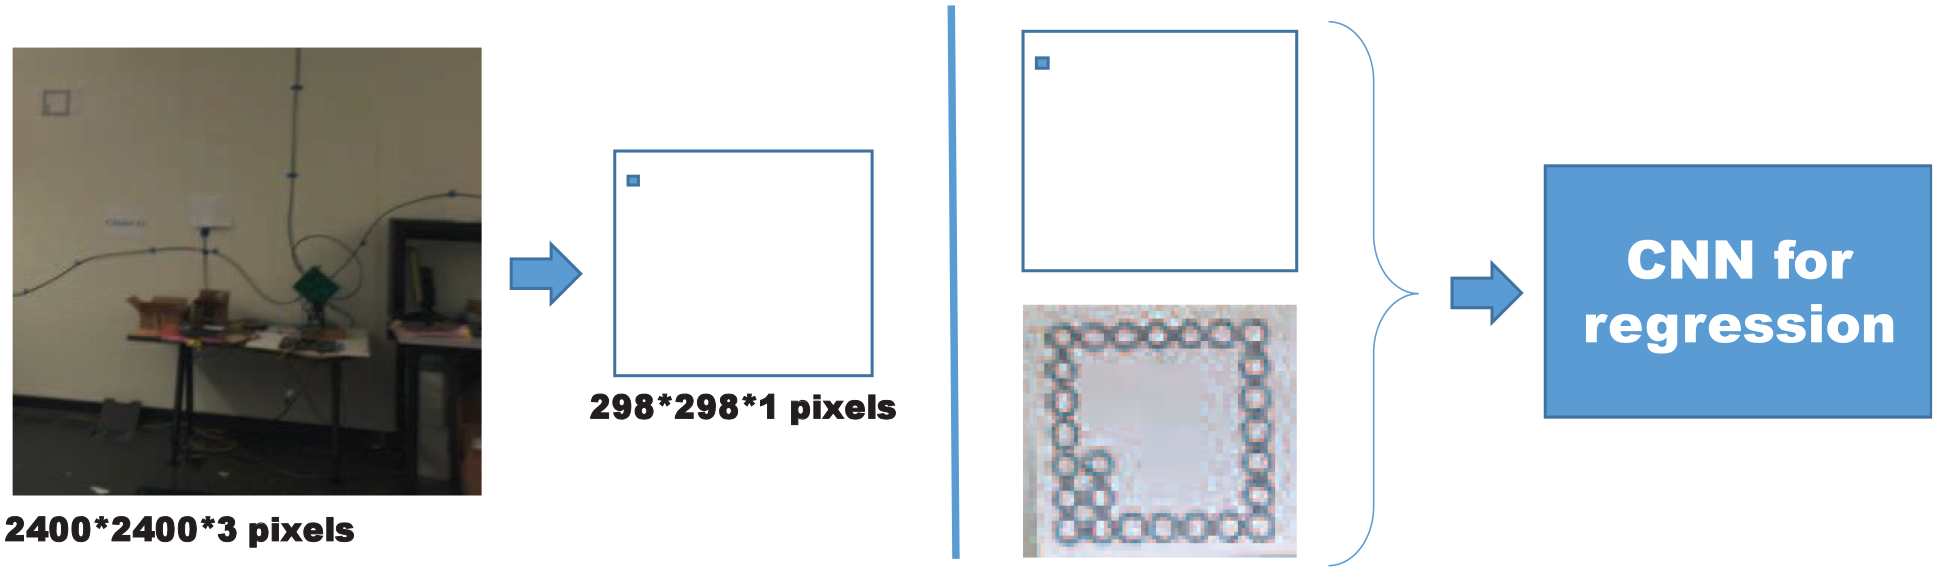
Manually made image for CNN. Left: an example for a manually made, black-and-white image to represent the location of the tag in the photo. Right: concatenate the manually made image and the segmented tag as the input to CNN.
Location estimation
With the tag ID, distance, and angle information, the location of the camera could be estimated using the approach shown in Figure 3. Note that, if more than one tag appears in a photo, the accuracy of location estimation will improve.
Experiments and results
Experimental setup
Experiments were conducted in a lab to implement the processes described in Figure 1. Tags as shown in Figure 5 with a size of 19 cm × 19 cm were printed in black-and-white. Ten different tags were used to test the tag segmentation and tag classification. Then, some tags were attached on the wall. About 1000 photos were taken with an iPhone for each tag from different distances, angles, and manually changed lighting conditions. To speed up the photo-taking process, the burst function of the iPhone was used, which resulted in severely blurred images.
The size and shape of the tag in the photo vary, and a square shape was used to segment the tag from the photos. Since the segmented images vary in size, they were padded with some values (e.g. 128) to make them the same dimension (e.g. 298 × 298 pixels), as shown at the bottom of Figure 9, where the small dark square is the segmented image and the outer gray square is after padding.
Data set
The data set contained about 10,000 photos for 10 tags. After discarding about 500 bad images that could not be recognized, the rest were segmented using the proposed methods. In this segmentation method, the main feature is the common square shape feature composed of small circles. There were about 9100 photos that could be correctly segmented; most of the failed cases were the severely blurred photos. The segmented tags were then labeled with their own IDs for CNN. To distinguish the different IDs, the different combination of small shapes inside the common square shape is used as the features as the inputs to the classification-based CNN.
Training
The classification-based CNN, as shown in Figure 8 (left), was trained with 80% of the segmented tags and validated on the remaining 20%. The validation accuracy was around 98%, which could be improved further with larger training sets and with better diversity.
To train the regression-based CNN for distance and angle estimation, we conducted an experiment as shown in Figure 13 in a lab, where there were 117 training positions and 46 testing positions. Due to the space limitation, the maximal distance was around 8 m. For each training and testing position, around 300 photos were taken with the burst function of an iPhone. To mimic the environmental lighting changes, the lighting density was manually changed during the data collection process. Each tag in the photo was segmented and labeled with its real distance and angle. Note that the distance and angle were normalized to within the range of [0,1] to facilitate the learning. The distance was normalized by 10 m; for example, an actual 5 m of distance was normalized to be 0.5. The angle was normalized by 180° (i.e. the 90° was normalized to be 0.5). All training data (here they refer to the segmented tags) were normalized with the mean and variance of the data set, and so did for testing data.

The setup for training and testing of distance and angle extraction.
Both distance and angle were trained with the same regression-based CNN, as shown at the right of Figure 8, and with the manually made image, as shown in Figure 12. Note that the distance and angle were trained separately for the 2D case (i.e. only the x- and y-coordinates were considered with camera kept at the same height when data were acquired).
Results
Test results for distance and angle are shown in Figures 14 and 15, respectively. The mean of the distance estimation error is low, mostly less than 10 cm, and the error for various distances is consistent. The standard deviation is also low in the whole range, but the value slightly increased with distance. The mean of the angle estimation error is less than 6°, with about half less than 3°. It is found that the angle error increases when the camera is around 90°, likely because in these areas the change of the shape of the tag is too small and is thus difficult to recognize by the CNN.
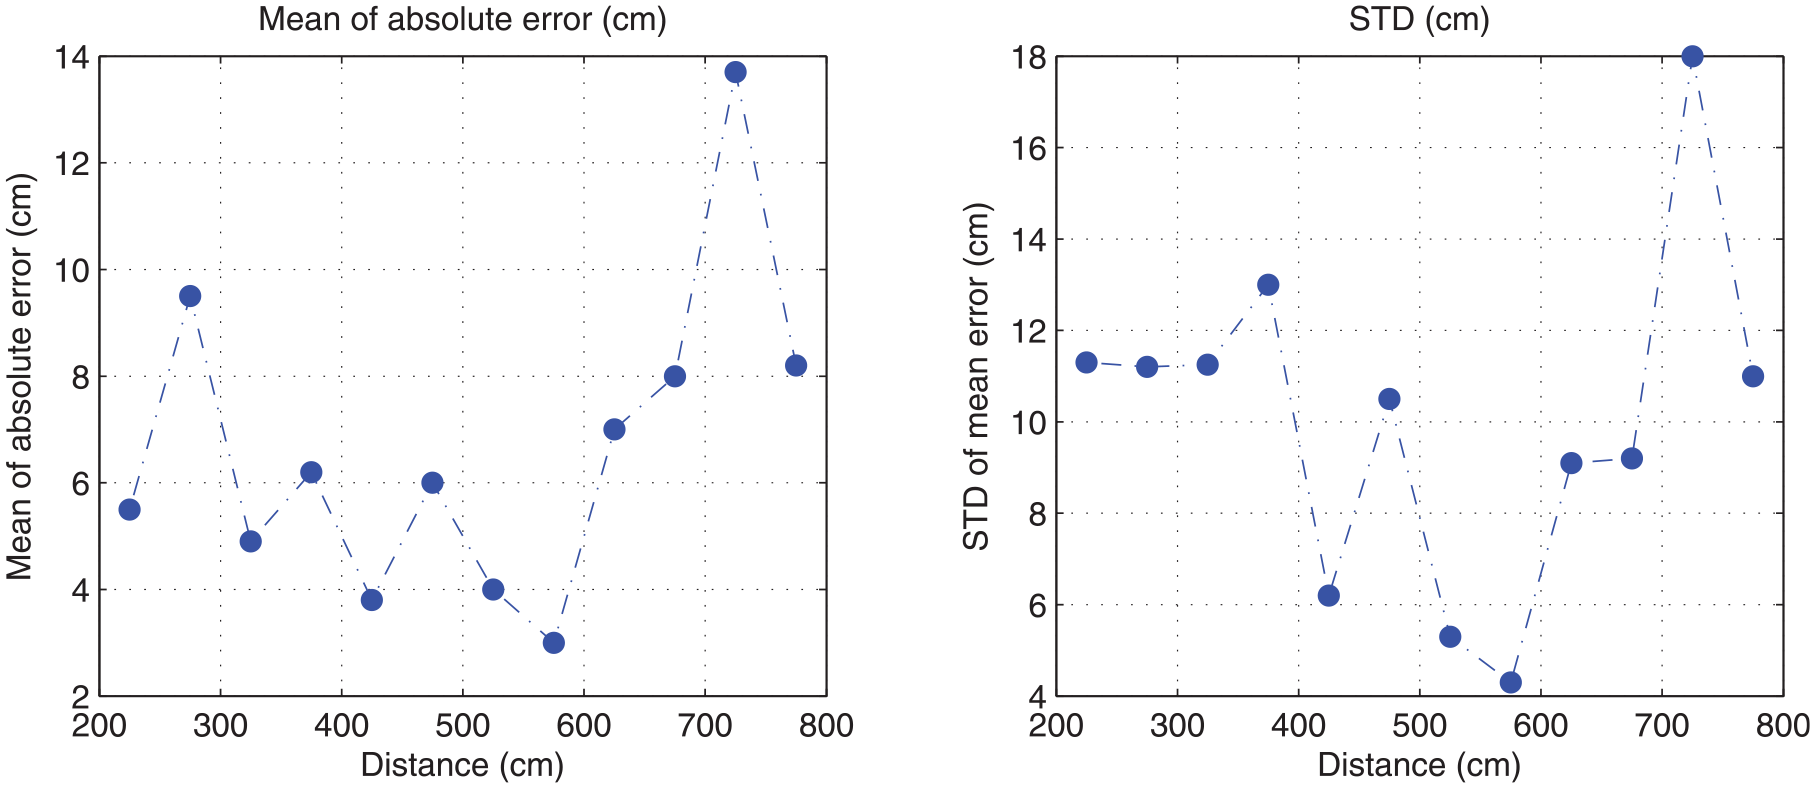
Distance extraction results.

Angle extraction results.
Localization experiments with one and two tags were conducted. During the experiments, the lighting change was also applied manually. In the one-tag case, each photo contains one tag, and the camera’s position is the intersection of the semi-circle and the line, as illustrated in Figure 3. The tag position, camera’s real positions, and the estimated positions are shown in Figure 16. At each testing location, around 100 photos were taken. The average location error is found to be about 1 m.

Localization results with one tag.
The setup for the two-tag case is shown in Figure 17. In this case, each photo taken contains two tags. So, for each testing position, two distances and two angles can be obtained. The camera position is one of the two intersections of two circles. The angle is then used to identify which of the two is the correct intersection. In this case, the average location error is found to be less than 20 cm.

Localization results with two tags.
Compared with the ML-based method with hand designed features, 14 the above testing results show that the proposed end-to-end learning system can also achieve reasonable positional accuracy with automatic feature learning. And the performance is relatively consistent with distance, unlike the one in Anwar et al. 19 with PE-based method, whose accuracy drops with the distance. In addition, the testing results considered the lighting changes, which the other methods did not.
Analysis of error factors
As described by equations (1) and (4), the positioning accuracy is a function of both the distance
First, training data were limited. Both
Second, since the angle is related to the shape of the tag in the image instead of the size, it is possible to up-sample the tag when the tag is small (or when the camera is far away from the tag) to increase the image resolution so that CNN performs better.
Third, increasing the sample data (
Discussion
Resolving the issue of high computation needs
The proposed system is DL-based, which requires much more computational power than traditional PE algorithms. However, optimization methods from recent developments in DL community could help achieve real-time performance even on mobile or embedded devices. The proposed system consists of three DL models (for tag identification, and distance and angle extraction), which take up the majority of the computations. There are several ways to optimize it. First, the latest MobileNet 43 and GhostNet 44 architectures could save up to 100 times of the computations while maintaining a similar performance when compared to the VGG-16 network used in the experiments. Second, since the three DL models use the same inputs, they can be merged into a single model (requiring the computation of only one model) by sharing the same weights using multi-task learning. 45 Third, graphics processing unit (GPU) has been widely integrated into many embedded systems and even phones today, which can further speed up the computation for DL model inference. In addition, software optimization for DL model inference could also enhance the real-time performance. For example, the TensorRT 46 could optimize the DL model into 8-bit calculation and provides up to four times of additional saving of computation time.
Building a standard flow for quick deployment
As discussed in section “Introduction,” image-tag-based systems using PE algorithms have major problems that prevent them from being widely deployed: tag density must be high to maintain a good accuracy, and each system designed is specific to a set of pre-designed tags and lenses/cameras; if the tags and/or lenses/cameras have changed, then domain experts are required to redesign the system to adapt to the new changes.
The proposed system overcomes these problems, and facilitates a design with a standard flow to achieve excellent performance with much fewer tags and much greater adaptability to new changes without requiring knowledge of domain experts. First, using wide-angle lenses will dramatically reduce tag density. However, this will introduce in barrel and potentially other distortions for which PE algorithms16,20 are ineffective to deal with, as discussed in section “Introduction.” The ML-based method 14 simply ignores such distortions. The proposed method takes into account all distortions by mapping the image tag to the final positions using end-to-end learning, where the mapping relationship contains all effects including distortions, as shown in section “Location estimation.” Thus, it naturally accommodates the use of wide-angle lenses.
Second, the proposed method involves steps of data collection, tag detection, tag identification, distance, and angle extraction. Data collection as illustrated in Figure 13 a standard process that can be done by anyone. Tag identification and distance and angle extraction processes are all DL-based, which requires a large amount of labeled data for the DL model training. With a careful design, however, this labor-intensive work can be avoided. After data collection as shown in Figure 13, all captured images or videos have already been associated with labels including tag ID, distance, and angle information. Through template matching style detection, which does not need labeling, cropped tags are associated with corresponding labels automatically. The remaining processes are for training or fine-tuning the DL models, which can be automated with new training data once the DL architectures are defined and the training hyper parameters are set. Therefore, via such a standard flow, the proposed system can be quickly and widely deployed without requiring domain expertise.
In addition to the standard flow mentioned above, to make the system adaptable to other different cameras, the in-device software will be required to capture and control the lens parameters. And these parameters will be part of the input to the algorithm to adapt the changes.
Conclusion
A new image-tag-based indoor localization method has been proposed in this article. With uniquely designed tags that are trained and can be populated in any space where positioning take place, we train several CNNs to classify the tag ID, and to estimate the distance as well as angle information with the segmented tag in the image taken by a camera. The position of the camera is then determined from the extracted distance and angle. The tags need to be trained only once and then can be used anywhere, which makes deployment extremely simple. Once a large number of tags are designed and trained, coverage becomes highly scalable and blind spots will no longer be an issue. The system is also robust to environmental changes and the localization accuracy could increase drastically by increasing tag density. Experiments in a lab have achieved less than 20 cm of localization errors with two tags per image.
Footnotes
Handling Editor: Lyudmila Mihaylova
Author contributions
Z.S. and H.L. contributed to the conceptualization. Z.S., R.L., and M.A. contributed to the methodology. Z.S. and R.L. contributed to the software. H.L., Z.S., and M.A. contributed to the writing—original draft preparation. R.L. and A.A.-H. contributed to the writing—review and editing. H.L. contributed to the supervision. M.A. and A.A.-H. contributed to the funding acquisition.
Declaration of conflicting interests
The author(s) declared no potential conflicts of interest with respect to the research, authorship, and/or publication of this article.
Funding
The author(s) disclosed receipt of the following financial support for the research, authorship, and/or publication of this article: The authors acknowledge the Deanship of Scientific Research at King Faisal University for the financial support under Ra’ed Track (Grant No. 207002).