
Abstract
The spatiotemporal dynamic changes of forest biomass can provide scientific reference and scheme for improving the quality of forest resources and the ecological environment in karst areas. In this article, the China’s National Forest Continuous Inventory data (from 1984 to 2015) was used to analyze the dynamic changes of forest biomass with the univariate linear slope k, barycenter trajectory, improved hot spots detection which was applied in the analysis of forest biomass dynamic change, and geospatial detector method in Guizhou in the first time. The results showed that the total forest biomass had a steady upward trend, 29.3% unit biomass of the forest had significantly increased, while 1.4% decreased dramatically. The forest biomass gravity center shifted from Qiandongnan to Qiannan, with a total distance of 54.1 km. Thus, the following conclusions were drawn: (1) benefiting from the effective implementation of forestry-related policies, the forest biomass had significant increased in a long time series, especially for the artificial shelter forest; (2) the gravity center shifted to the northwest and the number of level 1 forest biomass hot spots increased year by year, which showed a generalized symmetric pattern along the Wujiang River mainstream; and (3) the results of geographical survey showed that the change of forest biomass was greatly affected by topography, climate and human activities, among which terrain factors had the greatest impact.
Keywords
Introduction
Forest is an important part of the terrestrial ecosystem.1,2 It has complex community structure, rich biodiversity and important ecological functions. It plays an extremely important and irreplaceable role in maintaining global climate, adjusting carbon balance,3,4 improving regional ecological environment, and sustaining the development of natural resources.5–8 Forest biomass is one of the most basic characteristics of the forest ecosystem.9,10 It is an important factor in the study of environment and climate model, and also an important parameter to evaluate forest productivity and forest carbon sequestration efficiency.11,12 It not only reflects the management quality and development value of forest but also represents the complex material cycle and energy flow relationship between the forest and its ambient environment.13–15 The analysis of spatiotemporal changes and driving factors of forest biomass at regional scale can provide scientific reference for the long-term planning of forest management. China’s National Forest Continuous Inventory (NFCI) is a method of forest resources investigation which aims to understand the current situation and dynamics of macro forest resources. It takes a single province as the unit, and carries out regular review mainly by using fixed sample plots. 16 It is an important part of the comprehensive monitoring system of the national forest resources and ecological conditions. The results of NFCI are the important basis for reflecting the national and provincial forest resources and ecological conditions, formulating and adjusting forestry policies, and supervising and inspecting the target responsibility system of forest resources. Most research results about biomass spatiotemporal analysis are based on short time series. For example, Fang et al. 16 estimated and analyzed the China forest biomass using the National Forest Continuous Inventory (NFCI) data. Jenkins et al. 17 used forest survey data to estimate biomass and Net Primary Productivity (NPP) in the Mid-Atlantic region (the United States). Sacchelli et al. 18 used spatial analysis tools to make an effective economic evaluation of forest biomass production in central Italy. As for driving factor analysis, Hetzer et al. 19 studied the disturbance of wildfire and spruce budworm on forest growth. Rijal et al. 20 applied the new point model reconstruction method to analyze the aggregation of forest plots and conducted a cross scale sampling strategy analysis of tropical forest biomass. Buermann et al. 21 studied the relationship between warm dry climate and vegetation change, and found that they were closely related.
In karst areas of China, rocky desertification is widely distributed. There are many types of karst landforms. The ecological foundation is fragile and the forest site condition is poor, which directly affect the sustainable development of forest and the construction of ecological civilization. 22 It is of great significance to study the long-term spatio-temporal dynamic changes of forest biomass in karst areas and explore the driving factors of forest biomass changes for promoting the accurate improvement of the ecological environment in Karst Areas.22,23 In recent years, the study of forest biomass and its spatio-temporal variation in karst area has been a hot topic in the field of ecology and forestry.24–28 Zhang et al. 29 used the NFCI of Guizhou Province to map the distribution of forest resources and forest structure. They found that the geographical distribution of forest was uneven, and there were obvious differences in the structure of forest biomass. Tian et al. 30 used the NFCI of Guizhou from 1979 to 2000 to make statistics on forest area and forest volume and summarized the dynamic changes of forest resources in Guizhou Province. Ma et al. 31 analyzed the spatial distribution pattern from different areas, land types and forest stands by using the NFCI of Guizhou. They found that the biomass in karst landform was low and it was related to the mountain terrain and human activities. Based on the SPOT-NDVI data combined with vegetation type, meteorological and rocky desertification data, Xiao et al. 32 analyzed the vegetation changes and driving factors, such as climate, in karst areas in Guizhou from a macro perspective. Lü et al. 33 explored the temporal and spatial dynamic changes of karst forest vegetation, and found that the forest vegetation in karst area was more vulnerable to climate change than that in non-karst area. Tong et al. 34 analyzed the spatiotemporal change of forest vegetation in southwest karst area from 2000 to 2015, and discussed the influence of regional comprehensive management project, climate change and other factors on forest resource production.
However, it is difficult to obtain the ground truth data in karst areas as well as the long-time series of measured plot data.34,35 Until now there are few research reports on the long term temporal and spatial analysis of forest biomass in karst area. The current research is limited to the overall analysis of the spatial-temporal changes of biomass,30,31,36 lacking of accurate biomass positioning and analysis of local region which can be constructed the spatiotemporal evolution circle of forest biomass from different scales to provide supported data for precise forest management planning. This article takes Guizhou as the case study area. The main contents are as follows: (1) use univariate linear slope method and gravity center migration method to analyze the changes of forest biomass in long-time series, (2) introduce improved hot spots detection algorithm to realize local region biomass accurate positioning and classification, and (3) analyze the driving effect of spatio-temporal changes of biomass based on geospatial detector method.
Data and methods
Study area
Guizhou(4°37 ′N–29°13 ′N,103°36 ′E–109°35 ′E) is a province with the most extensive karst landform in China, and the carbonate rocks are widely distributed. 22 It is about 595 km long from east to west and 509 km from the north to the south, with a total area of 176,128 km2 (Figure 1). In Guizhou, terrain is high in the west and low in the east. It is inclined from the middle to the north, east and south. The highest altitude is 2900 m, the lowest is 137 m and the average is about 1100 m. 37 There is a typical subtropical plateau mountain monsoon humid climate in Guizhou which straddles the Yangtze River and the Pearl River. The annual average temperature of Guizhou is between −1°C and 25°C. The sunshine duration is between 900 and 2600 h, and the sunshine percentage is only 30%. Its sunshine length and radiation intensity are relatively low in China. The annual precipitation is between 500 and 2500 mm. There are generally more than 150 cloudy days and the annual relative humidity is more than 70% in Guizhou.22,23 The province is rich in vegetation types, including subtropical evergreen broad-leaved forest, near tropical valley monsoon rain forest, tropical evergreen broad-leaved forest, cold temperate sub-alpine coniferous forest and warm coniferous forest.23,38 By the end of 2015, the permanent resident population of Guizhou is 35.295 million, and the per capital GDP is 10,502.56 yuan, which is lower than the national average level. There are many ecological problems in Guizhou, such as soil erosion and rocky desertification.23,39,40

The geographical location of Guizhou.
Inventory data
The NFCI data of Guizhou surveyed in 1984, 1990, 1995, 2000, 2005, 2010, and 2015 were used in this study. The size of each square plot is 25.82 × 25.82 m (approximately 0.0667 ha), and the plots are systematically allocated based on a grid of 4 km × 8 km, a total of 5500. According to the materials of “The NFCI provision in 2014,”“The NFCI of Guizhou technical regulations” and other relevant literature, the land types noted in the NFCI data of Guizhou are summarized as follows: arbor forest land, cash forest land, shrub forest land, bamboo forest land, sparse forest land, and other forest land. 30
In this study, the above ground forest biomass was calculated based on the method of continuous function of dominant tree species and their biomass conversion factors. There is a regression relationship between the forest volume and above ground forest biomass 16

B stands for the forest biomass, unit: 103 kg/hm2; V stands for the forest volume, unit: m3/hm2; and a, b are the coefficients. The cash forest and shrub were added with 16.59 and 15.808 as cardinal number, respectively. Compared with the standard forest, the sparse forest land was multiplied by the coefficient of 0.5. 30 In the non-forest land, if there was no accumulated biomass, it was zero. The bamboo was calculated as 22.5 kg per plant.16,41 Finally, the biomass of all sample plots was calculated, and the total biomass of Guizhou can be estimated.
Supplementary data
The factors affecting forest above ground biomass include climate, topography, hydrology and human disturbance.41–43 In this article, the auxiliary data (climate, terrain and lighting) were collected to further quantitatively analyze the driving factor of biomass: (1) the boundary of Guizhou administrative division was from the bigmap data platform (http://www.bigmap.com/); (2) the digital elevation model (DEM) with a spatial resolution of 30 m × 30 m comes from the geospatial cloud data platform (http://www.gscloud.cn/); (3) the spatial resolution of Guizhou meteorological data (temperature, precipitation, sunshine, humidity, river) was 1 km × 1 km. It comes from the platform of Institute of Geography and Resources, Chinese Academy of Sciences (http://www.igsnrr.ac.cn/) and resource environment resource cloud platform (http://www.resdc.cn/); and (4) the nighttime light data were from the global radiometric calibration nighttime light data (DMSP / OLS, https://www.ngdc.noaa.gov/) provided by NOAA, and the spatial resolution was 1 km × 1 km. DMSP / OLS sensor works at night, which could detect the low intensity light from urban light, even small residential areas and traffic flow, and discriminate it from the dark rural background. The brightness of light data was positively correlated with the population density and the level of economic development and could be used as an index to reflect the intensity of regional human disturbance. 43 In this article, ArcGIS 10.6 was used to resample the terrain, climate and luminous data into 1 km grid, and then Python was used to extract the elevation, slope, slope position, average annual temperature, average annual precipitation, average annual sunshine, average annual humidity, and lighting data of the sample points.
Method
In this article, forest biomass gravity center migration method is used to analyze the spatial-temporal aggregation and migration trajectory of biomass. The improved hot spots detection method is introduced to analyze and count the hot spots classification of different levels of biomass. The univariate linear slope method is applied to analyze the biomass change at pixel scale, and the geographical weighting method is used to analyze the impact of biomass driving factors.
Forest biomass gravity center migration
The forest biomass gravity center migration can reflect the spatial and temporal aggregation and migration trajectory of a certain element in the process of spatial evolution. The spatial change of biomass can be described by the migration process of forest biomass barycenters. 42 The calculation process is that the gravity center coordinates of weighted average forest biomass (that is, the average of the centroids of all biomass sample elements and the points X,Y at the coordinates) are calculated. The iterative algorithm is used to find the coordinate position of the point which can make the Euclidean distance between all biomass point elements in the data set reach the minimum. The barycenter formula of T-Year biomass is as follows
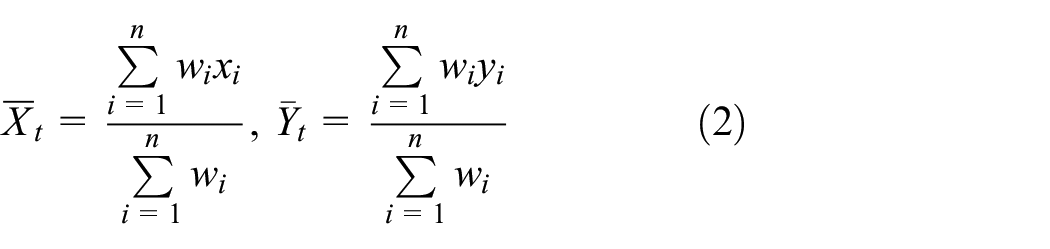
where, (xi, yi) is the coordinate of biomass sample elements, and n is the sum of biomass sample elements. wi stands for the weight of biomass of sample i.
Improved kernel density method with hot spots detection
Since it is difficult to analyze the spatial trend of discrete point data directly by graph, the point pattern analysis method is used to study the diffusion or ranking characteristics of points.43–45 As one of the most widely used methods of point pattern detection, kernel density estimation is a kind of nonparametric test method. It is used to estimate the density function of the location and get the density change of the research object. 46 It constructs a smooth surface by calculating the density of adjacent elements and realizes the transformation from discrete mode to continuous mode, which is convenient for further detection. In this process, a smooth circular surface with search radius is constructed, and the value of the center point is the biggest. With the increase of the distance from the center point, the value decreases until the distance is equal to the search radius, then the surface value is equal to 0. The output pixel value is equal to the sum of all the surface values superimposed on the pixel. 47 The formula of two-dimensional uniform kernel density is as follows
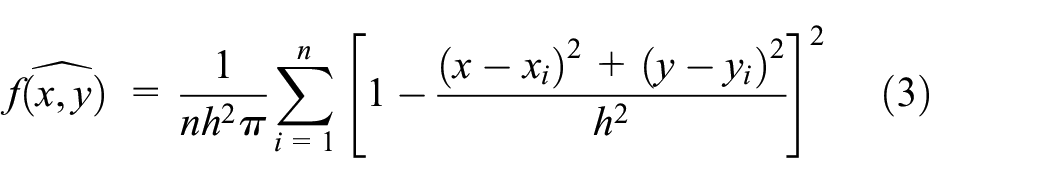
where
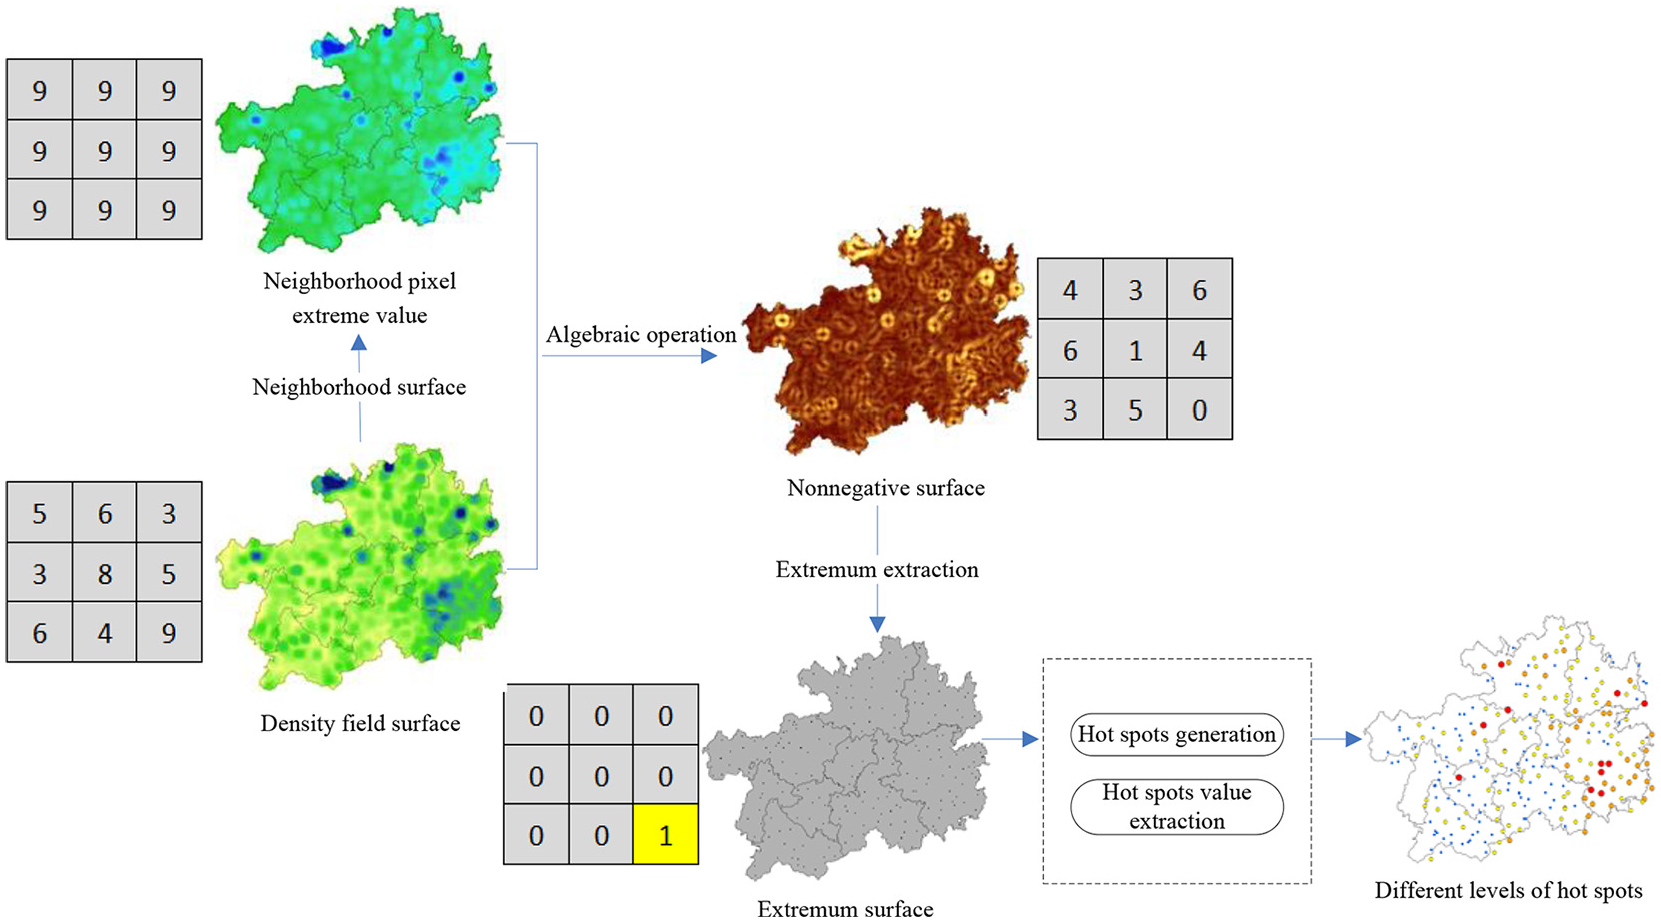
Improved hot spots detection algorithm.
The setting of the kernel density analysis bandwidth affects the results of the kernel density spatial pattern. The more sparsely distributed the point data, the larger the bandwidth; the denser the point data, the smaller the bandwidth. Moreover, the larger the bandwidth, the smoother the density surface. The bandwidth selection in this article mainly considers the sample grid spacing of the National Forest Continuous Inventory of Guizhou to be 4 km × 8 km. There are 88 counties and 1795 townships in Guizhou. The total area of Guizhou is 176,128 km2, and the average distance between each township center is about 11.18 km. This article analyses from the township scale, setting 12 km as bandwidth.
Univariate linear regression
The linear regression equation is one of the common methods to analyze the change trend and intensity of time scale. It can reveal the change trend of each grid pixel value in a specific research period. 33 In this article, the linear regression analysis method is used to calculate the evolution trend of biomass in each grid pixel from 1984 to 2015, which is expressed by the slope of the least power linear regression of biomass sample point value. The formula is as follows
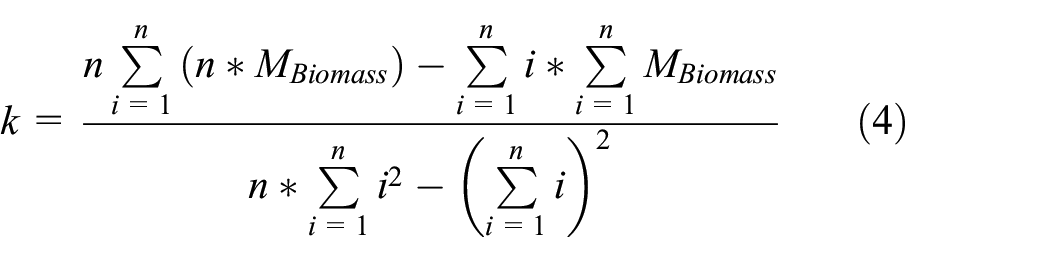
where k is the slope of biomass change. When k > 0, the trend of biomass change is increasing from 1984 to 2015, and when k < 0, it is decreasing. The larger the k value is, the more obvious the change trend of biomass is; n is the year serial number from 1 to 7 stands for seven survey years, MBiomass is the biomass of the ith year. In order to facilitate the study, the spatial and temporal changes of biomass were comprehensively detected by F test, and the biomass changes were divided into five grades: significant decrease, slight decrease, stable, slight increase, and significant increase.
The geographic detector
Geographic detector is based on the concept of spatial variation, spatial overlay technology, and set theory. 48 It measures the contribution of independent variable factors to the change of dependent variable values by comparing the spatial heterogeneity of independent variable and dependent variable maps. In this article, the geographic detector is used to analyze the driving factors of forest biomass change. The measurement index is the factor contribution q

where Y is the dependent variable factor which is the forest biomass in this article. X is the independent variable factor, that is, the terrain, climate and light data. σ2 and n represent the variance and total number of the ith stratification value of X, respectively; m is the stratification of dependent variable Y or independent variable X. The range of detection factor contribution value q is from 0 to 1. 0 means that the independent variable factor is completely independent of the dependent variable and 1 means that the independent variable factor completely controls the dependent variable. The larger the value is, the stronger the explanatory power of factor X on the spatial heterogeneity of Y is, and vice versa.49,50
Results and analysis
Time change analysis of biomass
Analysis of biomass changes in different forest types
As shown in Table 1, the unit biomass was 9.87 t/hm2 with the total biomass was 17.37 × 10⁷ t in 1984. In 2015, it was 28.47 t/hm2 and 50.1 × 10⁷ t, respectively, with the average annual increasing rate at 10% of the total biomass. The unit biomass of forest area decreased from 41.91 t/hm2 in 1984 to 35.95 t/hm2 in 1990 and then increased year by year, reaching 55.46 t/hm2 in 2015. The proportion of the forest area increased from 11% in 1984 to 33% in 2015. From 1984 to 2015, the unit biomass of non-forest land increased from 1.06 to 8.3 t/hm2 and the area proportion decreased from 59% to 47%. The biomass changes in these years are attributed to some policies issued by Chinese government. In 1987, the “Forest Law” was issued and the cutting quota regulations were implemented. In 1990, the Decision on Basic Greening of Guizhou in Ten Years was issued and the afforestation responsibility system was implemented and afforestation activities were vigorously carried out. In 1995, the Yangtze River shelter belt and Pearl River shelter belt system construction projects were implemented. In 1999, the “Six National Forestry Project” was implemented. In 2003, the “Decision on Accelerating Forestry Development” was issued. Since then, the forest resources of the whole province have been further improved. After 2010, with the further implementation of greening and beautification project, the forest site conditions have been greatly improved, and the forest resources are growing.
Changes of forest biomass in different years.

As shown in Figure 3(a), from 1984 to 2015, the natural forest biomass and plantation showed an increasing trend year by year. The natural forest biomass increased from 8.71 × 10⁷ to 23.8 × 10⁷ t, with an average annual growth of 9.1%; the plantation biomass increased from 2.3 × 10⁷ t to 17.04 × 10⁷ t, with an average annual growth of 12.3%. As shown in Figure 3(b), the total biomass of shelter belt and timber forest showed an upward trend, cash forest remained unchanged. The special purpose forest showed a slight upward trend, and fuel forest showed a slight downward trend. Among them, shelter belts increased the most, from 1.86×10⁷ t in 1984 to 19.48 × 10⁷ t in 2015, with an average annual growth of 30.1%; timber forests increased from 7.88×10⁷ t in 1984 to 16.07 × 10⁷ t in 2015, with an average annual growth of 3.4%. Since the implementation of the national forest classification management and natural protection project, many national and local public welfare forests have been planed, and a considerable part of commercial forests have been adjusted to shelter belts, resulting in an increase in the biomass of shelter belts.
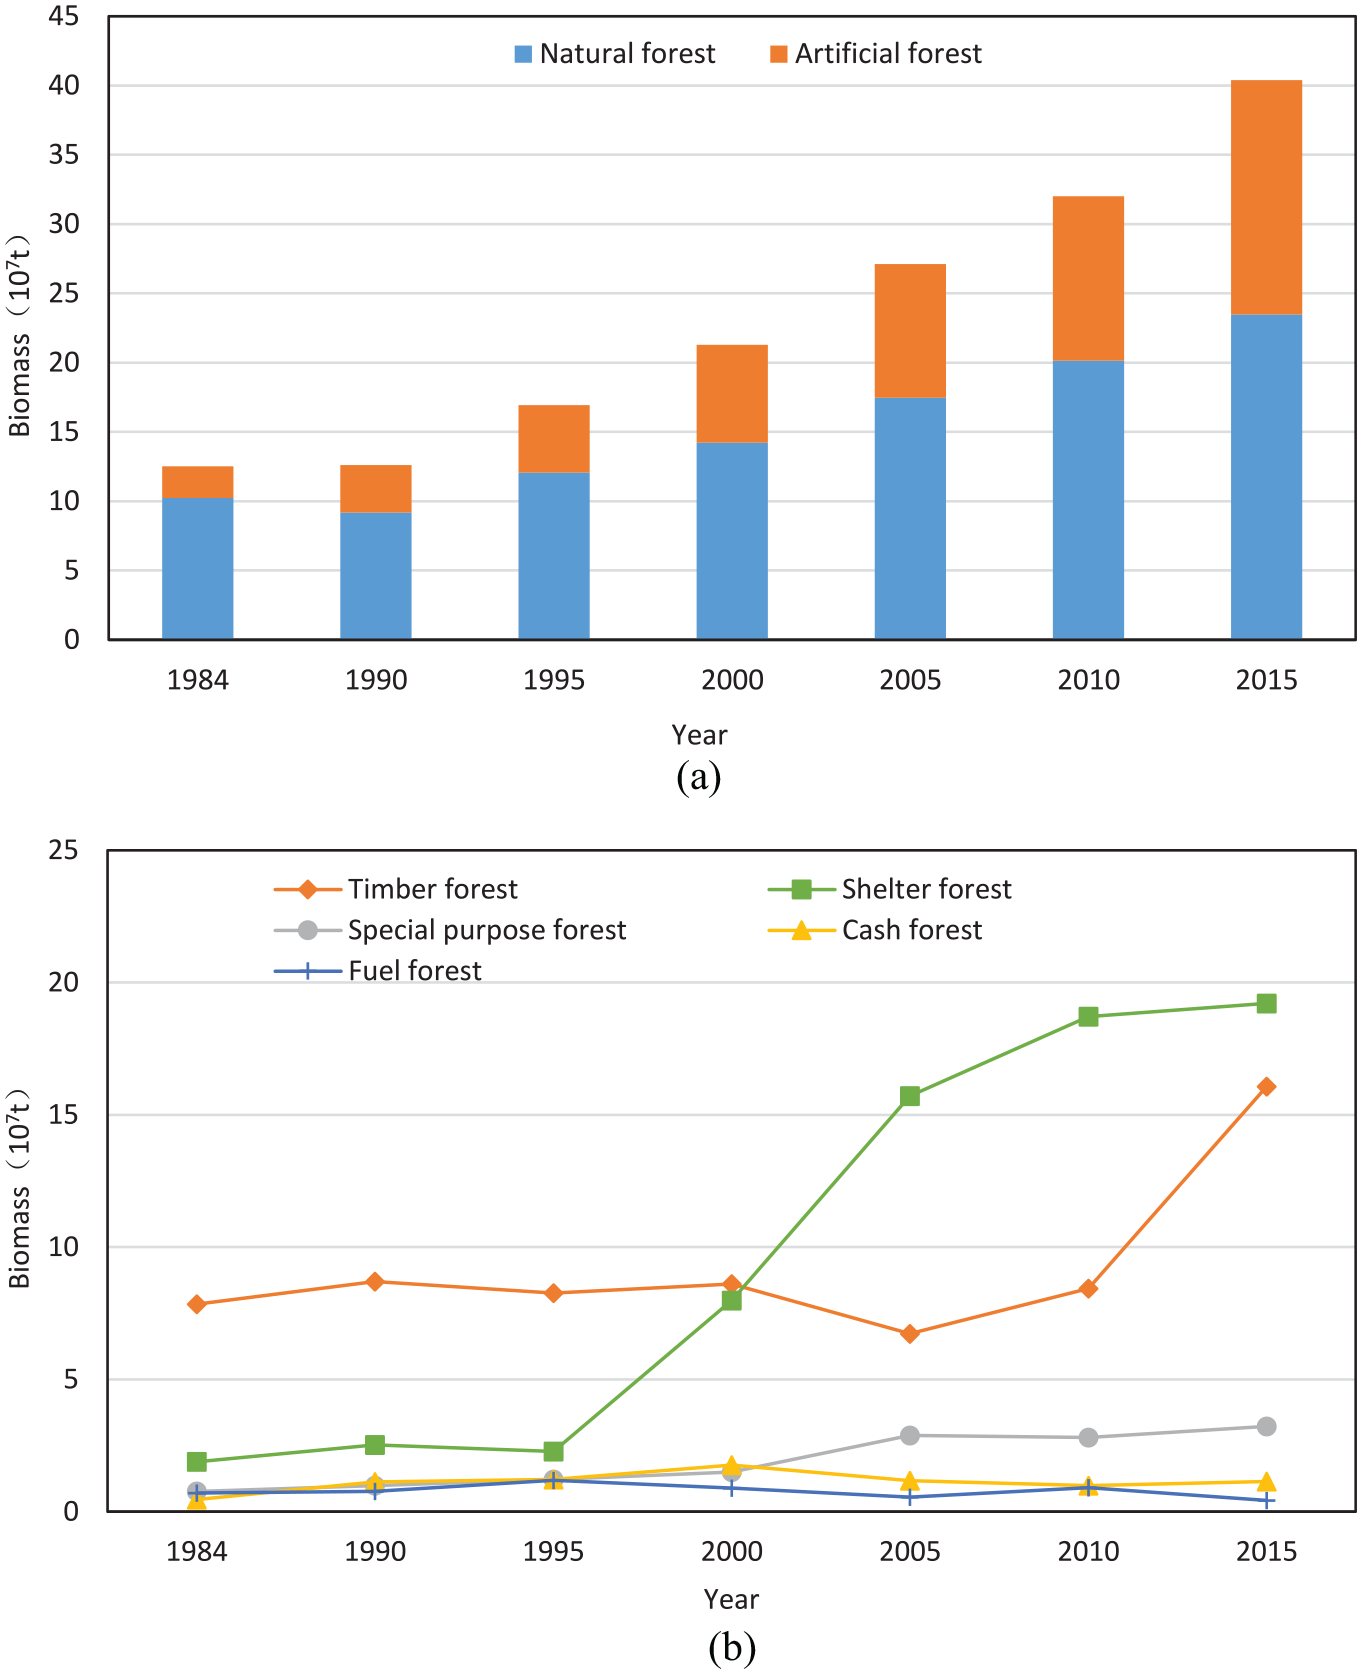
Biomass of different forest types: (a) biomass of natural forest and plantation and (b) biomass of different forest species.
Because some timber forest areas are modified to shelter belt areas and the proportion of felled area is large, the rising range of forest biomass is small. The effect of artificial afforestation in Guizhou is obvious. The past practice of single tree species afforestation has been changed, coniferous forest and broad-leaved forest afforestation have been carried out simultaneously. Vigorously advocated the planting of mixed tree species. So, the proportion of broad-leaved forest and mixed forest in artificial forest is increasing, and the tree species structure is constantly improved.
Analysis of forest biomass change types
In order to analyze the change types of forest biomass in Guizhou from 1984 to 2015, the biomass of 5500 fixed plots were substituted into formula 4 in 2.4.3. As shown in Table 2, K is the slope of biomass dynamic change. Five change types are defined by f-check method: stable, significantly increased (F > 6.61), slightly increased (F < 6.61), significantly decreased (F > 6.61), and slightly decreased (F < 6.61). There were 1609 plots with significant increase in unit biomass, accounting for 29.3%; 1419 plots with slight increase in unit biomass, accounting for 25.8%; 1892 plots with stable unit biomass, accounting for 34.4%; 501 plots with slight decrease in unit biomass, accounting for 9.1%; 79 plots with significant decrease in unit biomass, accounting for 1.4%. In karst area, there are 3827 sample plots accounting for 69.6%, of which 1109 sample plots with significant increase in unit biomass accounting for 29.0%; 912 sample plots with slight increase in unit biomass accounting for 23.8%; 1466 sample plots with stable unit biomass accounting for 38.3%; 300 sample plots with slight decrease in unit biomass accounting for 7.8%; 40 sample plots with significant decrease in unit biomass accounting for 1.1%. In non-karst area, there are 1673 sample plots accounting for 30.4%, of which 500 sample plots with a significant increase in unit biomass accounting for 29.9%, 507 sample plots with a slight increase in unit biomass accounting for 30.3%, 426 sample plots with a stable amount accounting for 25.5%, 201 sample plots with a slight reduction in unit biomass accounting for 12.0%, 39 sample plots with a significant reduction in unit biomass, accounting for 2.3%.
Forest biomass change types from 1984 to 2015.

Overall, the unit forest biomass in Guizhou shows an upward trend, and the rising proportion in non-karst areas is slightly larger than that in karst areas. The ecological environment in non-karst areas is obviously better and it is suitable for forest growth, while the ecological environment in karst areas is relatively fragile, which affects the healthy growth of forests. With the implementation of protection forest project and returning farmland to forest project in Guizhou Province, the ecological environment has been gradually improved, and the non-karst unit forest biomass also shows an upward trend. The proportion of significant or slight decrease of unit biomass in karst area is lower than that in non-karst area. Because the artificial timber forest with normal resource consumption in non-karst area, the stable areas are mainly in non-forest land.
Analysis of changes in the spatial pattern of forest biomass
Analysis of the forest biomass gravity center migration
In this article, the method of the forest biomass gravity center migration in section “Forest biomass gravity center migration” is used to analyze the gravity center of forest unit biomass to explore the spatial variation trend of biomass. As shown in Figure 4, the gravity center of biomass is located in southeast of Guizhou. The terrain in southeastern Guizhou is low, the water and heat conditions are superior, the soil is fertile, the forest productivity is high, the human disturbance is relatively light possibly because the traffic is not convenient, and the forest biomass in this area is high in general. The unit forest biomass gravity center shifts to the northwest year by year, from the position(107°50’25.118”E, 26°41’7.765”N) in 1984 to the position(107°21’2.81”E, 26°53’54.13”N) in 2015, with a total distance of 54.1 km and average annual migration of 7.7 km. Poor geographical conditions, high terrain, and serious rocky desertification in the central and western regions of Guizhou. Soil erosion leads to insufficient soil fertility and nutrients. Forest growth conditions are restricted and seriously interfered by human beings. Especially in the mid-1980s, deforestation is more serious, resulting in forest consumption greater than forest growth. The unit biomass of forest in central and western regions of Guizhou is relatively low. After the 1990s, with the implementation of a series of ecological protection and sustainable development projects and large-scale artificial afforestation in Guizhou, the soil loss has been effectively controlled, and the forest growth conditions have been gradually improved. Especially, the ecological environment has been significantly restored in the central and western regions of Guizhou. The forest biomass in Guizhou increased steadily, and the gravity center shifted to the northwest.

The center orbit of forest biomass.
Improved hot spots detection based on kernel density
Kernel density analysis is an effective continuous variable analysis method, which is applied to the analysis of biomass spatial change in this article. The hot spots detection method described in section “Improved kernel density method with hot spots detection” is used to generate the biomass density field, and then five levels are generated according to the natural break point method to analyze the changes of biomass density. As shown in Figures 5 and 6, from 1984 to 2015, the low density areas of forest biomass decreased year by year, while the areas of other levels of biomass density showed an expanding trend, and the forest biomass showed a steady growth trend. In 1984, the low density area accounted for 84.58%, medium areas accounted for 10.8%, high density areas accounted for 2.97%, higher density areas accounted for 1.43%, and extra high areas accounted for only 0.22%. The extra high and higher density areas were mainly located in southeast of Guizhou and central Tongren, while the low density mainly in the rest areas. Then, the high, higher and extra high density areas began to expand from the southeast to Guiyang, Bijie and other central and western regions. From 1984 to 2015, the area proportion of different density areas changed significantly. By 2015, the area proportion of low density areas was 24.04%, medium areas was 48.26%, high areas was 17.37%, higher areas was 8.58%, and extra high areas was 1.75%. Hot spots can represent the maximum of local density, and different levels of hot spots can reflect the change and spatial distribution of forest biomass.
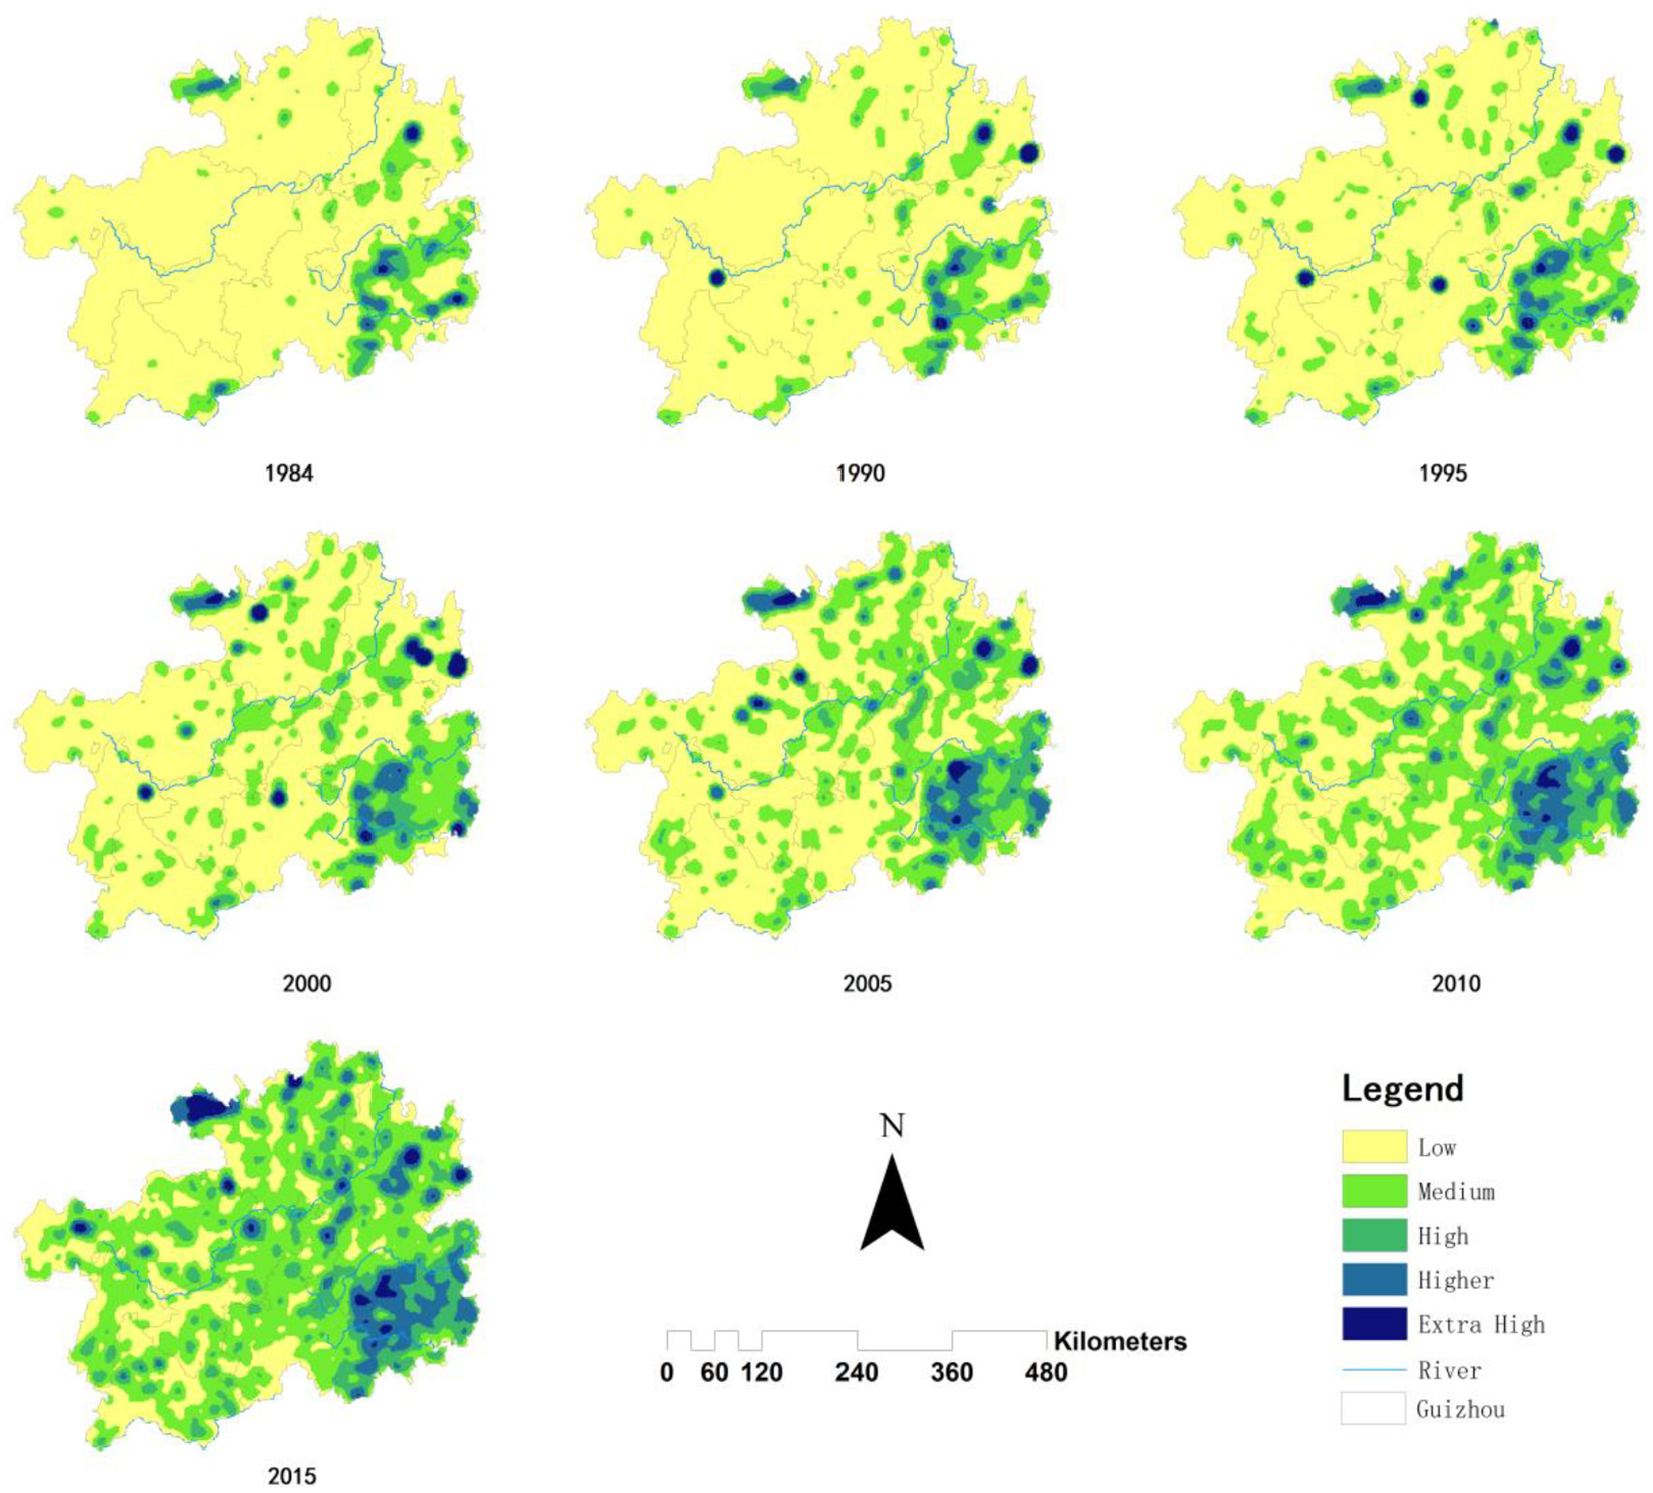
Dynamic changes of forest biomass density from 1984 to 2015.

Statistics of forest biomass density from 1984 to 2015.
Improved kernel density method was used in order to detect the location of hot spots in this article. Based on the result of biomass density field, it used the maximum extraction method and map algebraic subtraction method to extract biomass hot spots, then the hot spots are reclassified into four levels according to the natural break point method. The level 1 hot spots represent local highest density biomass points, and level 4 hot spots are the local lowest density biomass point. As shown in Figure 7 and Table 3, from 1984 to 2015, the number of biomass hot spots changed significantly. The number of level 1 to level 3 hot spots all increased, while the number of the level 4 hot spots decreased. There were 195 hot spots in 1984, 2.05% level 1 hot spots, 4.62% level 2 hot spots, 11.79% level 3 hot spots and 81.54% level 4 hot spots which were widely distributed in Guizhou. The level 1 hot spots were mainly distributed in Leishan County of Tongren City, Jiangkou County, Sandu Shui Nationality County and Liping County of Qiandongnan City. In 2015, there were 8.37% level 1 hot spots, 17.99%level 2 hot spots, 46.44% level 3 hot spots and 27.20% level 4 hot spots with totally 239 hot spots. The level 1 hot spots were distributed in southeast of Guizhou, the north of Zunyi and the central of Tongren, and specifically in Leishan, Danzhai, Liping, Taijiang and Fenggang counties. Interestingly, the level 1 hot spots presents a generalized symmetric model with Liujiang River Basin and Dujiang river basin.

Dynamic changes of hot spots distribution from 1984 to 2015. (a) Hot spots distribution in 1984. (b) Hot spots distribution in 1990. (c) Hot spots distribution in 1995. (d) Hot spots distribution in 2000. (e) Hot spots distribution in 2005. (f) Hot spots distribution in 2010. (g) Hot spots distribution in 2015.
Statistics of hot spots from 1984 to 2015.

In summary, extra high biomass density and level 1 hot spots are mainly distributed in southeast of Guizhou, the north of Zunyi and the central of Tongren, while low biomass density and level 4 hot spots are mainly distributed in central and western regions such as Anshun, Bijie, and Liupanshui. Qiandongnan, which is a low mountain and hilly area composed of pre-Sinian metamorphic rocks, is located in the middle and lower reaches of Qingshui River and Duliu river and mainly composed of warm broad leaved forests and tropical South Asian evergreen broad leaved forests. The north part of Zunyi and the eastern part of Tongren are located in the upper and middle reaches of the Wujiang River Basin, where the climate is warm and humid, together with sufficient water and heat. There are mainly evergreen coniferous forests and coniferous and broad-leaved mixed forests dominated by Cunninghamia lanceolata Lamb, Pinus massoniana Lamb, Cupressus funebris Endl and a variety of subtropical evergreen broad-leaved forests and bamboo forests. The central and western regions such as Anshun, Bijie, and Liupanshui in Guizhou have poor geographical conditions, high altitude, serious soil erosion, wide karst landforms, severe rocky desertification, harsh forest growth environment, and the forest growth is more restricted by environmental and climate factors. In addition, shrub forest and sparse forest land are widely distributed in the central region, and there is fewer arbor forest land. The quantity and quality of forest resources are limited, so the forest biomass density is low. However, with the implementation of a number of ecological projects, and rocky desertification control project in the central and western regions has achieved remarkable results, the structure of forest and tree species has diversified. The high biomass density areas and high hot spots in the central and western regions have also appeared an upward trend.
Driving factors of biomass change analysis
Generally speaking, the factors affecting the temporal and spatial changes of forest biomass mainly include climate, terrain and human activities. 51 Therefore, this article considers taking altitude, slope, slope position, sunshine, temperature, precipitation, humidity, and light data as driving analysis factors, using geographic detectors to analyze the relationship between eight driving factors and forest biomass.52,53 The statistical software SPSS (Statistical Product and Service Solutions)used to analyze the multicollinearity of the independent variable factors. AS shown in Table 4, he results showed that there was no multicollinearity in the variable factors. After driving factor detection of forest biomass, it showed that the driving strength ranking of these factors on forest biomass was: altitude, temperature, precipitation, humidity, light brightness, sunlight, slope and slope position. Among the terrain factors, altitude had the greatest impact on forest biomass which was −0.446 for non-karst area and −0.405 for karst area. The altitude difference is obvious in Guizhou, low in the east and the south, high in the west and the north. The southeast is dominated by plains and hills, and the northwest is dominated by mountains. Temperature had the greatest impact on forest biomass among climate factors, 0.315 for non-karst area and 0.322 for karst area. In addition, the p value of humidity and slope position was too large, the impact was not significant. The forest biomass in karst areas is more susceptible to climatic factors, while non-karst areas are more susceptible to topographic factors.
Factor detection results.

X 1: Altitude; X2: Slope; X3: Slope position; X4: Sunshine; X5: Temperature; X6: precipitation; X7: Humidity; X8: Light data.
Discussion
The total forest biomass of Guizhou in 1984 was 17.37 × 10⁷ t, which was very close to the statistical results of the forest biomass in Guizhou during the same period. 16 The total forest biomass of Guizhou in 2000 was 30.28 × 10⁷ t, which is also close to the previous research results. 31 Guizhou is located in the mid-subtropical zone with suitable hydrothermal conditions. However, due to the high-altitude topography and serious karst rocky desertification, total biomass in Guizhou is lower than that of the surrounding provinces, Yunnan, Hunan, Guangxi, and Sichuan. 16 From 1984 to 2015, the total forest biomass in Guizhou showed a steady upward trend, and the arbor forest biomass declined in first 6 years and then rose steadily. This is closely related to the national policies, such as the classification of mountains to households, natural forest protection and conversion of cultivated land to forests. Timber forests and shelter forests have shown a clear upward trend and it has also been verified by relevant research. 30
From 1984 to 2015, the difference of forest biomass change between karst and non-karst plots was obvious in Guizhou, and the change in karst regions was greater than that of non-karst regions. Refer to the proportion of forest biomass growth region, the karst area is relatively close with the non-karst area, both exceeding 60%. However, the proportion of forest biomass stable region, the karst area (38.3%) is significantly higher than that of the non-karst area (25.5%). The main reason is that the rocky desertification in the karst area causes the forest growth rate to be slower and the biomass increase is not obvious. The proportion of forest biomass reduction region, the karst area (8.9%) is lower than the non-karst area (14.3%), indicating that with the expansion of plantation forests in recent years, the construction of shelter forest projects, the ecological environment management in karst areas had obvious effects. The regions with significant increase in forest biomass are mainly located in southeast of Guizhou, and the regions with significant decrease are scattered and fragmented. This is related to the complex topography of the study area, the staggering of various land use types and the change of land types.
The gravity center of forest biomass in Guizhou shifted from the southeast to the northwest from 1984 to 2015. Since the forest growth condition in southeastern Guizhou is better and the forest biomass is higher, deforestation in the central and western region was more serious and the forest biomass was lower, the gravity center fell in the Southeastern. Then, with the formulation and implementation of forestry policies, Guiyang, as the capital of Guizhou, took the lead in implementing forestry protection and management projects, which gradually improved the forest ecological environment in the surrounding county-level regions. With the continuous expansion of planted forests, the forest biomass gravity center has gradually shift to Midwest.
Kernel density is an effective method in urban construction and landscape spatial pattern analysis.46,54 But it is rarely used in forest resource analysis, this article proposes improved kernel density method for forest biomass statistics to deeply explore the spatial pattern of forest biomass in Guizhou. Forest biomass hot spots can be accurately located (such as Leishan county, Jiangkou county, Sandu Shuizu county, Liping county, Danzhai) with this method. High-density forest biomass areas are mainly concentrated in the southeast of Guizhou, the north of Zunyi, and the central of Tongren. The level 1 hot spots are mostly located in mid-elevation middle-low undulating mountain ranges, with better climate condition, lower traffic, smaller human influence, such as Qiandongnan; the level 4 hot spots are almost located in karst areas with poor condition and lower forest production. In addition, it shows that the level 1 hot spots of forest biomass along with the Wujiang River Basin, Qingshui River and Duliu River Basin presents a generalized symmetry pattern, indicating that the spatial distribution of forest biomass is likely to be affected by the direction of major rivers. The Wujiang River is located in the upstream of the Yangtze River, across Guizhou in east-west direction. which has formed a symmetrical geomorphic structure and plays a role as “intermediate link” maintaining the ecological environment. Therefore, kernel density with hot spots detection is an effective method to analyze the spatio-temporal changes of forest biomass, which can not only accurately analyze its spatial distribution pattern, but also obtain the dynamic changes of long time series, so as to provide scientific data to support the forest planting planning and management. Furthermore, the forest species, tree species, climate and environmental factors in forest biomass hot spots areas can be analyzed, the optimal model of forest planting and management in karst area of Guizhou can be explored, so the improvement of forest ecological environment in no hot spots areas can be strengthened and the control of rocky desertification will be promoted. The elevation have the greatest influence in the analysis of driving factors based on geographic detectors, which is in line with relevant research results.34,54,55 There is a significant negative correlation between altitude and biomass, because there is more soil and water in the low altitude area, which is more suitable for the growth of forest. In contrast, the high altitude area is vulnerable to soil erosion, which is harmful to the growth of forest. Temperature and precipitation are the other two important factors which positively correlated with biomass. Guizhou is located in the subtropical monsoon region, the higher temperature and the richer precipitation, the more conducive to the growth of forest. Altitude and slope are topographical factors, which affect the spatial distribution of ecological environment factors such as soil nutrients, moisture and sunlight, thus affecting the growth of forest. So the topographical factors have a relatively large impact on forest biomass.
However, due to the lack of data, this article did not analysis the changes of forest biomass in different types of forests. In the future, we will do further research on this topic to find the suitable forest types and tree species to improve the forest quality. Also we plan to analyze the change trend of forest biomass combined with land type data to find the relationship between land type change and forest biomass change. Furthermore, based on the results of kernel density with hot spots detection, we will try to find the optimal pattern of forest planting and management in Guizhou karst regions to support the rocky desertification controls in the future research. Driving factor analysis of forest biomass spatial heterogeneity will be conducted in multi-scale based on moving window method in the future. 56 On driving factors analysis of forest biomass, the annual average value of factors were considered, and the extreme value of factors will be applied in future research to find the influence of extreme climatic conditions on biomass.57–59
Conclusion
In this article, the NFCI data with 5500 fixed sample plots were used to analyze the spatial-temporal changes of biomass in Guizhou for the period 1984–2015. The results showed the unit biomass decreased before 1990 and then increased constantly. The biomass growth of artificial forest was faster than that of the natural forest. The biomass of shelter forest and timber forest showed an significant increase trend, special-purpose forest with a slight increase trend and fuel forest with a slight decrease trend, cash forest with stable trend.
The univariate linear slope and F-test method were introduced in this article to analyze the forest biomass change types. The results showed that the proportion of significant or slight increase of unit biomass in non-karst area was higher than that in karst area from 1984 to 2015, while the proportion of stable constant unit biomass in non-karst area was lower than that in karst area. With the method of the forest biomass gravity center migration, the geographical distribution barycenter of forest biomass in Guizhou shifted from the southeast to the northwest in the period of 1984 to 2015. Improved hot spots detection is an useful method to realize local region biomass accurate positioning and classification, which showed that the low density areas of forest biomass decreased, and the areas with medium and high biomass density showed a trend of expansion year by year; the level 1 hot spots of forest biomass increased constantly, expanded from southeast area to central and western area with a symmetric model by the Wujiang River. Based on the geographic detector method, the change of forest biomass was greatly affected by topography, climate and human activities, and the terrain factors had the greatest impact.
To sum up, it analyzes and reveals the long-term dynamic change pattern of forest biomass in Guizhou in this article, which provides data support for forest planning and management in karst areas of China.
Footnotes
Handling Editor: Professor Lyudmila Mihaylova
Declaration of conflicting interests
The author(s) declared no potential conflicts of interest with respect to the research, authorship, and/or publication of this article.
Funding
The author(s) disclosed receipt of the following financial support for the research, authorship, and/or publication of this article: This study was financially supported by the National Natural Science Foundation of China (no. 31770679), Natural Science Foundation of the Jiangsu Higher Education Institutions of China (no. 18KJB220010), and the Overseas Study Plan of Jiangsu Universities.