
Abstract
To investigate the effects of variable message signs on driving behaviors in urban areas, a logistic model of driving behaviors influenced by variable message signs has been established based on a questionnaire survey. Simultaneously, real-world traffic data were collected by video cameras. Then, T-test was employed to analyze the influence of variable message signs on driving behaviors in urban roads. Results show that age, driving age, familiarity of road network, and the degree of attention to variable message signs were the main factors that affected driving behaviors. Specifically, drivers at the age ranging from 36 to 55 years, and drivers with a driving age ranging from 6 to 10 years prefer to reduce speed to read the information on variable message signs. Those drivers who are not familiar with the road network usually reduced speed to read the information displayed on variable message signs. Drivers who occasionally pay attention to variable message signs prefer to reduce speed to read the information on variable message signs. Both the logistic model and the T-test results indicate that variable message signs have a significant effect on driving behaviors in urban areas. Therefore, variable message signs need to be designed concise and easy to recognize so that they can improve the efficiency of road network.
Keywords
Introduction
Variable message signs (VMS) can relieve traffic congestion to some extent and improve road traffic efficiency by displaying real-time road traffic information and providing alternative routes. Currently, most of VMS researches focus on three aspects: (1) the effects of VMS on drivers’ route choice behavior. (2) The optimization of site planning for VMS. (3) VMS guidance benefits and strategy publication.
In the aspect of the impact of VMS on driver’s route choice behavior, Gan 1 established a Binary Probit model of the probability of driver’s route choice. Shao et al. 2 built a Multi Logit model of driver’s route choice with guidance information according to the analysis of factors that affect driver’s route choice in Beijing. With VMS information guidance, Kattan et al. 3 investigated driving behavior variables by introducing the potential variables in a discrete selection model. Based on the SOAR (State, Operator, and Result) cognitive architecture and multi intelligent device simulation platform, Zhou 4 conducted a computer simulation analysis for driver’s route choice behavior under the dynamic guidance information. Furthermore, the reasonable and efficient guidance information that will be published to the public was determined using simulation analysis. Jindahra and Choocharukul 5 built a mixed Logit model to predict travelers’ short-term route choice behavior. Wang et al. 6 found that the main factors that deeply affect driver’s route choice behavior were driving style, travel time, and VMS credibility. According to the questionnaire investigation and the basic traffic situation in Beijing, Meng et al. 7 showed that VMS could relieve traffic congestion and reduce the traffic demand on road network during peak hours. Dia and Panwai 8 discussed the issues that related to the compliance rate to the displayed information and drivers’ route choice. Erke et al. 9 investigated how VMS affect driver’s route choice, driving speed, and braking behavior.
In terms of the optimization of site planning for VMS, Chiu et al. 10 built a traffic distribution model with an upper layer and a lower layer to maximize the information display benefits and the user dynamic optimization, respectively. Similarly, Chiu and Huynh 11 investigated the issue of VMS site planning when a random accident and ATIS (Automatic Terminal Information Service) coexisted on the road. They found that the effects were much better when VMS and ATIS were installed simultaneously in compared with the condition that they were installed separately. Boyles and Waller 12 conducted an optimized research for VMS site planning on highway using adaptive path-searching method, which was based on VMS induction effect and cost of deployment. Ji and Qin 13 showed that traveler’s random demand and decision maker’s risk preference could significantly affect VMS location scenario, and the Non-dominated Sorting Genetic Algorithms-II could effectively solve the issue of multiobjective optimization for VMS location selecting.
For the research of guidance benefit and strategy publication of VMS, Papageorgiou et al., 14 Mammar et al., 15 and Eunmi 16 conducted a simulation research on guidance information publish system using feedback control algorithm. The result showed that this algorithm could alleviate traffic congestion to some extent. For highway networks, Sina and Hojjat 17 proposed a real-time VMS control method, which was based on the neural network model. Zhong et al. 18 and K Chatterjee et al. 19 studied driver’s compliance rate to the information displayed on VMS. R Tay and A De Barros 20 applied the sample survey method to analyze the influence of security information on speed recommended by VMS on both driving behavior and driving speed, which has shown that the released security information has no obvious effect. M Li et al. 21 established a network equilibrium model related to the travel time displayed on the VMS. Gan and Yang 22 analyzed the influence of information concerning ratio and information comprehension deviation coefficients for drivers on the inductive benefit during VMS operating time.
Based on the review of previous research results, it is found that researchers have made some in-depth investigations and evaluation on the effect of VMS, site planning optimization, and strategy publication. However, most of the research results that mentioned above just considered the influence of a single factor or few factors. Nevertheless, the majority of these researches focused on the impacts of VMS on driving behavior, and their research purposes are usually to improve VMS usage efficiency to reduce deployment costs. In reality, VMS has some influences on driving behavior, which will affect traffic efficiency or safety. Nevertheless, to date, there is very limited research that focuses on the driving behavior. This article studies the decision-making behavior for drivers with different attributes when they are reading VMS information, then investigates whether there is a significant difference in terms of vehicle speed variation under different VMS situations using T-test to verify the model’s analysis results.
Stated preference survey design and data analysis
Determination of methodology
The questionnaire survey method was used to distribute 578 samples, and the survey sites were the major large car repair shops and public parking lots located in Yangzhou city of China. The investigation was carried out in January, March, July, and August in 2016. After the survey, the collected questionnaires were checked to exclude those with missing items. Finally, 402 questionnaires were collected with an effective rate of 70%.
Preliminary statistical analysis of the survey data
Various factors of drivers’ personal attributes, trip attributes, and driver awareness of VMS made an important influence on the driving behavior. There were several classifications for each factor. For example, the factor of “Age” has five classifications, include less than 25 years old, 26–35 years old, 36–45 years old, 46–55 years old, and more than 55 years old. The percentages of each classification were determined based on statistical analysis of the effective samples, as shown in Table 1.
Statistical results of individual characteristic.

VMS: variable message signs.
Modeling driving behavior under the guidance of VMS
During the process of VMS providing real-time traffic information to drivers, its influence on driver’s driving behavior cannot be ignored. When reading VMS, a driver is likely to be distracted from the control of the vehicle. In this section, a logistic model was developed to reveal driving behavior when reading VMS.
Correlation analysis
By χ2 independent test, the correlation between driving behavior and influence factors was analyzed. The results are shown in Table 2. The significance level of each influence factor was lower than 0.05, indicating that there was a correlation between the driving behavior and the influence factors.
Correlation analysis of driving behavior and influence factors.

VMS: variable message signs.
Establishment of logistic model and result analysis
The data were screened and the logistic model was established. The significance of model test of goodness-of-fit was 0.746, which is greater than 0.05, and the fitting effect was good. The results of the regression analysis are shown in Table 3.
Parameter estimation of logistic regression analysis for driving behavior.

VMS: variable message signs.
Based on the logistic regression analysis results, the logistic model was established, as shown in equation (1)

In Table 3, there are several influence factors, and age was found to be the No 2 influence factor. In equation (1), p1 is the probability that the drivers slowed down for reading VMS. xik (i = 2, k = 2, 3, 4, 5; i = 3, k = 1, 2, 3; i = 6, k = 2; i = 7, k = 2, 3) represent each variable for the influence factors. According to the parameter estimation results at 95% confidence level showing in Table 3, the quantitative analysis of driving behavior when driver was reading VMS was conducted, as elaborated below:
Age: The significance of difference between the possibility of drivers at the age ranging from 26 to 35 who slowed down for reading VMS and that of drivers under 25 years is 0.793, and the value is greater than 0.05. The different significance between the possibility of drivers over 55 years who slowed down for reading VMS and that of drivers under 25 years is 0.098, and the value is greater than 0.05. The probability of drivers with age ranging from 36 to 45 who slowed down to read VMS is 3.766 (exp(1.326) = 3.766) times of that of the drivers under 25. The probability of drivers with age ranging from 46 to 55 who slowed down to read VMS is 3.196 (exp(1.162) = 3.196) times of that of the drivers under 25.
Driving age: The different significance between the possibility of drivers with a driving age under 5 years who slowed down for reading VMS and that of drivers with a driving age of more than 15 years is 0.081, and the value is greater than 0.05. The different significance between the possibility of drivers with a driving age ranging from 11 to 15 years who slowed down for reading VMS and that of drivers with a driving age of more than 15 years is 0.215, and the value is greater than 0.05. And the drivers with a driving age ranging from 6 and 10 years is 4.831 (exp(1.575) = 4.831) times of that of the drivers with a driving age of more than 15 years.
Familiarity of road network: The probability of drivers who are not familiar with the road networks slowed down to read VMS is about 7.698 (exp(2.041) = 7.698) times of that of the drivers who are familiar with the road networks.
Degree of attention to VMS: The probability of drivers who occasionally pay attention to VMS slowed down to read VMS is about 2.627 (exp(0.966) = 2.627) times of that of the drivers who frequently pay attention to VMS. The different significance between the possibility of drivers who never pay attention to VMS slowed down to read VMS and that of drivers who frequently pay attention to VMS is 0.328, and the value is greater than 0.05.
Empirical analysis of driving behavior under VMS guidance
Preliminary analysis of speed under VMS guidance
The preliminary results presented in the previous section were based on questionnaire survey to obtain the sample data, and all the data were collected in a stated-preference traffic condition. This section aims to reveal the vehicle speed variation affected by VMS in a real-world traffic condition to further prove the above results.
Data collection
The selection of survey sites followed three principles: (1) there are cameras installed in the sites that can be used for collecting data; (2) the sites should be urban arterials with high traffic volume; (3) there are isolated grasslands on the sides, which can reduce the influence of the non-motor traffic on motor vehicles.
Among the 17 VMS boards operating in Yangzhou city, two VMS boards were selected as the data collection field, as shown in Figures 1 and 2. The messages displayed on the VMS board were the names and saturation degrees of roads, which were highlighted by different colors. Cameras were installed at the upstream of the VMS on the road side for data collection. The survey period at West Wenchang Road (eight motor vehicle lanes for two directions) was 8:00 a.m.–10:00 a.m. from May to June in 2016, and the survey period at North Yangzi River Road (six motor vehicle lanes for two directions) was 8:00 a.m.–10:00 a.m. from March to April in 2016. The data affected by other drivers who changed lanes and lined up were not collected.

Data collection area at the West Wenchang Road.

Data collection area at the North Yangzi River Road.
Lengths of the study sections were 67 m for the West Wenchang Road and 144 m for the North Yangzi River Road, respectively. The data were collected from Monday to Friday, during which some special days such as holidays, inclement weather days, and days with special events were not collected (Figure 3)

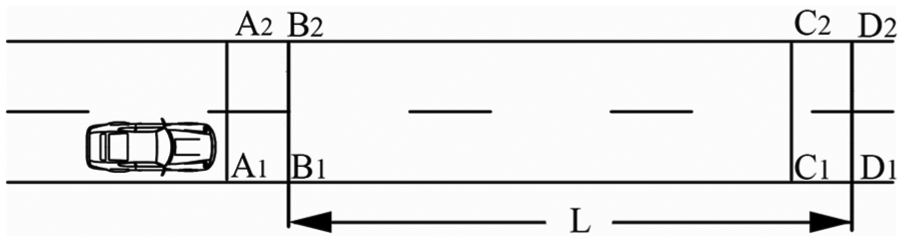
Illustration of speed collection method.
The video was played continuously and paused when a vehicle crossed the A1A2 section; then the video was played by continuously clicking the “frame step” (one frame step is 0.04 s) button, and the number of frames (defined it H1) was documented when the vehicle arrived exactly at the position of B1B2 section. After that, the video was played continuously again and paused when the vehicle crossed the C1C2 section. In the next step, the video was played by continuously clicking the “frame step” button, and the number of frames (defined it H2) was recorded again when the vehicle arrived exactly at the position of D1D2 section. The number of frames for 1 s is 25, which means k = 25 frames/s. Therefore, the average speed of the vehicle between section B1B2 and D1D2 can be calculated. Since traffic congestion and lane-changing behavior could influence normal driving speed, vehicles that were affected by these two factors were not collected, as shown in equation (2).
Preliminary statistical analysis
This research employed the SPSS software for conducting the basic data descriptive statistics. Among the collected data, 5% of the maximum and minimum values were eliminated, as shown in Table 4.
Descriptive statistics of vehicle speed.

VMS: variable message signs.
Under the condition of VMS scenario, the average speeds of the West Wenchang Road and the North Yangzi River Road were lower than those of baseline scenario, indicating that drivers slowed down to read the VMS. The skewness and kurtosis for West Wenchang Road under the condition of baseline scenario were −0.675 and −0.069, respectively. The skewness and kurtosis for West Wenchang Road under VMS scenario were 0.118 and 0.260, respectively. The skewness and kurtosis for North Yangzi River Road under baseline scenario were 0.423 and 1.266, respectively. The skewness and kurtosis for North Yangzi River Road under VMS scenario were 0.518 and 0.468, respectively. From the skewness and kurtosis, the speeds of different VMS states were approximated to normal distribution.
Independent sample T-test of VMS status and speed
Vehicle speed will fluctuate when drivers receive information displayed on different VMS situations. Therefore, the independent sample T-test was adopted to investigate whether there was a significant difference between vehicle speeds under different VMS situations.
The independent sample T-test needs to satisfy three basic assumptions: (1) the variables of observations are independent; (2) the observed variables obey or closely obey the normal distribution; (3) the variance of the observed variables should be the same. The collected data conformed to hypotheses (1) and (2). For hypothesis (3), the homogeneity test of variance was applied, and the test results are shown in Table 5. The P-value for homogeneity test of variance for West Wenchang Road was 0.007, which was lower than 0.05. The result did not conform to hypothesis (3), and it was necessary to conduct a revised test. The P-value for homogeneity test of variance for North Yangzi River Road was 0.069, which was greater than 0.05. The result conformed to hypothesis (3).
Homogeneity test of variance under different VMS states.

VMS: variable message signs.
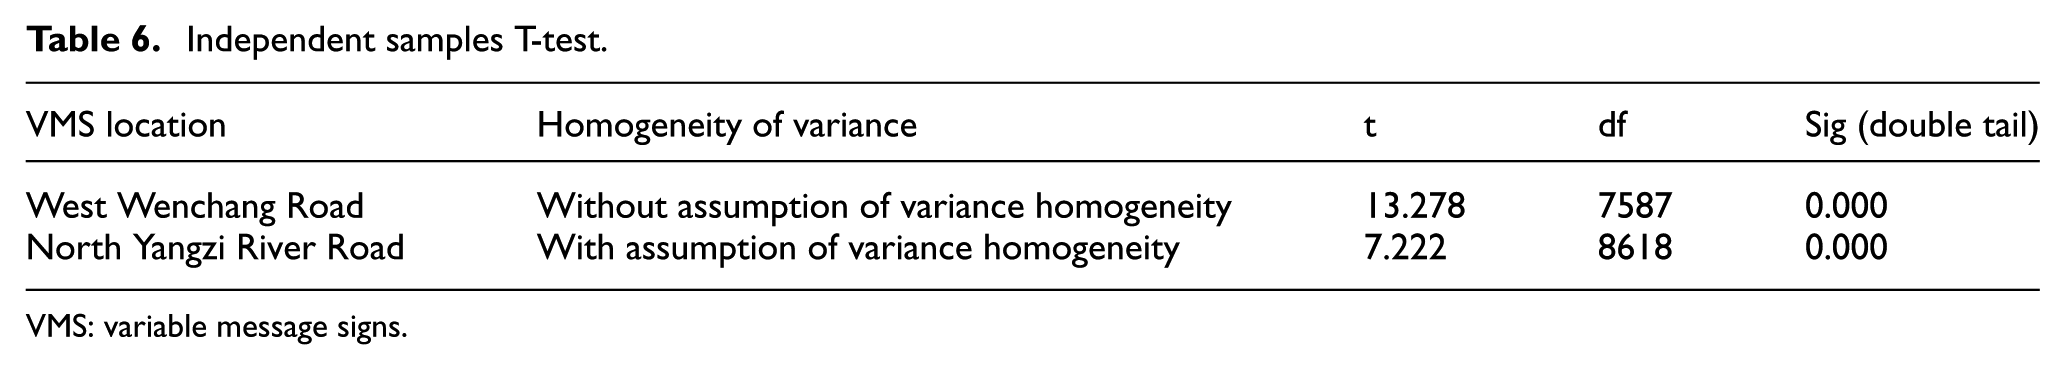
The independent sample T-test was separately conducted for the vehicle speeds of the West Wenchang Road and the North Yangzi River Road under different VMS states, and the null hypothesis H0 was that different VMS states have no significant influence on vehicle speed. Alternative hypothesis H1 was that different VMS states have a significant influence on vehicle speed. The independent sample T-test results are listed in Table 6.
Independent samples T-test.
VMS: variable message signs.
The P-values of the revised independent sample T-test of vehicle speeds at the West Wenchang Road and North Yangzi River Road are both zero, which was lower than 0.05. Therefore, the results of the two tests rejected the null hypothesis H0 and accepted the alternative hypothesis H1. Therefore, the different states of VMS have significant influence on vehicle speed.
Based on the results of T-test, it can be concluded that when the VMS was in operation, driving speed was significantly reduced as a result of reading VMS, which is consistent with the result from the logistic model in section “Establishment of logistic model and result analysis.” It has demonstrated that results of the logistic model are consistent with the field data.
Conclusions and discussions
In this study, driving behaviors under the action of VMS were investigated through logistic model and hypothesis testing, and some preliminary results are concluded, listed as follows:
About the age. Two groups of drivers including 36–45 years old and 46–55 years old prefer to read VMS in a slower driving speed compared with drivers less than 25 years old. The drivers at the age between 46 and 55 have a slight reduction in the probability of slow driving compared with those at the age between 36 and 45. There was no significant difference between 26- and 35-year-old drivers and more than 55-year-old drivers and those under the age of 25. So the middle-aged drivers tended to slow down when they are reading VMS.
About the driving age. There are no significant differences for the drivers with a driving age of less than 5 years and with 11–15 years in comparison with those over 15 years. Drivers with a driving age of between 6 and 10 years were found prefer to reduce driving speed when they were reading VMS compared to those with more than 15 years driving experience.
About the familiarity of road network and the degree of attention to VMS. Compared to drivers who are familiar with the road network, drivers who are not familiar with the road network were usually prone to reduce speed to read VMS information. Drivers who occasionally paid attention to VMS tended to reduce speed.
Independent sample T-test of VMS state and vehicle speed. The results indicate that VMS had a significant impact on vehicle speed and vehicle speed was significantly lower when VMS was activated.
The above conclusions are consistent with the logistic model analysis results of driving behavior under VMS guidance information. To those drivers with certain attributes, the VMS has a significant influence on their driving behavior. They tended to slow down to read VMS messages, which could have some influence on traffic efficiency and safety. Therefore, VMS need to be designed concise and easy to recognize so that it can improve the efficiency of road network. The optimal design of messages, such as size, color, and layout, should be further investigated, which will be discussed in the future research.
Footnotes
Acknowledgements
The authors thank the graduate students Xueqiang Huang and Xiaoliang Gong from Yangzhou University for their help with data collection and extraction.
Handling Editor: Martin Baumann
Declaration of conflicting interests
The author(s) declared no potential conflicts of interest with respect to the research, authorship, and/or publication of this article.
Funding
The author(s) disclosed receipt of the following financial support for the research, authorship, and/or publication of this article: This research was sponsored by the Key Research and Development Program of Yangzhou City (grant no. YZ2018064).