
Abstract
Farming is the major profession in several republics for centuries. However, due to the immigration of individuals from rural to urban, there is prevention in farming. The use of modern technology in the precision agriculture field increases productivity and also improves the exports of a country. The productivity may suffer due to different environmental factors, diseases and insects attacks on the crops, especially tomatoes. The target area (i.e. the affected crops area due to environmental factors) identification and delivery of timely information about diseases in the crops to the ground station are mandatory to make the precautionary measurements. In flying sensor networks, the localization and clustering of multiple unmanned aerial vehicles for target areas identification is a challenging task due to energy constraints, communication range, frequent change in topology, link expiration and high mobility. In this article, we proposed the localization and clustering of multiple unmanned aerial vehicles for the identification of affected target areas in the tomato crop field. The localization of unmanned aerial vehicles depends on the weights of environmental factors, that is, relative humidity, soil moisture, temperature, light intensity, NPK (nitrogen (n), phosphorus (p) and potassium (k)) and power of hydrogen (pH). A honey bee optimization approach is used for the localization and formation of multiple unmanned aerial vehicles’ cluster to accurately identify the target areas. The performance of our bio-inspired approach is compared in terms of communication overhead, packet delivery ratio, mean end-to-end delay and energy consumption with the existing swarm intelligence–based schemes and validated via a simulation. The simulation result shows that the bio-inspired approach performs better among the selected approaches.
Keywords
Introduction
Flying sensor network (FSN) is the emerging area that builds the interconnection of multiple unmanned aerial vehicles (multi-UAVs), actuators, ground sensors and near-field communication (NFC), which bring the revolution to each and everything by making it smart and intelligent. 1 There are numerous applications like remote tracking and sensing, agriculture management, observing borders, traffic monitoring, remote tracking, surveillance, relief-search-destroy operation during the crisis, automated protection of the homeland and so on, but precision agriculture farming system has emerging application among all of them. Precision agricultural farming deals with farming management and monitoring that includes remotely monitoring of tomatoes crop health condition, soil properties, measuring of small-scale soil cultivation, sowing, fertilization, photogrammetry, spraying chemical on crops and water contents mostly required with precise and very high resolution to site-specific management. 2 The application of multi-UAVs in the field of precision agriculture for localization and affected area identification in tomatoes crops has many issues. The researchers have tried to tackle, but no proper application implementation is currently available. The FSN platform in the precision agriculture domain plays a very important role to locate the affected area and observe the crop field with excellent spatial and temporal resolution as compared to the satellite platform. This platform first identifies the target areas (TAs) and then captures the particularities of plants leaves, stems, roots and fruits from an unusual point of view that is not easily visible from the ground. 3 UAVs with non-invasive sensors remotely sense/orthophoto the crops at very small pixel sizes to improve the resolution. The reaction of the plants to new pesticides, herbicides, fungicides and fertilizers can be observed easily. The information obtained by UAVs can help the farmers to decide on the time, utilizing resources efficiently with low cost and saving time due to regular visits of UAVs. 4
The energy-efficient communication among UAVs, UAVs to ground station (GS) and GS to UAVs has several issues due to energy constraints, communication range, frequent change in topology, link expiration and high mobility. The key issue is accurate target identification using UAVs without any localization errors. The researchers proposed several localization schemes to resolve the issue of target spots localization accurately but do not provide precise target spots without localization error.5–7 Most of them consider the distance, localization time and signal strength to measure the localization error. The UAVs routing protocols used to locate the optimal TAs by considering communication range, topology, link expiration time, residual energy and mobility. The localization and identification of TAs is categorized based on the type of nodes. The nodes may be either mobile or static, Global Positioning System (GPS) enabled or without GPS, indoor or outdoor, in range or out of range. The range-based TAs identification scheme provides a more accurate and precise location as compared to range free-based localization, but the schemes may also vary based on error rate, accuracy and computation. 5
The use of a large number of UAVs in FSN divides the network structure into groups called clusters. Each cluster has several UAVs called cluster member (CM). The CM exchange information with its head is called UAVs-CH. The UAVs-CH uses an aggregation approach to obtain information from the member UAVs. Due to clustering, the UAVs inter- and intra-cluster routing information updates locally that shows stability and efficiency at UAVs-CH level. The routing overhead reduced because the member UAVs only communicate with UAVs-CH. In FSN, the cluster formation is a very complex task due to application priorities for UAVs placement, degree of the cluster and CH selection to prolong the FSN lifetime. Besides this, the UAVs-CH has the responsibility that how they communicate inside and outside the cluster. The mobility of UAVs is very high ranging from 10 to 30 m/s. 8 Due to the autonomous system, in most scenario, the TAs identification and path selection is based on the range, speed and direction. In some application, the delay of information is not acceptable such as in precision agriculture, border supervision, search and destroy operations. The reliability of the communication link is required to provide real-time communication because the link may be down, the energy may be low or the interference may occur. To overcome these issues, the designing of cluster-based routing is required that considers these issues to enhance FSN lifetime.
The application of multi-UAVs in FSN matches with the idea of the swarm, which come from nature such as the organization of particles, bees, ants, fireflies, ants and wolf. The concept of clustering based on swarm approaches attracted many researchers from the last one and a half decades. There are several optimization schemes based on the swarm intelligence for TAs identification such as ant colony optimization (ACO), particle swarm optimization (PSO), bee colony optimization (BCO) and genetic algorithm (GA). The cluster-based FSN performance depends on the optimization algorithm for the optimal solution. In this article, bee-swarm intelligence–based TAs identification algorithms are proposed in the field of precision agriculture.
The TAs identification timely in the field of precision agriculture is a very important and hot issue for researchers. In recent years, many research communities contributed to the field of smart agriculture farming but still, this area is in its infancy and there are numerous issues that exist particularly the TA identification, accurate localization of multi-UAVs, reliability and real-time communication of information about the affected TAs.
The main contribution of the proposed scheme is to localize the UAVs and identify the TAs in the tomato crop field based on the optimization of environmental factors. The design and development of the UAVs swarm for TAs identification are based on honey bee optimization. The TAs identification depends on the weights of environmental factors, that is, relative humidity, soil moisture, temperature, light intensity, NPK (nitrogen (n), phosphorus (p), potassium (k)) and power of hydrogen (pH). The environmental factors are modelled to an optimization function in order to obtain optimal TAs. The formation of the cluster is based on the requirements to avoid unnecessary computations. The accurate TAs identification will be enriched with the proposed algorithms as compared to other existing algorithms.
The rest of this article is organized as follows. The existing research work on the precision agriculture field, which is based on multi-UAVs, aided wireless sensor network (WSN), clustering and optimization of multi-UAVs is discussed in section ‘Literature review’. The FSN proposed model and its components are discussed in section ‘FSN model of the proposed system’. The design and implementation of the proposed system for localization and cluster formation of multi-UAVs to identify the TAs are described in section ‘Implementation of proposed scheme’. The experimental setup, performance, simulation results and validation are presented in section ‘Experimentation and analysis’. Section ‘Conclusion and future work’ includes some useful discussion and the conclusion of this work.
Literature review
In this section, first, we added the literature about the existing work in precision agriculture based on environmental factors. In section ‘Multi-UAVs clustering for TAs identification’, we have reviewed the clustering protocols used in UAVs networks. In section ‘Target areas identification by multi-UAVs using optimization schemes’, we have added the UAVs swarm intelligence-based schemes used for localization of UAVs to identify the target area in different scenarios.
Environmental factors in precision agriculture
In precision agriculture, remote sensing techniques widely used to provide the required information timely to the farmers. Due to the increase in the population, crop production also requires the attention to increase for fulfilling today’s requirement. The growth of crop production is based on environmental factors such as humidity, temperature, moisture, light intensity and wind velocity. The monitoring of these factors is possible with the help of environmental sensors that continuously monitor the crop field and provide accurate information. Based on the accurate parameter’s value of soil and air, the farmers take a specific decision about the crop health, diseases and any other requirement for increasing the crop production. Table 1 summarizes the applications of WSN for monitoring environmental factors in precision agriculture.
Summary of wireless sensors to measure environmental factors.
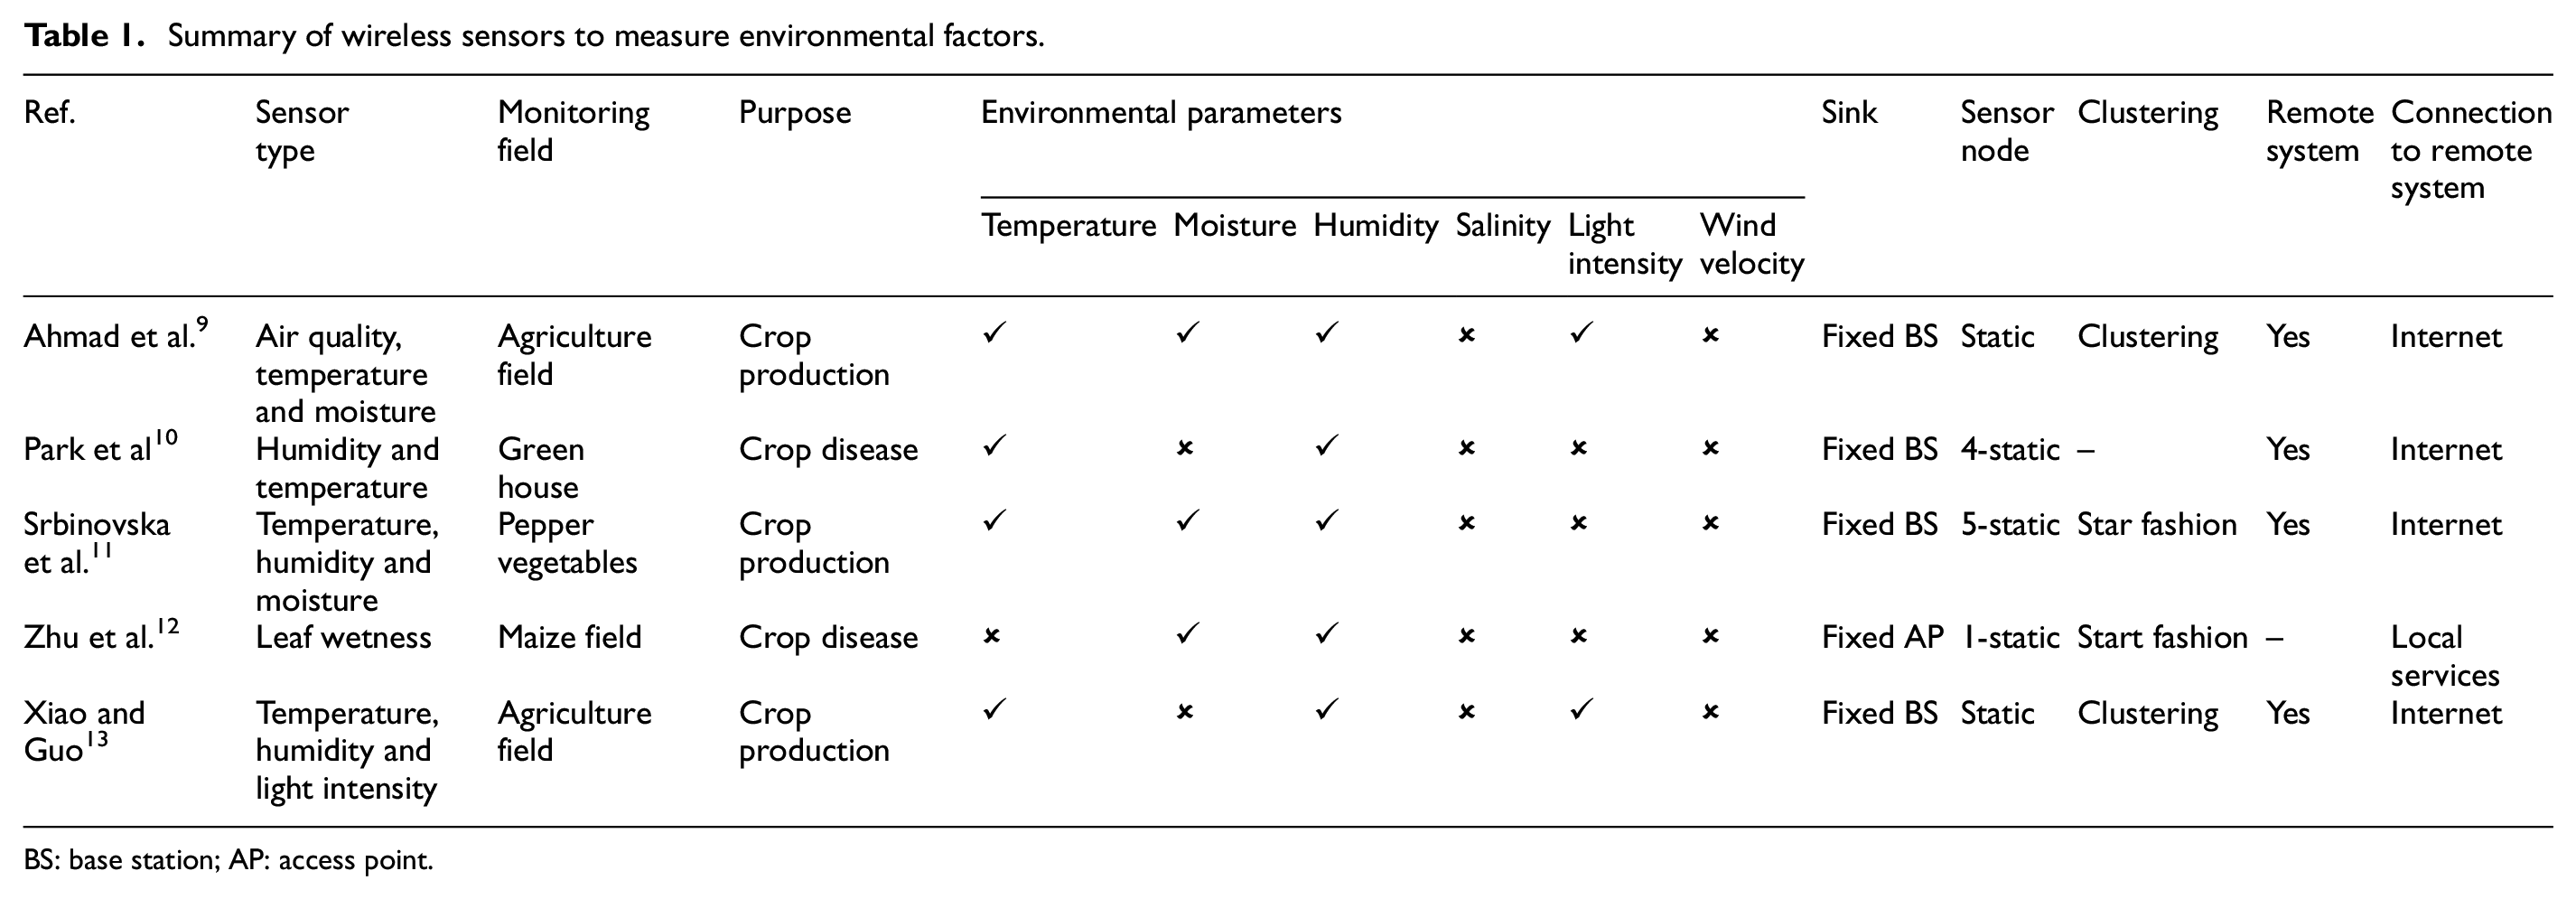
BS: base station; AP: access point.
Ahmad et al. 9 presented the smart monitoring system based on different parameters for sensing the environmental factors. The sensors include air quality, ultraviolet (UV) index, soil moisture, relative humidity and temperature sensors. xBee sensor used for data collection and then forward the information to the fixed BS. Park et al. 10 proposed a system based on wireless sensor technology to collect information about the temperature and humidity of crop leaves. Temperature and humidity sensors deployed to improve the production of greenhouse crops and to prevent the plant leaves from diseases. Srbinovska et al. 11 developed a monitoring and control system for pepper vegetable greenhouse. The environmental parameters like temperature, air humidity and soil acidity measurement and control increase pepper quality production. The temperature, humidity, soil moisture and pH sensors are used to monitor and control the pepper crops. The temperature ranges from 20 to 28 has a positive impact on the production of the pepper crops. The humidity value ranges between 60% and 70% has a positive influence on the crop of peppers. The soil pH value is used to measure the amount of calcium in the soil. The soil moisture and pH value for pepper vegetables range from 5.5 to 6.5 considered best for increasing crop production. Zhu et al. 12 proposed a wireless monitoring system that monitors maize leaf wetness using controller STM32, transmitter nRF905 and application LabVIEW software. The leaf wetness sensor (nRF905) is used to measure the moisture of the leaf, wireless access point controller (STM32) to receive the sensed data from the transmitter and send for further processing through LabVIEW, which show the accurate water mass and wetness on the plant canopy. Xiao and Guo 13 design an agricultural monitoring system based on real-time environmental information such as humidity, temperature and light intensity. The architecture of the system has environmental parameter sensors (temperature, humidity and light intensity), BS, communication system, Internet, and hardware and software system. Multiple sensor nodes for environmental information are placed to monitor the status of temperature, humidity and light intensity.
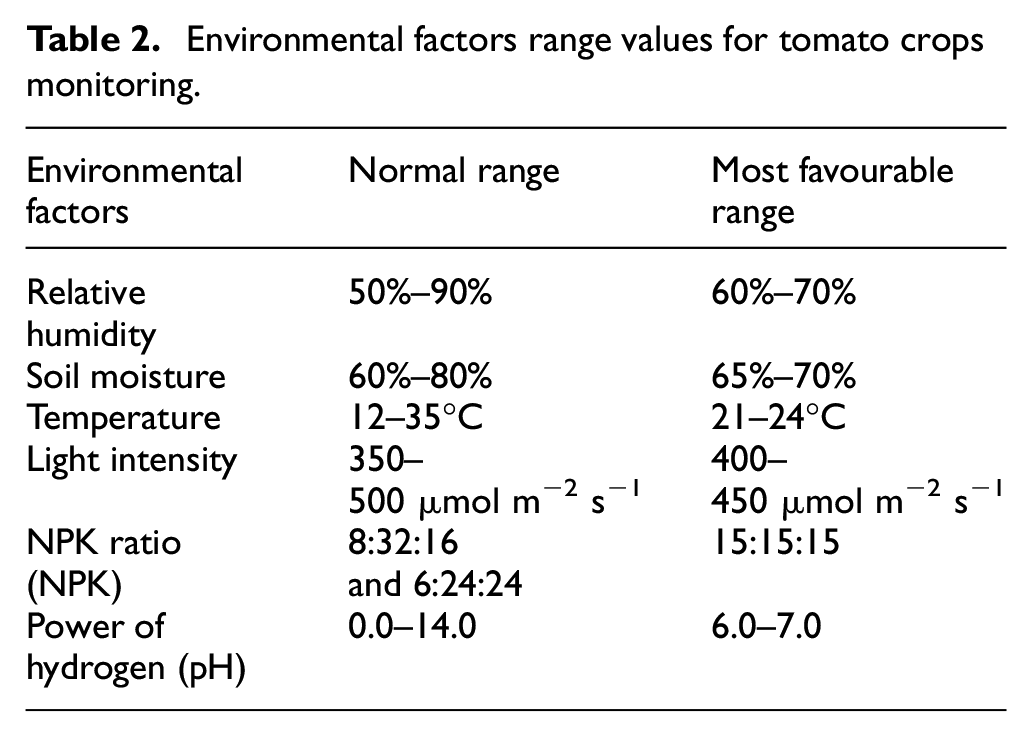
Soil nutrients (NPK) such as potassium (k), phosphorus (p), nitrogen (n) and pH level also play an important role in the increase of crop production. Potassium has a direct impact on the growth, strength, colour and fruit of the crops. Phosphorus deals with protection from diseases and improving fruit development. Nitrogen deals with the growth and colour of leaves. The pH level tries for stability in acidity and alkalinity. Manickam 14 proposed a wireless soil monitoring system based on soil nutrient (NPK), temperature, humidity, soil moisture and pH value sensors. The proposed system monitors the soil nutrients and other environmental factors for tomato plantation. The ideal situation for tomato crops plantation requires temperature level on daytime (65 to 85 °F), humidity level (80-90%), and light intensity (350-500 μmol m−2 s−1). The sensors connected with Raspberry Pi for sending the information to the cloud, which is then shared with the farmer through a mobile phone. Bah et al. 15 proposed the management and monitoring system for precision agriculture based on soil nutrient sensor technology. The authors present the importance and use of various sensors for soil nutrients. These sensors include electrochemical, optical, radiometric, acoustic, mechanical and wireless sensors. The soil physical and mechanical attributes are classified with the help of acoustic sensors. Kim et al. 16 proposed a detecting system for precision agriculture using soil macronutrient sensors. The macronutrient sensors measure the NPK level. The system efficiently describes the variation in the soil supplements in the field.
The ideal measurement of environmental factors varies due to change in the climate of different areas. The normal and favourable ranges are summarized in Table 214–16 from the above literature.
Environmental factors range values for tomato crops monitoring.
Multi-UAVs clustering for TAs identification
The researchers proposed clustering schemes for multi-UAVs network based on dynamic features, weights and fuzzy logic. These schemes have different characteristics and limitations such as the balanced or unbalanced clusters, direct or indirect communication, the nodes may die, the link may down, interference may occur and the cluster may be formed with residual energy while ignoring other constraints.
Aadil et al. 17 addressed these issues and proposed the clustering model with an energy-aware link called EALC. EALC is based on multiple weights to manage energy and transmission terrain to select the best CH that provide stability and increasing the lifetime of the network. The optimization process reduces the routing calculation, energy utilization and monitoring range of communication to perform clustering efficiently. The mobility of nodes considered moderate, but the mobility of UAVs is very high and dynamic in nature. The simulation result shows better performance in terms of energy, cluster building time and cluster lifetime while ignoring end-to-end delay, throughput and delivery ratio, and routing overhead. The Quality of Service (QoS) that needs more attention is not considered in the EALC model. Arafat and Moh 18 proposed a swarm intelligence clustering (SIC) approach, in which the distance between inter- and intra-cluster is based on a particle fitness function. The three-dimensional (3D) node-pairing model is used to discover the closest cluster pair with the help of PSO local sub-swarm. The nodes, which are in the range of cluster, assigned to that cluster to reduce energy consumption. The Euclidean distance formula found best to locate the desirable place for the UAVs and balanced cluster size. The cluster formation and CH selection performed with a fitness function that considers remaining energy and distance. UAVs are grouped into clusters each with CH. The performance of clustering algorithm SIC compared with the existing state-of-art clustering algorithm shows better performance in terms of overhead and delivery ratio. Brust and Strimbu 19 proposed the solution for the flight formation problem using UAVs swarm. In this approach, a leader election algorithm is used to select one UAV as ahead with high energy and communication capabilities. The re-selection of a leader is based on the weights. The weights are assigned to each UAV in the initial stage and change according to the condition in the algorithm. The head will responsible for the collection of information from the swarm of UAVs, route planning to avoid obstacles and transmission of information to the BS locally. Zafar and Khan 20 proposed multi-cluster flying ad hoc networks (FANETs) for remotely detecting, sensing, monitoring and controlling wildfire. In the mission area, a swarm of UAVs is deployed in a group form to form multiple clusters. The cluster formation takes place adaptively by sharing information to its neighbour UAVs and the reference group mobility (RGM) model used for movement purposes. Each cluster has a CH and a fixed number of UAVs. Each UAV has information about its neighbour, location, zone and speed. The CH uses a pre-assigned path and the RGM model to exchange control packets in the radio range of each cluster. The CH uses metric based on threshold value to monitor the link quality. Khan et al. 21 proposed a self-organizing clustering scheme (SOCS) based on the Glowworm swarm optimization (GSO) to enhance the UAVs communication. The best route selection and the management of topological changes performed based on GSO properties. The formation of cluster and CH election based on residual energy, luciferin value and ground segment connection of UAVs. Luciferin of a Glowworm value is used as an objective function and its position. The CH is selected with a high fitness value and the remaining UAVs become CMs. The routes selection between UAVs is based on distance to neighbour, residual energy and position of UAVs. The distance among UAVs considered only 5 m and distance among UAVs and CH considered fixed. Khan et al. 22 developed a bio-inspired clustering scheme for FANET called BICSF. The formation of cluster is based on the luciferin value and residual energy of UAVs. The UAVs with high energy, relative mobility and luciferin value were selected as a CH and the remaining UAVs become CMs. During the mission, the Krill Herd technique is used to maintain and manage the cluster and its member. Path Detection Function (PDF) is used to select optimal routes. The UAVs mobility and climate changes are considered to provide efficiency, but the flight time and speed of UAVs are not mentioned.
Target areas identification by multi-UAVs using optimization schemes
The localization and accurate TAs identification using multi-UAVs is a challenging task. The researcher tried to locate the accurate TAs in the transmission range with and without any prior position information. The affected areas information can be obtained from the anchor node or using any range estimation. Table 3 summarizes existing work on the localization of multi-UAVs for target spot identification using swarm optimization.
Summary of the existing work on localization of UAVs for TAs identification.

UAV: unmanned aerial vehicle; SIL-PSO: swarm intelligence–based localization particle swarm optimization; HPSO: hybrid particle swarm optimization; ACO: ant colony optimization; GA: genetic algorithm; FA: flip ambiguity; NA: not available; BBO: biogeography-based optimization; IGA: immune genetic algorithm; RFHPSO: range free hybrid particle swarm optimization; L-GA: localization based on genetic algorithm; IPSO: improved particle swarm optimization..
Arafat and Sangman 18 proposed a swarm intelligence–based localization (SIL) algorithm for an emergency mission that reduces computation power and defines the search space with a boundary box. The UAVs are placed randomly in the 3D search space. SIL uses a grouping scheme to calculate the distance of the target UAVs and an estimation model to measure the distance of UAVs from CH. To find the optimum path, the model used the PSO algorithm. Due to the scalability in the SIL, the degree of localized target UAVs enhanced with the increase in target UAVs. Furthermore, the number of iterations reduced to decrease the average localization time per node. Ma’Sum et al. 23 developed algorithms to detect, track and localize the object using UAVs with a modified PSO approach for military purposes. The object detection performed based on its colour and is well known as Blob. Proportional–integral–differential (PID) control is used as a tracking algorithm that calculates the error of object position, updates its current position and previous data position. The experiment conducted on three UAVs to find a target in a real indoor scenario with the static and mobile target. The simulation result shows that the modified PSO is better for detecting, tracking and localization of a target in the small-scale scenario. Cheng et al. 24 proposed the improved PSO algorithm for path planning of a single UAV. Real-time path planning strategy used in case if the UAV face obstacle during flight. In path planning steps, forecasting performs for tracking the obstacles using the Kalman filtering and then applies the improved PSO and chain structure for target search. To improve the search ability, first, an adaptive approach is used that dynamically adjusts the global best, local best and inertia parameters of PSO. Second, a search mechanism based on chaos optimization is used to improve the ability to escape from local maxima. Sánchez-García et al. 25 proposed a distributed and dynamic PSO-based algorithm (dPSO-U) for UAVs network to explore the disaster scenario for finding victims using a team of UAVs. In this algorithm different set of values used for neighbour best, local best and inertia parameters for better performance. The dPSO is used to generate trajectories without prior knowledge about the target, but the UAVs know the boundaries coordinates. Li and Wen 26 proposed an improved PSO algorithm for the precise and fast localization of randomly placed nodes. The bounding box method is used to reduce the initial search space. To prevent the occurrence of the flip ambiguity (FA) problem of nodes, the nearly collinear references used anticipation. The nodes still in FA issue are re-localized in the refinement phase. The sensor nodes with two or three near collinear references are localized in this research. Kumar et al. 27 presented the application of hybrid particle swarm optimization (HPSO) and biogeography-based optimization (BBO) to localize nodes in a 3D range free environment. The target nodes placed in the middle of randomly deployed anchor nodes in the anisotropic environment. The computation for localization of target node is performed with distance and received signal strength (RSS), weights of target and anchor nodes. The computational complexity is reduced with the help of modelling the edge weights using a fuzzy logic system. The HPSO and BBO are used for the optimization of edge weights to reduce the location error. The proposed approach is compared with centroid and weighted centroid method and shows better result in terms of error and scalability.
Cheng et al. 28 proposed immune genetic algorithm (IGA) for UAV path planning. The UAV avoids all the threats and tries to follow the shortest path during the flight to reach the destination. The fitness function is based on the threat cost (to safely avoid all threats for the UAV during flight) and path cost (to follow the shortest path to the destination). Faelden et al. 29 present position localization of UAV with the use of genetic algorithm (L-GA) and transceivers signals. In GA, the received signal amount, population size and location of the transceiver are used as inputs to locate the UAV in the xyz-axis. The L-GA fitness function first calculates the distance of each transceiver, second compute the received signal level, and finally compare the distances with revived signal levels. The proposed blind localization method requires a number of iteration and huge computation to locate the UAV. Liu and Chen 30 developed improved K-means based on firefly algorithm to find accurate target location in a network. First, it measures the distance among the nodes and target RSS identifier. Second, it establishes the improved fitness function with the help of weighted K-means method. Finally, the firefly algorithm introduced the solution of the optimization problem and identification of the correct target location. The proposed algorithm decreases the difference in distance and enhances the estimated precision using a fitness function. Stability, convergence and localization accuracy of the developed algorithm is better than the existing ones.
FSN model of the proposed system
The research on localization and cluster formation of multi-UAVs to identify the TAs in the field of precision agriculture is still confined to a lab, and no specific application implementation is currently available. However, in this section, we describe the FSN model and workflow for multi-UAVs localization based on the environmental factors of TAs as shown in Figures 1 and 2. The proposed system is designed to provide information about the affected areas in the tomato crops field. The numbers of ground sensor nodes are randomly placed in the field to measure the environmental factors. The field is divided into zones. Each zone has a CH. The selection of CH will be in a distributed fashion. The role of CH will be rotated among all sensors. The data aggregation approach is used to collect environmental factors information from the sensor nodes. The multi-UAVs are configured to identify the affected TAs. The localization of multi-UAVs depends on the weights of environmental factors of the TAs. The UAVs will randomly search the affected TAs using the honey bee optimization approach. The honey bee clustering algorithm is applied for the optimal UAVs-CHs as in research. 31 In Figure 2, the images with L-tag represent the location of the affected crops area images. The UAVs-CHs communicate the information to the GS for further processing.

Proposed scheme for localization of multi-UAVs based on the weights of environmental factors.

Proposed scheme implementation workflow.
The UAV is an unmanned aircraft system that remotely or autonomously flies with a controller. The role of UAVs has changed into the ‘Go-To’ platform for many remote sensing applications. Due to the wide varieties of UAVs in the market, in our proposed architecture, the rotary-wing UAVs are used, which have the capabilities of flying remotely with thermal and hyperspectral sensing, detecting, storing and communicating information in the precision agriculture domain. The rotary-wing UAVs operate at 3–45 m heights and cover the area up to several kilometres (km). The GPS is embedded in the UAVs which enables clear hyperspectral data acquisition. GPS is used to locate the coordinates of UAVs. Flight planning of hyperspectral sensor UAVs remotely is very complex. The application program Polygon Tool is used for flight planning with precise and accurate GPS points within which the UAVs will operate. The UAVs use pre-planned path strategies to cover the specific crop field without interfering with obstacles. The multi-UAVs avoid collisions based on localization accuracy and identified TAs.
Implementation of proposed scheme
Honey bee approach–based TA identification
The honey bees live in a colony (ranges up to 50k), with a queen, female workers (ranges from 20k to 40k) and male drones (ranges from 200 to 300). The algorithm based on a honey bee is used to identify the targets with an ideal solution by sharing the information and mutual cooperation among the bees of a colony. In the algorithm for feasible solution representation, the bees are classified into groups, that is, onlooker and employed. The onlooker bees randomly search for locating food sources and share the information with employed bees. The employed bees visit for getting the nectar amount. They collect nectar and share information with other bees. The selection of food source depends on the type of dance, that is why the onlooker bees wait for the type of employed bees dance. The employed bees start a waggle dance that shows the track, distance to the food source and nectar amount. In the proposed approach, the localization and cluster formation of multi-UAVs is based on the honey foraging behaviour for identification of TAs. The nectar amount of TAs is based on environmental factors.
Localization of multi-UAVs based on the identified TAs
In this work, the bee colony, that is, the multi-UAVs network is divided into two sets of UAVs. The first 90% are employed UAVs while the remaining 10% are labelled as onlooker UAVs. The grouping of UAVs in a network is performed with a clustering algorithm based on the honey bee as in research. 31 The flow chart in Figure 3 shows the process of optimal TAs identification based on the honey bee algorithm.

Flow chart of honey bee algorithm–based target area identification.
The algorithm starts with initiating investigational trail points, that is, initial TAs in the search space, that is, multi-UAVs network from where the foraging of honey bees starts. The working procedure of the setup phase is explained in Algorithm 1. The notations used in algorithms and flow chart are described in Table 4.
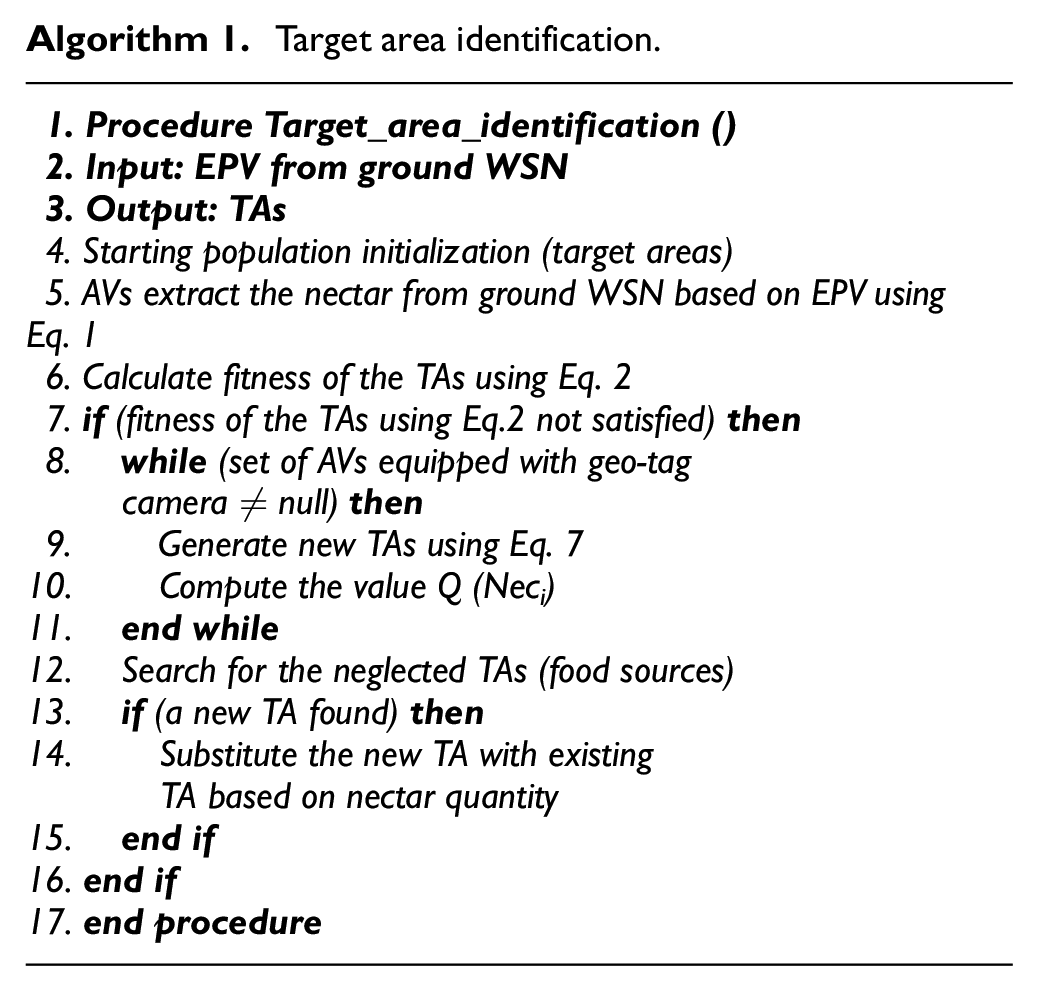
List of notations used in algorithms.

The time complexity of Algorithm 1 is calculated as a Big O (m*n), where m is the number of iterations the algorithm will be executed and n is the number of UAVs.
The parameters that are ideal for the measurement of environmental factors varied due to climate change. The parameters such as relative humidity, moisture, temperature, light intensity, NPK and power of hydrogen level are considered to measure the nectar amount in a UAV
Humidity level:
In this parameter, the relative soil humidity level is to be set as favourable
Moisture level:
The moisture level is said to be normal
Temperature value:
The soil and air temperature measured from the sensor deployed are categorized as favourable
Light intensity:
The light intensity measured from the sensor deployed are categorized as normal
NPK:
The NPK ratio measured from the sensors deployed in the tomato field categorized as normal and favourable
Power of hydrogen:
The soil
The TAs in the tomato crop field is optimized in a way that the Euclidian distance should be approximately equal from one problem area to another

The following equations are used to express the problem by measuring and considering the grouping of


In equation (2), the degree of the sensor nodes represented with n in the UAVs enabled WSN.
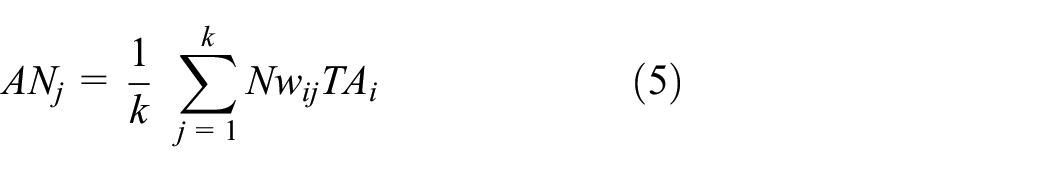
In equation (2), the degree of sensor nodes in the
After the completion of this practice, to generate a new population of the TAs, the process of search repeated with onlooker and employed UAVs. The stored TAs in the memory of employed UAVs are updated depends on the information. Equation (6) (used to compute the amount of nectar) is used to obtain the result of the tests for the new TAs. In the results, if the new TAs nectar amount is more than the existing stored nectar amount of TAs, then the UAV updates the new quantity of nectar and discards the old one. If not, then there is no change occurs in the location of TAs. The employed UAVs come back to the ground station after completion of the process of exploration, then they start to dance on the dancing floor and communicate the different TAs nectar amount, track, distance and direction with other UAVs in the form of a beacon. The onlooker UAVs wait and observe the type of beacon and analyse the quantity of nectar of the next TAs. The selection of the next TAs depends on the probability of nectar quantity denoted with

In equation (6), is the total TAs,

The region size
The employed UAVs visit the new candidate position and measure the nectar amount. Based on the fitness of a candidate position, it stores the new location and discards the already stored previous position. If the value of the nectar amount is higher than the old one, then the new candidate position will be qualitative.
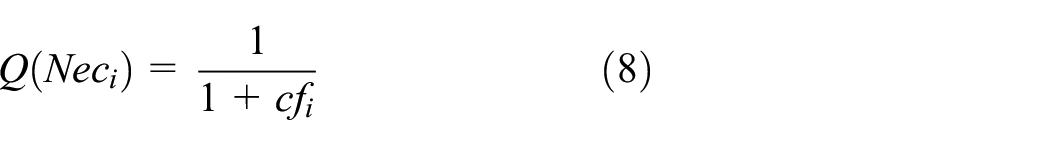
Equation 8 is used to find the probable problem area (i.e. position of the nectar location and its fitness) that shows its associated quality to the conceivable results.
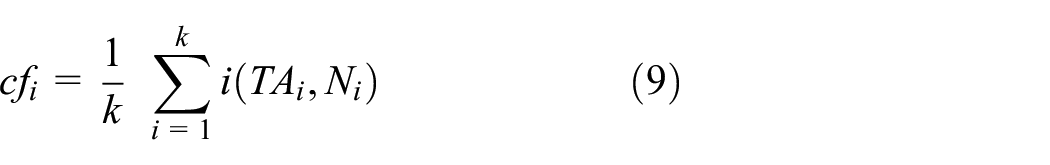
Equation (9) represents the maximization cost function as
After locating the candidate target locations
The honey bee exploitation and exploration search process can be achieved together. In this article, the onlooker and employed UAVs together achieved the exploitation process of the search space and the onlooker UAVs also performed the task of exploration. The greedy selection approach is adopted in which the onlooker and employed UAVs performance are better for local neighbourhood search and global search. The onlooker UAVs also performs the task of random search in the search space. The TAs, in this approach, are based on the greater quantity of nectar.
Cluster formation
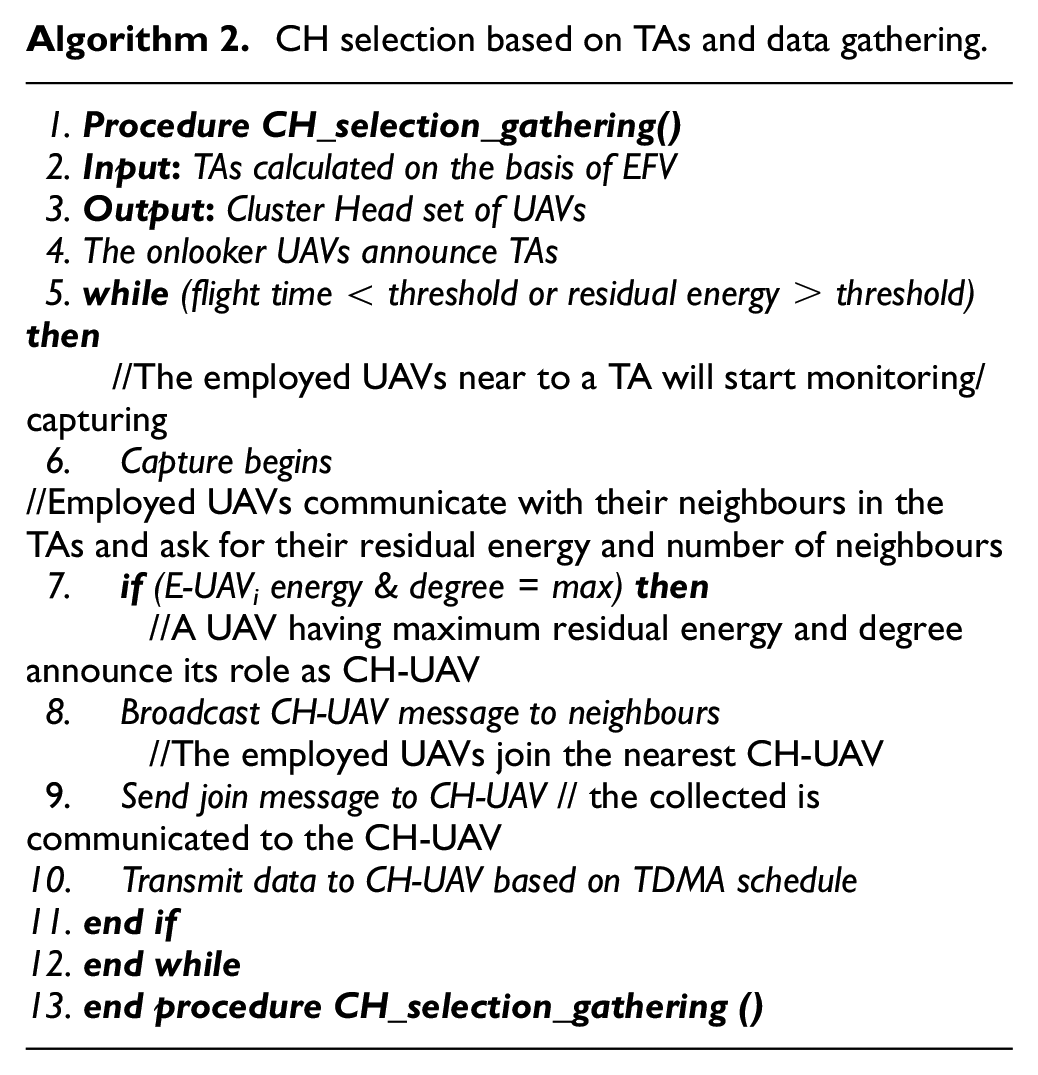
The UAVs visiting the field will communicate with cluster head nodes on the ground segment of the network. Once a UAV/onlooker bee identifies a target area based on the environmental factors communicated via the ground segment, the next step is to form a cluster. The onlooker bee broadcast a message to the employed bees in the neighbourhood about a target area. The employed bees sent their residual energy information to the onlooker bee. The onlooker bee calculates the CH node based on energy and degree. The information is communicated to all the employed bees in the vicinity. The CH nodes broadcast a message to all nearby nodes and ask them to join. In this way, the CHs are formed. Once the CHs are formed, the data collection process begins. All the employed bees collect and communicate data to the CHs. Once the data collection is complete, the search for a new target area is initiated. The process of the CH selection, cluster formation and data collection is depicted in Algorithm 2.
Experimentation and analysis
Simulation setup
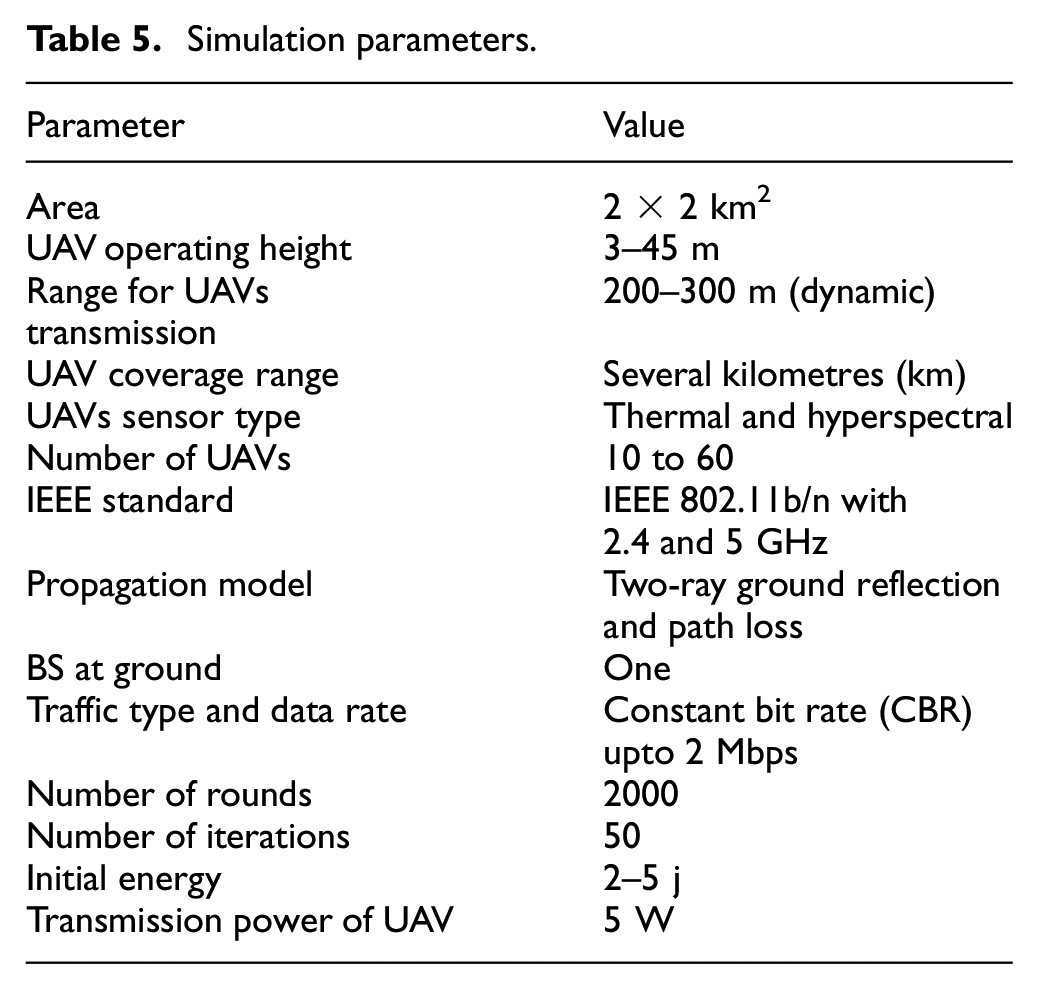
The simulation area for the proposed system is selected 2 × 2 km2, where UAVs (10–60) are distributed randomly. These UAVs are equipped with high residual energy and the speed limit ranges from 5 to 20 m/s. IEEE 802.11b/n standards are selected for inter- and intra-cluster communication. To avoid interference among UAVs, we select the IEEE 802.11b with 2.4 GHz and 802.11n with 5-GHz frequency bands. The rest of the parameters detail is summarized in Table 5.
Simulation parameters.
Performance evaluation and simulation results
The performance of the proposed scheme, that is, Bio-Inspired Cluster-based optimal Target IDentification (BICTID) is evaluated and compared with the state-of-art schemes, that is, particles swarm intelligence-based localization (SIL-PSO), localization based on genetic algorithm (Loc-GA) and K-means–based localization (Loc-KMeans) for localization of UAVs on TAs. The TAs identification is based on the optimization metrics, that is, relative humidity, moisture level, temperature value, light intensity, NPK and power of hydrogen level. The localization of UAVs in BICTID is based on honey bee optimization. The UAVs localization accuracy, error rate and the cost of convergence are considered as performance metrics. Figures 4 and 5 represent the placement of nodes in the UAVs network. The employed unmanned aerial vehicles (E-UAVs) are represented with ‘✗’ and onlooker unmanned aerial vehicles (O-UAVs) are represented with ‘O’.
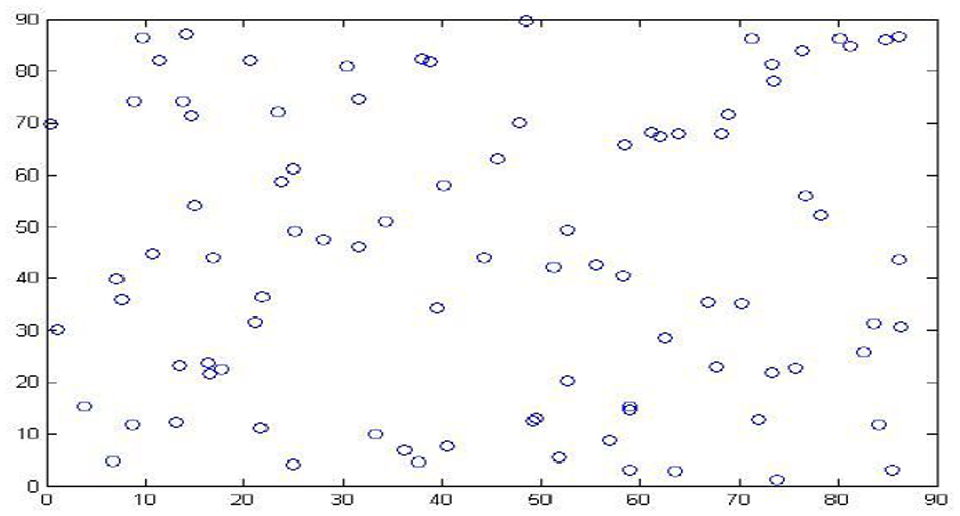
Random deployment of UAVs.

Initial E-UAVs and O-UAVs deployment.
The minimum, maximum and mean of localization error is shown in Table 6. When the ratio of E-UAVs over O-UAVs (EOR) is 10 (i.e. EOR = 10) and the size of network is 40. The proposed BICTID shows efficient results as compared to the existing algorithms. The BICTID shows better results and increased the E-UAVs while increasing the number of O-UAVs, which means that the localization of O-UAV is efficiently performed. The error rate with required iteration and time of proposed BICTID is minimum as compared to the existing algorithms. The use of honey bee approach reduces the search space, that is why the computation time and the number of iterations automatically decrease. The localization success rate is higher of the proposed algorithm BICTID among all other algorithms. The minimum, maximum and mean cost of each bee shows that our proposed BICTID is efficient as compared to the existing schemes.
Summary of localization error in target identification (EOR = 10 and total UAVs = 40).

UAV: unmanned aerial vehicle; BICTID: Bio-Inspired Cluster-based optimal Target IDentification; SIL-PSO: swarm intelligence–based localization particle swarm optimization; Loc-GA: localization based on genetic algorithm; Loc-KMeans: K-means–based localization.
The minimum, maximum and mean of localization error is shown in Table 7. When the ratio of E-UAVs over O-UAVs (EOR) is 10 (i.e. EOR = 10) and the size of network is 60.
Summary of localization error in target identification (EOR = 10 and total UAVs = 60).

UAV: unmanned aerial vehicle; BICTID: Bio-Inspired Cluster-based optimal Target IDentification; SIL-PSO: swarm intelligence–based localization particle swarm optimization; Loc-GA: localization based on genetic algorithm; Loc-KMeans: K-means–based localization.
The proposed algorithm also shows efficient results as compared to the existing algorithms. With the increase in UAVs, the localization of UAV is also increased. The error rate with required iteration and time decreased in our proposed algorithm as compared to the existing algorithms. The computation time and the number of iterations automatically decreased using neighbour search criteria in the defined search space. The localization success rate is higher of the BICTID among all other algorithms. The minimum, maximum and mean cost of each bee with the increase in UAVs shows that BICTID is more efficient as compared to the existing schemes. The number of localization errors increases without honey bee algorithm (neighbour search method) as shown in Figure 6. The localization error in distance represented with a line, that is, O-UAV actual position to E-UAV position. The number of localization errors decreased with the use of honey bee algorithm as shown in Figure 6. The O-UAVs communicate with E-UAVs. Figure 7 shows the connectivity of O-UAVs to E-UAVs using neighbour search criteria.

Localization error without neighbour search method.

Localization and connectivity of O-UAVs with E-UAVs.
The performance of the BICTID clustering is also evaluated and compared with SIC, EALC, BICSF and SOCS. In this work for optimal TAs identification, we consider the optimization metrics, that is, relative humidity, moisture level, temperature value, light intensity, NPK and power of hydrogen level. The performance metrics of the BICTID evaluated on the basis of communication overhead, packet delivery ratio (PDR), mean end-to-end delay and energy consumption. The communication overhead between source and destination is the redundant data for the transmission of payload. PDR is the ratio of successfully received data to the destination that was sent. The mean end-to-end delay is the time taken for the transmission of data from source to destination. Energy consumption is the utilization of energy on sending, receiving and processing of data by source or destination.
The simulation result shown in Figure 8 provides a comparison of UAVs degree versus PDR in the multi-UAVs network for the BICTID, SIC, EALC, BICSF and SOCS. The BICTID in Figure 8 presents its effectiveness in delivering above 95% of data. The BICTID demonstrates the best performance as compared to the selected clustering protocols while increasing the number of UAVs. The speed of UAVs varies from 5 to 20 m/s. The delay may occur due to the high mobility of UAVs to find the TAs. The optimum TAs identification is performed based on the bees concept which forms the clusters for reliable communication among UAVs.

UAVs degree versus PDR.
Figure 9 shows UAVs degree and mean end-to-end delay of BICTID and other selected protocols. Due to the reliable communication among UAVs, the mean end-to-end delay of the proposed BICTID is considerably less as compared to SIC, EALC, BICSF and SOCS.

UAVs degree versus mean end-to-end delay.
The increase in UAVs also increases the communication overhead. The bio-inspired clustering approach forms a balanced cluster that reduces the communication overhead as shown in Figure 10. In the simulation results, the increase in the UAVs degree shows that the proposed BICTID has less communication overhead among all other schemes.

UAVs degree versus communication overhead.
The time for the formation of the cluster is called cluster lifetime. Once the clusters are formed, then the CH is selected which has the responsibility to manage its member UAVs. With the passage of time, the CH fitness value reduces because of different constraints. Due to the mobility and change in topology frequently, the re-clustering is performed to select the next UAV for the role of CH. The proposed BICTID minimizes the re-clustering to prolong the cluster lifetime. The simulation results in Figure 11 present that with the increase in UAVs degree, the mean cluster lifetime decreases. The BICTID, SIC and SOCS cluster lifetime is much better than the EALC and BICSF as shown in Figure 11.

UAVs degree versus mean cluster lifetime.
The UAVs continuously monitor the field to identify the TAs. During the visit at each round, the UAVs energy reduces while some of the UAVs may die due to more energy consumption or drainage. Figure 12 presents the number of active nodes at each round. The proposed BICTID shows better energy utilization to prolong the lifetime and minimize the ratio of die UAVs as compared to SIC, EALC, BICSF and SOCS.
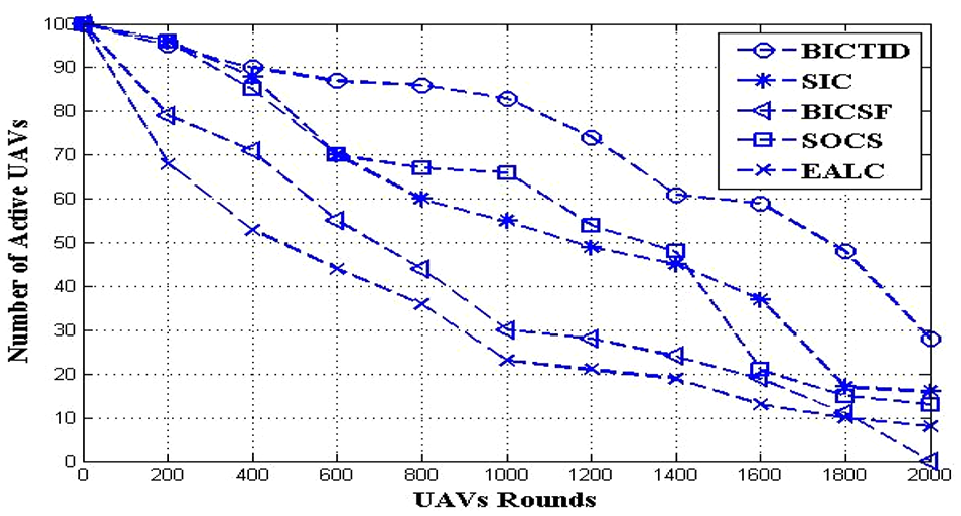
Number of active nodes versus number of rounds.
Due to energy constraint, the proposed BICTID forms balance clusters with optimum CHs, and minimizes re-clustering that reduces the energy utilization. Figure 13 presents the total number of UAVs and energy consumption of all the selected protocols. The SIC, BICSF and EALC consume more energy when increasing the number of UAVs as compared to BICTID and SOCS.

Total number of UAVs versus energy consumption.
Figure 14 presents the total energy consumption and the number of rounds of the BICTID, SIC, EALC, BICSF and SOCS. The energy utilization of BICTID is better among all other selected schemes. Figure 14 shows that with the increase in the number of rounds, the total energy consumption also increases but the BICTID, SIC and SOCS show more stability in terms of energy utilization as compared to EALC and BICSF.

Total energy consumption versus number of rounds.
Conclusion and future work
The FSN platform in the precision agriculture domain plays a very important role to locate the affected area and observe the crop field with excellent spatial and temporal resolution. The localization and clustering of multi-UAVs for TAs identification is a challenging task. In this article, we proposed the BICTID scheme for FSN to accurately identify the TAs in the field of precision agriculture. The proposed BICTID first identify the affected TAs in the tomato crop field. The TAs identification is performed on the basis of environmental factors weights, that is, relative humidity, soil moisture, temperature, light intensity, NPK (nitrogen (n), phosphorus (p) and potassium (k)) and power of hydrogen (pH). The honey bee optimization approach is applied that shows the better performance as compared to other swarm intelligence approaches. In the BICTID scheme, the localization and clustering of multi-UAVs for TAs identification is achieved with very high accuracy as compared to the existing selected schemes. The performance of the BICTID clustering significantly improved in terms of PDR, communication overhead, mean end-to-end delay and energy consumption. The simulation results show that the BICTID prolongs the network lifetime with efficient utilization of energy. As a result, it can be easily concluded that the BICTID will not only increase the productivity of tomato but also reduce the wastage due to diseases and making it cost-effective.
Footnotes
Handling Editor: Lyudmila Mihaylova
Declaration of conflicting interests
The author(s) declared no potential conflicts of interest with respect to the research, authorship, and/or publication of this article.
Funding
The author(s) received no financial support for the research, authorship, and/or publication of this article.