
Abstract
The disorderly growth of urban centers can lead to serious socioeconomic disadvantages, such as health problems, due to long-term exposure to toxic gases and also monetary losses due to time stopped in congestion. Thus, there is a need for systems that help in the management and control of the flow of vehicles on the roads, seeking to reduce the damage resulting from a faulty transportation system and also avoiding the use of an inefficient system of information dissemination of urban roads. In this scenario, innovative systems are being developed to analyze the conjunction of road conditions to supervise and provide routes as needed for drivers to provide greater comfort and safety to vehicle traffic on urban roads. Thus, in this work, we propose the development of a system to monitor vehicle traffic, informing about events that are taking place on the roads in real time. The system can recommend new routes to drivers or allow drivers to take action based on information received from a particular road. As well as, the system uses driver location information for traffic monitoring, which will later be available for any devices, either a mobile device (smartphone) or a desktop. For the evaluation of the proposed system, a user case was developed for the Catanduva city in which we performed a test with the proposed system and was possible to verify a reduction in vehicle stopping time by 42% and a shorter travel time of 50% with an average speed of 33 km/h.
Introduction
The transportation system’s problems are directly related to the growth in the number of vehicles traveling in a city. As reported by the US Department of Traffic from 2010 to 2014, there was an increase of 10 million vehicles and an expansion of 100 million kilometers in the distances traveled by these vehicles. 1 In addition to this growth, the lack of planned development of urban centers can lead to severe socioeconomic problems.2,3 These include health problems due to prolonged exposure to toxic gases emitted by vehicles and monetary losses due to time stopped in congestion. The United States, the United Kingdom, and Germany spent approximately US$ 461 billion in 2017 on transportation-related issues. 4
Although the growing number of vehicles in an urban environment may be a negative aspect, if properly planned, these vehicles can be used as monitoring tools for intelligent environments, that is, through using the communication and computing capabilities onboard in these vehicles. So, it is possible to provide data that supports on-site computing.5,6 Such added features in vehicles can be new services and applications that are to be used for the transportation system that aims at more excellent safety and comfort for citizens, allowing them to optimize their travel routines between various parts of the city. 7
In the cities, the number of applications and services to urban mobility management has been increasing attributable to the technological advancement of vehicular networks, besides the arrival of new technologies to produce a different connection between devices. 8 The set of technologies and services is called intelligent transportation system (ITS), aiming to provide services and resources to enhance the cities’ transportation system. 9 Such systems can be structured in a Datacenter or a Cloud, providing all information processing and service delivery. 10
There are considerable numbers of papers in the literature that propose a set of services aimed at managing and assisting transportation that uses information from devices ingrained in vehicles and instructions from different sources such as control devices introduced in urban environments dealing with road influx monitoring. Some of these examples can be highlighted in the literature.11–15 They adopt references from the vehicles to recommend new directions. Such proposals were not in a real function, which shows the real versatility of such protocols but in simulators. Other works, as given in the literature,16–19 utilize vehicle information registered by diagnostic devices to monitor vehicle conditions such as fuel consumption and CO2 emissions. Nevertheless, these works do not make a relationship between the state of the vehicle and the vehicle route. That is, the system does not suggest new directions to the vehicle considering a decrease in fuel consumption.
To offer an intelligent transport system, we proposed the ITSMEI—an intelligent transport system for monitoring traffic and event information, which aims to inform users about city traffic conditions in real time, ITSMEI also informs users of possible events and interventions occurring in the city. Thus, users can make the best decision, in real time, choosing which route or action they should take. Thus, the planned system will utilize the road influx administration algorithms informing the user which streets are congested or interrupted due to an event. In this article, we consider an event as an intervention in which the city administration needs to interrupt traffic; in other words, a work of improvement on a street or a set of neighborhoods. Then, the service will rely on cellphone network automation to bring connectivity with the service provider through web services. The customers of this service can access the system from either a mobile device or a desktop.
ITSMEI is an extension of UrbTrans 20 work in which the cloud is used to store information and provides an information access interface. However, unlike UrbTrans, ITSMEI offers a mechanism for disseminating information about events in real time, providing information necessary for the user to take action to deviate from the pathways on which events are taking place. To this end, ITSMEI provides a route suggestion service that prevents the driver from getting stuck in a traffic jam and management service for events taking place in the city.
A case study was carried out to verify the impact of such a platform in Catanduva, evaluating the vehicles stopping time, travel time, distance traveled, and average vehicle speed. For this verification, we monitor the city mobility pattern with the system running and without the system running; the scenario without the use of ITSMEI was called monitoring standard (MS). It can be observed that although the use of ITSMEI resulted in a greater distance traveled of approximately 1 km; however, ITSMEI achieved a reduction in vehicle stopping time of 42% and a shorter travel time of 50% with an average speed of 35 km/h.
Therefore, the significant donation of this work is the development of an ITS which provides the following features:
City traffic monitoring.
Information about possible road events.
Suggested alternative routes in real time.
Optimization of city flow, minimizing congestion time.
The remainder of this article is structured as follows. Section “Related work” describes the main related works. Section “ITSMEI: an intelligent transport system for monitoring traffic and event information” presents the development of the proposed architecture and the use case description of the architecture. Section “Performance analysis” presents a validation of this use case Catanduva, in which the architecture is implemented. Finally, section “Conclusion and future work” presents the conclusion and future work.
Related work
This section presents related work that addresses the problem of route management, that is, managing and monitoring vehicle traffic in urban centers. In recent years, several works have explored this problem.13,21–27 However, until now, there is no adequate real-time service that provides useful information to the vehicle about what is happening in the streets as well as information captured by the mobile device drivers to perform efficient monitoring and suggesting new routes based on the streets status information.
In the market, some tools inform the user about road conditions such as Google Maps and Waze. However, these tools are proprietary and do not allow a manager to have control of their cities traffic or to include new information more quickly and efficiently. Besides, these tools are cooperative in which for the information to be disseminated. Some user has to register such an event. Therefore, this can bring a safety problem for drivers since the user who registered the event may not be reliable. Our solution offers a dynamic insertion of interventions in the road, which is carried out by the city management organ, bringing more excellent reliability in the information through the web page and showing these interventions in the smartphones, facilitating the management of the traffic.
Self-adaptive interactive navigation tool (SAINT) was proposed by Jeong et al., 28 which uses a central data center to perform traffic optimization. SAINT receives traffic conditions by communicating with vehicles with a cloud-hosted traffic control center. For this, the vehicles are equipped with 802.11p and 4G to establish the Internet connection to send information to the cloud. For route calculation, SAINT uses a modified Dijkstra algorithm, where the weight function takes into account the vehicle’s delay in reaching the roads of the route, preventing a particular street from becoming widespread, that is, all vehicles redirected to a particular street, causing a new traffic jam. For SAINT to function appropriately, vehicles need to periodically report route conditions over the Internet, which carries many messages. Besides, as SAINT uses the communication standard named dedicated short-range communications (DSRC), there is a lot of packet collision in dense urban environments because there is no optimization of the frequency of sending control packets.
Efficient road congestion detection protocol (ECODE) was proposed by Younes and Boukerche29,30 in which through the connection among vehicles and between vehicles with a roadside unit detects the congestion of city roads. This protocol takes into account the user’s requirements for choosing the route the user will take, that is, the protocol treats the user a route to consume less fuel once the user selects this requirement. Vehicles send an announcement message (ADV) containing their information such as speed, location, and direction to neighbors. This information is stored on each vehicle in a neighbor table where it is used to perform road density calculations. Thus, the vehicle connects to a roadside unit and transmits this table to that infrastructure. This infrastructure updates its information and verifies the best infrastructure management routes and propagates updates to vehicles. Since ECODE does not have an overview of the city map, it can redirect vehicles to the same set of roads.
Wang et al. 31 proposed a vehicle rerouting system called next road rerouting (NRR), to aid drivers in making the most appropriate next road choice to avoid unexpected traffic jams. NRR divides routing into two phases. In the first phase, the protocol checks if any of its intersection roads are congested, through a heuristic that takes into account a cost function in which it uses the information of travel time, distance to destination, among others. If the protocol detects that the road is congested, it informs the vehicles of the congestion. When vehicles receive this information, they request an alternate road. The second phase begins with receiving these alternate routes; it sends a confirmation of the new route on which it will take. NRR is dependent on the heuristic used to obtain and classify road traffic; without it, NRR will not function correctly.
INtelligent protocol of CongestIon DETection (INCIDEnT) was proposed by Meneguette et al., 14 which uses information transmitted between vehicles to classify the level of congestion. For this, INCIDEnT uses an artificial neural network (ANN) to estimate congestion and maximize the flow of urban traffic. ANN uses vehicle density and average vehicle speed as an input to the traffic classification system. Once the congestion classification has been made, new routes for drivers will be suggested. Congestion is classified into three levels: free, moderate, and congested. Finally, classification data are disseminated to all vehicles on the road through periodic messages. When the message is sent to the vehicle about a road congestion level, and he receives that, ANN can conclude whether to maintain the directions or calculate a new route with alternative directions. However, the solution does not have complete knowledge so that it can generate new congestion.
Fast offset Xpath (FOX) was proposed by Brennand et al., 32 which deals with congestion management in-vehicle networks. FOX periodically changes vehicle routes with the help of a Fog. Fog is used to decentralize information processing and storage, creating smaller regions. Also, FOX also uses a road side unit (RSU) infrastructure. These RSUs have the same radius of communication and are spread across the map to cover the entire urban region. Fox makes use of both communication as well as between vehicles and the RSU so that the vehicle can report its average speed to the RSU. The RSU communicates with fog, which in turn periodically checks for congestion in its region and, if any, notifies the vehicle with a new route. The new route is randomly chosen by fog, following Boltzmann’s distribution among the shortest k-paths to provide load balancing. Another way to balance the load is to avoid using long routes due to the limit value.
Following the opposite path of other works which utilize simulators or use the data captured only to implement the fuel consumption of vehicles and diagnosis of emissions, this work offers the improvement of a real-time service that provides effective use of vehicle information and also information captured by the driver’s mobile device performing efficient monitoring and suggesting routes. It is also proposed in this work the elaboration of storage infrastructure and the opening of new services that use instructions abstracted by the driver’s mobile device.
ITSMEI: an intelligent transport system for monitoring traffic and event information
In this section, we describe the proposed system, named ITSMEI, which aims to provide relevant information to the users in real time, so that they can make the best decision to optimize their mobility in an urban environment. Besides, ITSMEI may suggest possible alternative routes for the driver to avoid a place where an event is occurring. An event can be a road reform, a temporarily hindered road, or something that prevents drivers from driving along the road. Therefore, ITSMEI will not only provide information on events that are taking place on the roads and suggest alternative routes but also provide urban mobility monitoring, in which the user will be able to view the possibly congested points. Thus, the proposed system focuses on reducing congestion in an urban environment caused by some occurrence on the road, bringing greater comfort and safety for drivers.
ITSMEI uses an application that is installed on the driver’s mobile device such as a tablet, a smartphone, or other mobile devices that has a geolocation system. This mobile application will capture location, speed, direction information, as well as capture traffic conditions of the pre-established route to perform a possible route change, whether necessary. Also, the system will need to aggregate this information to be transmitted to a control center. This control center will provide a set of services to optimize the flow of vehicles on roads, making these vehicles have a good flow, avoiding roads where an event is occurring or roads that are temporarily congested.
Due to the large amount of information that ITSMEI needs to manage, it is necessary to perform an efficient data collection by the computational components that consist of the ITSMEI structure, aiming at flexibility and low cost. For this, cloud services were used to maintain the scalability of the system in the face of the demand for service requests. That is, the cloud offers greater flexibility in information storage and processing capacity. Communication between the cloud and mobile devices will take place over the broader cellular networks. In the vast majority of large urban centers, cellular network infrastructure covers the entire city, meaning there will be no regions without a connection. Besides, ITSMEI will provide a secure communication mechanism through encryption mechanisms to make it challenging to access driver location information. An overview of the ITSMEI system is available in the section below.
An overview of ITSMEI
ITSMEI is divided into two components (Figure 1)

ITSMEI overview.
Cloud
Analyzing the cloud in more detailed way, we can realize that this component can be divided into six features:
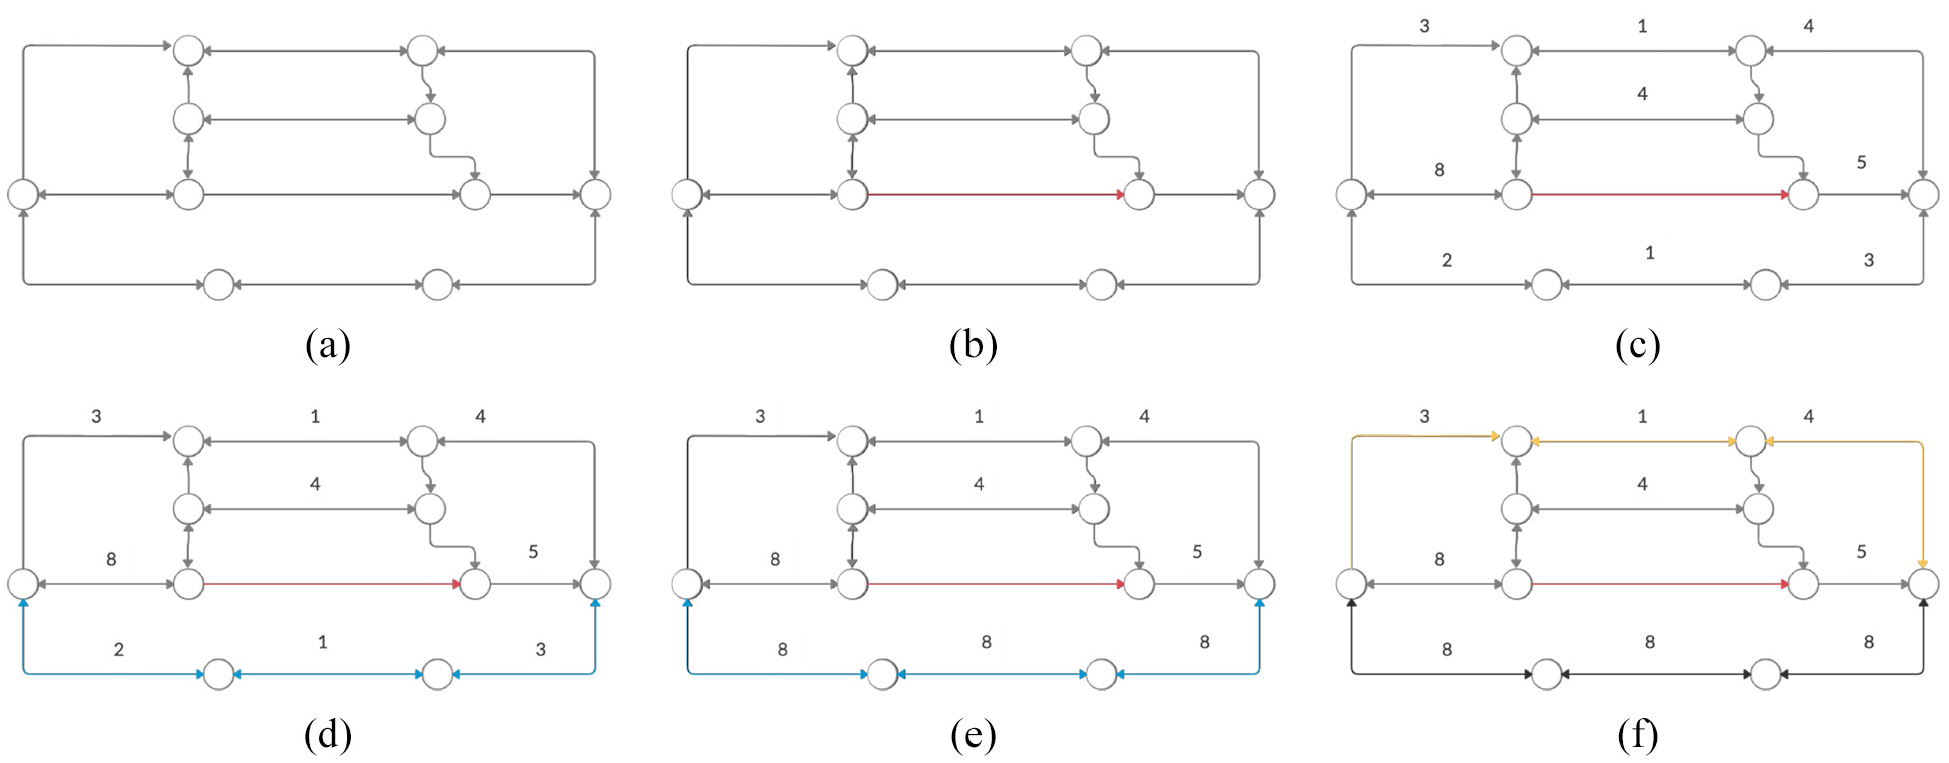
Route suggestion mechanisms. Initially and passed the roads as a graph, where the vertices are the intersections of the streets and the roads are the edges. (a) Representation of the roads as a graph, in which the two vertices at the borders are the beginning of the trajectory (vertex of the right) and end of the trajectory (left vertex). Later, (b) the road (edge) on which there is an event – red line. Once the edges of the events are disregarded, (c) the vehicle density on the road is calculated (Dijkstra-based algorithm) to indicate (d) a route suggestion for the user. (e) If this route is overloaded, then (f) a new route is suggested to the user.
Mobile device
When we analyze in more detail the mobile, we can see that its components are subdivided into the following features of ITSMEI:
Use case
To perform an efficiency evaluation of the ITSMEI, we developed a use case for both the cloud component and the main features of the mobile device. The following sections describe how these components were implemented.
Cloud
For the development of cloud services, the Firebase database was used, offering several functionalities and sufficient infrastructure for connecting and communicating different types of devices. Firebase is a service that offers Backend as a Service (BaaS), providing for developers a simplified way to set up and operate a cloud backend for mobile and web applications. This service was chosen for the scalability and heterogeneity of the devices that consume their services. For this project, the primary service used was Firebase Real-time Database, a non-relational cloud-hosted database. Its storage structure is based on JavaScript Object Notation (JSON), and its data are synchronized in real time with the connected clients. These data remain available even when the application is offline. The attributes stored in the database are described in Table 1.
Attributes for storing events in the database.

In addition to the database storing road events, it also stores information about user-profiles and other system-relevant data, such as event approvals, as described in the section.
A web application was developed for the visualization of the data stored in the database. This website was implemented using the React and AntDesign Pro frameworks to make the development faster. Besides, some Google Maps’ application programming interfaces (APIs) were used for viewing and searching the points of a particular event.
The basic structure of an interdiction route is comprised of two sets of coordinates: origin and destination. Through them, the route will be calculated. The description and additional information about the interdiction will be according to the need of the traffic department of Catanduva. When the website page has opened, an instance of Google Maps is started. A request is sent to the database that returns in its response a vector of routes to be calculated through the Google Maps’ directions service and displayed on the map (Figure 3).
Application opening map displaying blocked routes.
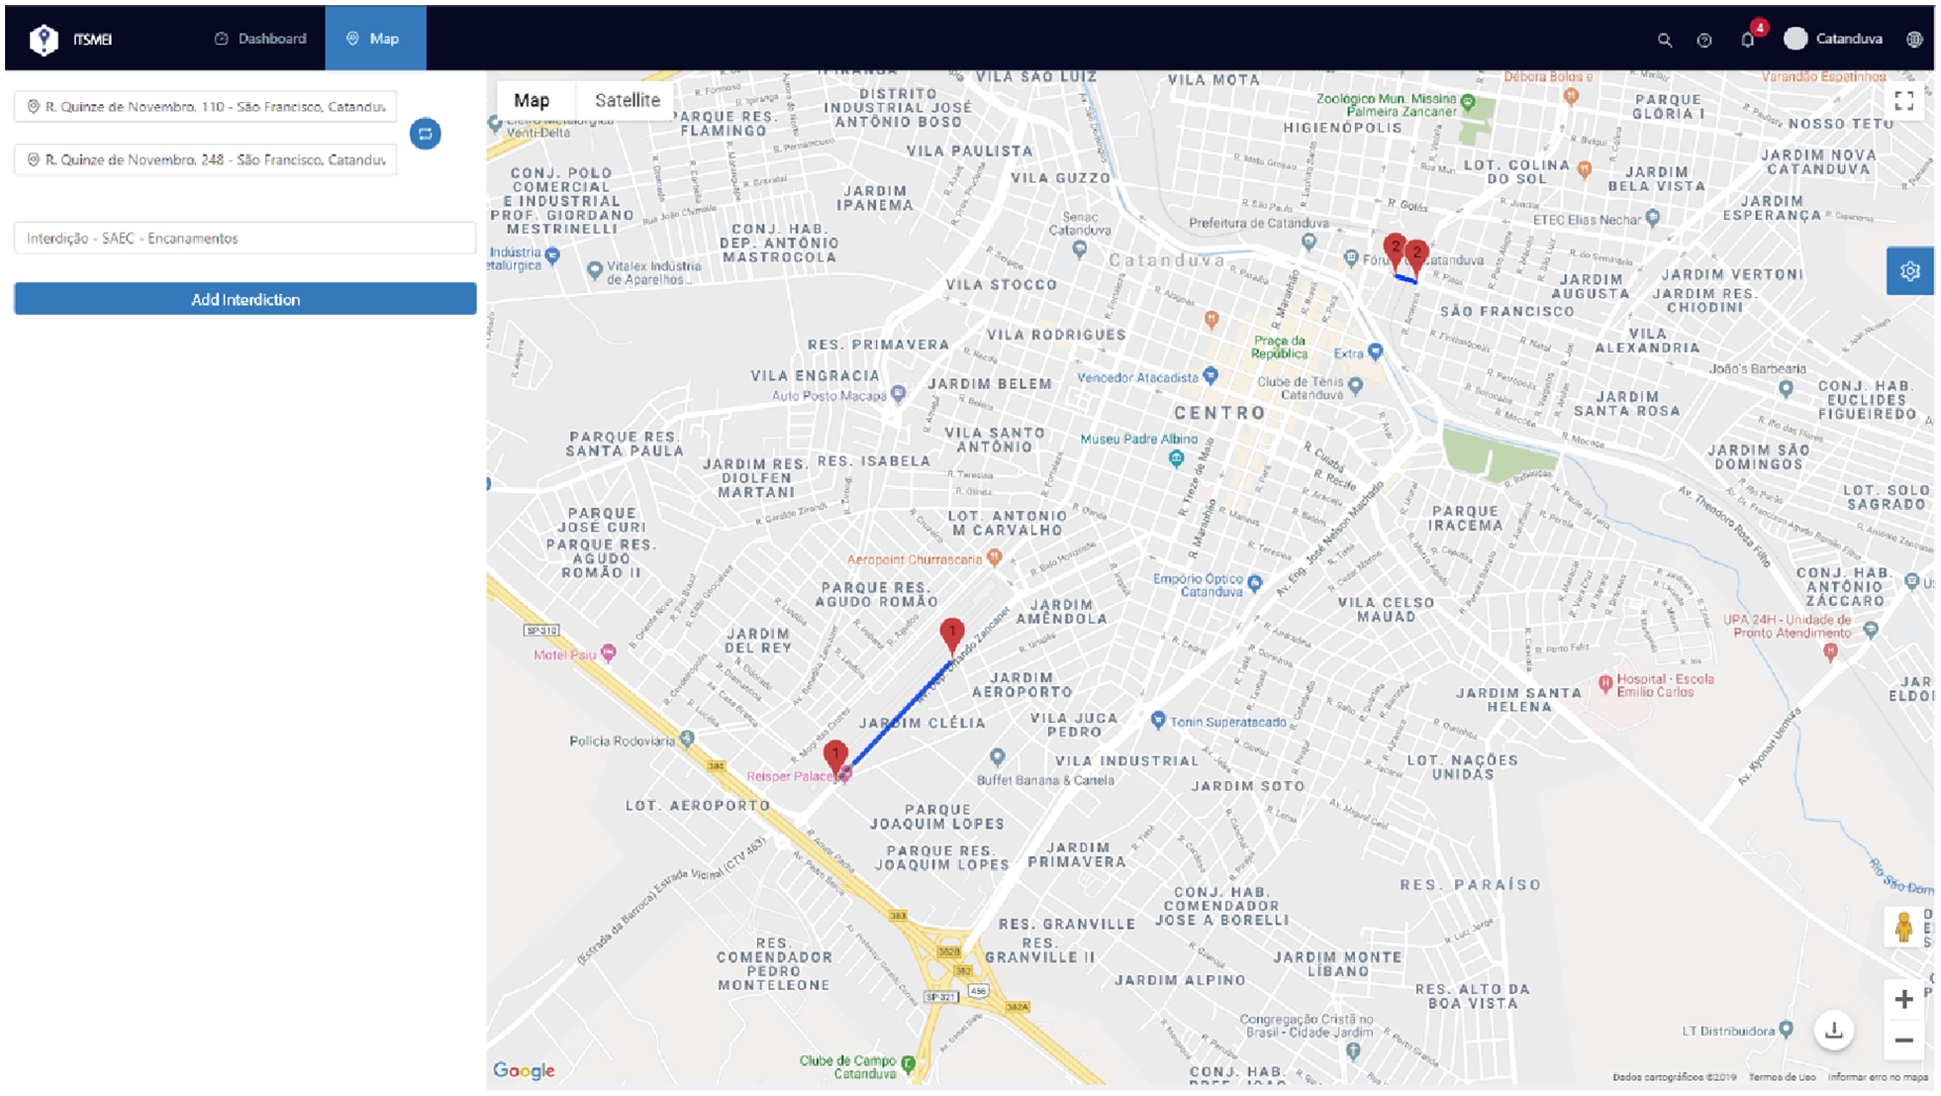
The registration of a new interdiction is started by double-clicking on the map that makes the system capture the coordinates of this point (latitude and longitude). Coordinates are processed by a reverse georeferencing in the Nominatim API, which returns information related to the coordinate address. Thus, the first point marked on the map is called the origin point. The same process occurs for the second point that will be called a destination point. In Figure 4, the system plots the route between coordinates on the map using the Google Maps’ directions API.

Route plotted between the coordinates.
Having the respective information about the forbidden route, the system offers the option “Add interdiction,” as shown in Figure 5. By pressing the button to add the interdiction, all information will be sent to the backend service as a JSON message and stored in the Firebase Real-Time Database.

Registration menu showing data related to the forbidden route.
After confirming that the interdiction has been stored in the database, the system updates the map with the new route.
Figure 6 shows the sequence diagram to exemplify the registration of an intervention operation. Initially, the user accesses the system map and a double-click activates the marker creation function on the map, the coordinates of this point are sent to the global positioning system (GPS) function, which returns the address information of that coordinate (street, city, and state). This information is stored in the “origin point.” Later, the user repeats the action at the point that wants to be the end of the interdiction route. Another marker is created, and the coordinate data are sent to the GPS function to return the address information “destination point.” Finally, the map component calls the Google Maps’ directions API passing the two coordinates (origin and destination) to create a route that will be plotted on the map as the interdiction route, probably due to an event.
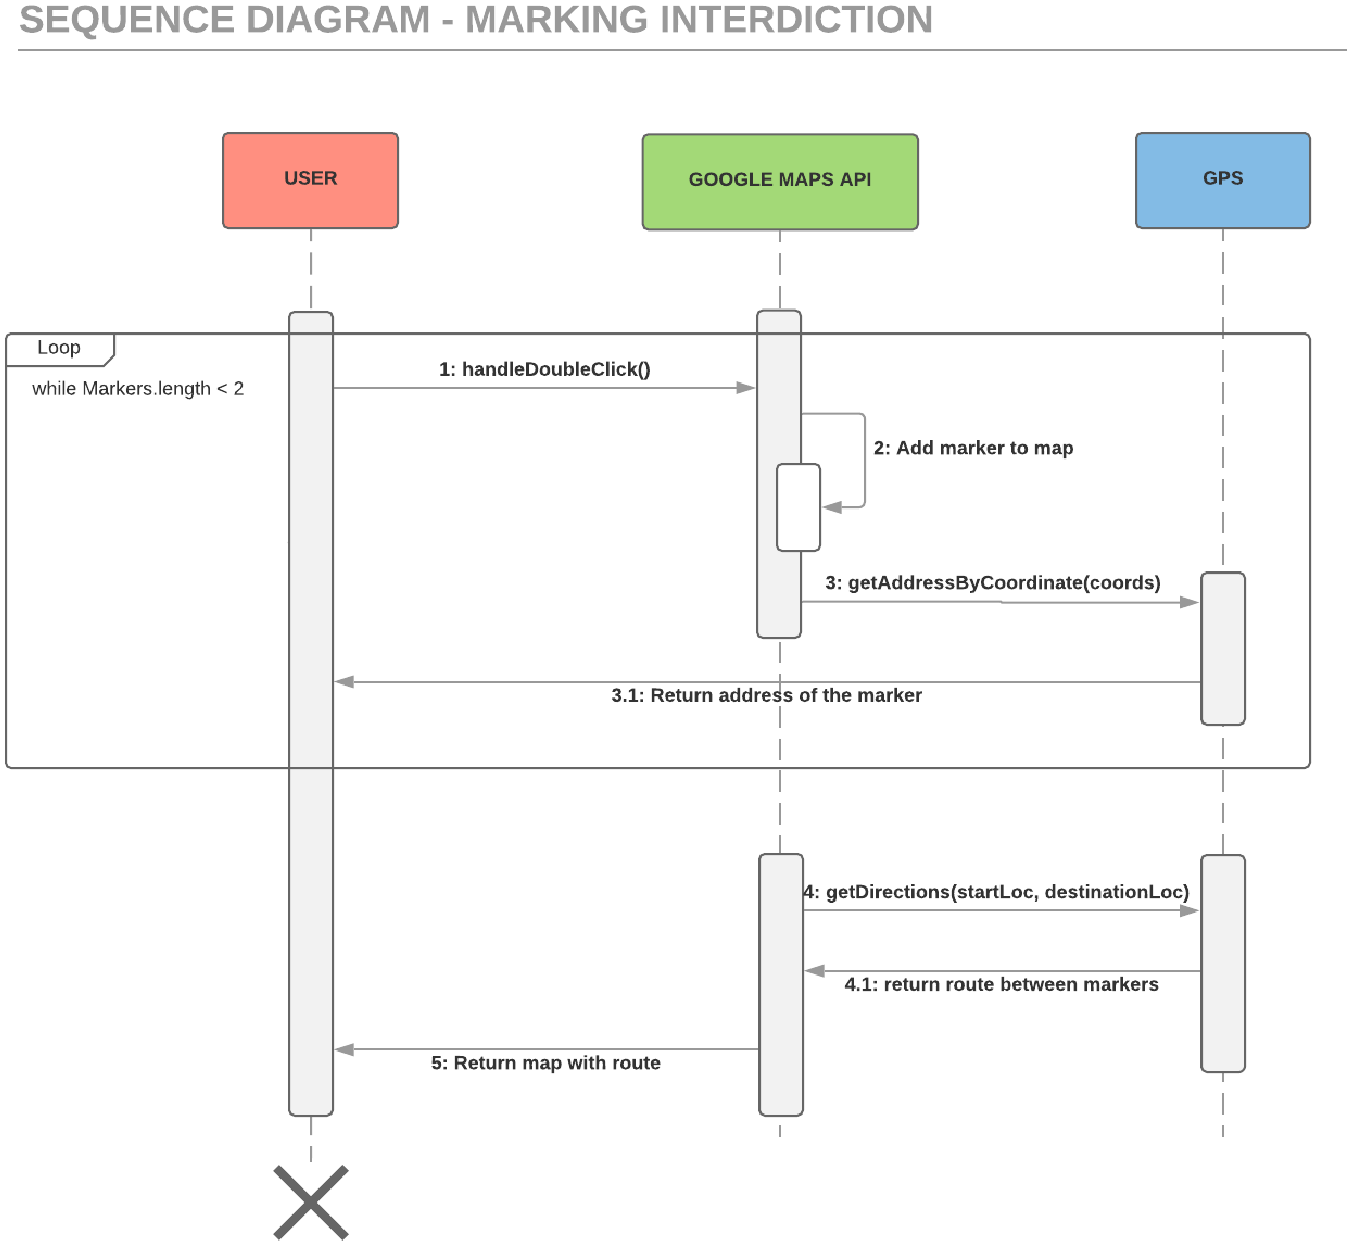
Sequence diagram for event registration.
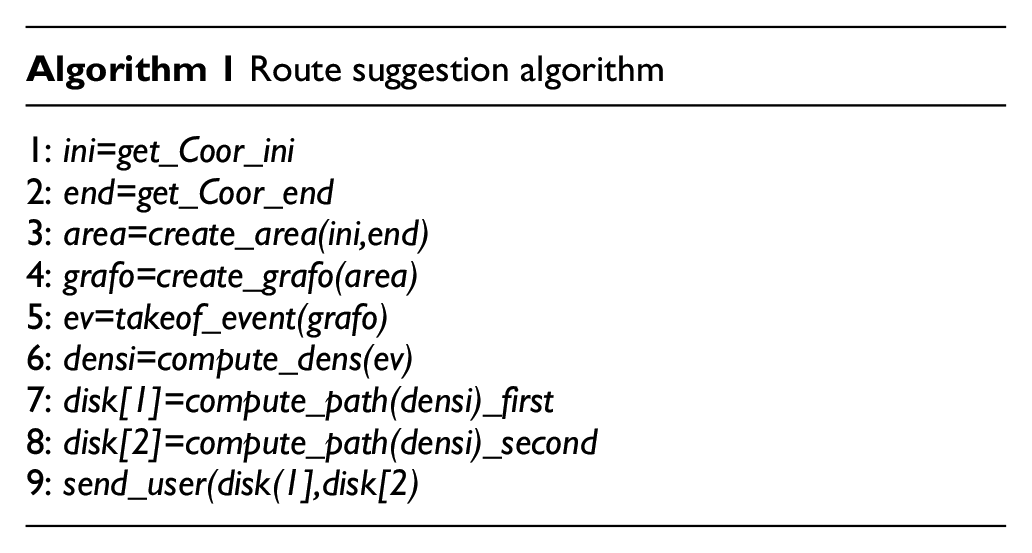
By registering information about both events and vehicle flows in the city, ITSMEI can trigger the route suggestion mechanism. As the start and endpoint, an area is created which encompasses the city streets that are between these two points (lines 1–3 of algorithm 1). After this area is created, a graph is obtained where the intersections of the roads are the vertices, and the edges are the roads, the roads in which an event is occurring at that moment are removed, and the vehicle densities and each road are calculated based on the data in the database (lines 4–5). The event edges are calculated and redirected, and the Dijkstra algorithm is used to calculate possible routes that are passed to users (lines 6–7). In this work, at least two alternative routes are passed.
Mobile device
Java language and Android Studio 3.0 IDE were used for the development of the mobile application. The application has only two interfaces, and there is no need to have an access account for using it.
However, to be used, the mobile application needs two user permissions, both are responsible for obtaining its location. The first way to get location is using the smartphone’s GPS, which has better performance and accuracy in identifying the user’s location. This method uses the smartphone’s GPS services to communicate with satellites and acquire the current location. The second way is triggered when the first way has an unavailability problem. Thus, the second way obtains the approximate location of the device through the Internet connection. Unfortunately, the second way is less accurate and increases the data consumption of the device.
By clicking on the vehicle type (Figure 7), the location capture service starts in the background, and the application change to the map screen, allowing the users to run other applications and perform other activities on their smartphone. Every 3 s, the application requests the user’s location (current coordinates) and the speed of movement that will be used to calculate the average speed over the entire route. Every 5 min, the data collection service is executed to obtain all coordinates, calculate the average speed, and sent them to Firebase with other information. Even if the user is not connected to the Internet, data will be sent to the database when the user activates their device’s mobile network or connect to a wifi network, thus completing the process of capturing route information. The user can request a route suggestion to the central by sending the two coordinates. As shown in Figure 8, once the application receives the suggestions, the user can choose either route to avoid an event that is occurring or a traffic jam.

First screen.

Directions suggestion screen.
Performance analysis
This section describes the evaluation of ITSMEI compared to the mobility standard (MS) of the city of Catanduva. MS is an original vehicular mobility trace where the vehicles do not have information about events taking place on the roads in real time. This will make it possible to understand ITSMEI’s gains compared to a traditional approach. Catanduva is a city in the interior of the state of São Paulo, Brazil, a city that has approximately 120,000 inhabitants, with an area of 290.6 km2, being 15% of urbanization with public roads, streets, and avenues, 33 as shown in Figure 9.

Catanduva city.
For the evaluation of ITSMEI, we considered the whole urban area of the city. We divided the evaluation into two steps as follows: (1) evaluation of the impact of ITSMEI on mobile devices and (2) evaluation of the impact of traffic efficiency using ITSMEI compared to the MS, in other words, the impact of ITSMEI in the city of Catanduva. Metrics and methodologies used to obtain the results are shown in the next subsections.
Evaluation of ITSMEI in mobile devices
In the first evaluation, we performed tests on three different models of smartphones, everyone with an Android operating system and the data were acquired by the android application report. The first smartphone (Smartphone 1) had 32 GB of storage memory, Cortex-A53 chipset Qualcomm Snapdragon 625 MSM 8953, 2 GHz processor with eight cores (octa-core), Android operating system version 8.1.0, Adreno 506 graphics processor, 4 GB of RAM, and a LiPo battery with a capacity of 3080 mAh. The second smartphone (Smartphone 2) has 64 GB of storage memory, Qualcomm Snapdragon 430 chipset Cortex-A53 4 × 1.4 GHz Cortex-A53 and 4 × 1.1 GHz Cortex-A53, eight-core processor (octa-core), Android operating system version 8.1.0, Adreno 505 graphics processing unit, 2 GB of RAM, and a lithium-type battery with a capacity of 2800 mAh. The third smartphone (Smartphone 3) has 64 GB of storage memory, Cortex-A53 chipset Qualcomm Snapdragon 630, eight-core processor (four octa-core) 4 × 2.2 GHz Cortex-A53 + 4 × 1.8 GHz, Android operating system version 8.0.0, Adreno 508 graphics processor, 4 GB RAM and a lithium-type battery with a capacity of 3300 mAh. Table 2 describes the specifications of each smartphone.
Specifications of each smartphone.

RAM: random access memory; GB: Gigabyte.
The experiments were performed once for 20 min running the ITSMEI on the 4G network. The time selected for the experiments was based on a study conducted by the Institute of Applied Economic Research (IPEA). As the objective of the evaluation is to understand the impact of ITSMEI on the mobile device, the following metrics were used: memory, battery, and mobile data.
Figure 10(a) shows the amount of mobile data that was used during the execution of the experiments on smartphones. It is observed that the consumption of mobile data was low, regardless of the smartphones used. In the worst case, the most massive consumption was Smartphone 3 that used 63.12 KB when compared to the best case Smartphone 2, which used 27.80 KB. One reason for the low consumption of mobile data is that the application only requests to the cloud every 2 min to send the current position of the user to be displayed at the website and another one to send all user locations at the end. Smartphone 2 performed more economically than the other smartphone. Smartphone 3 achieved the highest mobile data usage compared to the others, probably since the route traveled for this particular case was higher when compared to the others.

Impact of ITSMEI on mobile devices: (a) mobile data usage, (b) battery consumption, and (c) memory usage.
Figure 10(b) shows the results obtained for the battery consumption metric. It is noted that the battery consumption was significantly low since it does not exceed 1% of the battery during the 20 min of experiments, independent of smartphones. In Smartphone 3, the battery consumption was 8 mAh. This is because the app runs in the background, with the smartphone being momentarily turned off. In Smartphones 1 and 2, the battery consumption was 23 and 25 mAh, respectively. This increase is related to the use of other applications that are running on smartphones. This is confirmed that it may influence battery consumption. This is a reality to be assumed since users do not access just one application during use.
Figure 10(c) shows the amount of memory consumed when ITSMEI is used. It is observed that memory usage in smartphones usually did not show significant usage when ITSMEI runs. The highest usage was from Smartphone 1 with 12 MB, and the lowest was from Smartphone 3 with 3.3 MB. With such experiments, it is possible to confirm the feasibility of deploying ITSMEI on mobile devices.
Evaluate of ITSMEI in the transportation system
In the second evaluation, we evaluated the impact of traffic efficiency using ITSMEI compared to the MS. For this, 2000 vehicles were used, which are divided into two groups: (1) 1000 vehicles received notifications of events and road interventions and (2) 1000 did not receive these notifications, only the geographical position of the vehicles was updated. In addition, the city has more drivers who will be in traffic with the vehicles we are monitoring. The impossibility of evaluating these drivers will be due to the lack of use of ITSMEI. Furthermore, during the evaluation, period three interventions were active in which two streets are in the center of the city and another on the main avenue of the city near the municipal market. The interventions correspond to improvements in the roads in which the streets need to be blocked or closed for the execution of these improvements. For example, if the city needs to recap a street to improve the asphalt, that street must be closed for this improvement to occur.
User recruitment was accomplished by publicizing the user application in mass media such as radio (https://soundcloud.com/cbncat/instituto-federal-rodolfo-ipolito-meneguette-cidades-inteligentes?fbclid=IwAR0fD7kNzDivNLKOX5o-urR94UhScv8iU14MIHD8nQQG88t70yeZpaKk0MQ) and TV (https://www.facebook.com/watch/?v=374658653383176). These disclosures were passed all the use and what was the policy of use of the application. Thus, when downloading the app, the user accepted the app’s terms of use as it was necessary to generate a usage policy for the app to be made available on the Google play store. Therefore, when the user downloaded the application, he was aware of and accepted the terms of use. Only his location data would be transmitted to a switch from time to time. Once the user accepted the term of use of the application when downloading it, the system itself will generate the user’s mobility trace without the user providing any additional information. It is through this system-generated trace that the system performance evaluation is performed.
The system was evaluated when most vehicles are traveling for several days, that is, 11 am–1 pm. It is the range that the drivers have lunch and return to work. The following metrics were used to evaluate ITSMEI:
Figure 11 shows the average of results obtained to evaluate traffic efficiency using ITSMEI. As noted in Figure 11(a), TSMEI obtained a time reduction of approximately 42% compared to the MS. Such a reduction is due to drivers using ITSMEI. In this case, the drivers were warned about an event on the roads (for instance, congestion or vehicle crashes), so they may take alternative routes to avoid traffic near these forbidden roads. However, users can utilize other tools, like Google Maps or Waze, for the comparison of these functions. However, due to the lack of cooperation, such dissemination of interdiction did not arrive in time for action to be taken. Thus, ITSMEI provides a shorter time that the vehicle has stopped directly affects the travel time, as shown in Figure 11(b). ITSMEI reduced travel time by approximately 50% compared to MS. Another factor contributing to this reduction was the average speed of the vehicles.

Impact of ITSMEI in the transportation system: (a) stopped time, (b) traveled time, (c) average speed, and (d) traveled distance.
Figure 11(c) depicts the results obtained to the average speed of vehicles. As expected, ITSMEI achieved a higher average vehicle speed. This is because ITSMEI suggests a set of alternatives that make it easier for the user to decide on which street to take. Such a suggestion takes into consideration the streets that are halted and also the density of the roads, thus avoiding the emergence of a new traffic jam on another road.
Analyzing the distance traveled (Figure 11(d)), we can see that the MS decreased the distance traveled because the driver did not need to deviate from his route to reach his destination. In other words, ITSMEI obtained an increase in approximately 1 km due to the deviation in the vehicle route to avoid the event. Therefore, ITSMEI achieved a reduction in the time that the vehicle spent stopping due to an event or congestion. As a result, it reduced travel time as well as increased average vehicle speed.
Conclusion and future work
This article presents the development and functionalities of an intelligent transport system that allows the tracking and traceability of vehicles, allowing drivers to be informed about possible events that may be occurring on the roads. Besides, a use case was developed in the city of Catanduva through the cellular network and mobile devices carried by the drivers. The mobile device updates the central in real time with the position of the users through the geolocation mechanisms as well as receives the points where some events are happening and alternative routes for the user to deviate from these points. The system source code is found on the Internet (https://github.com/intcurb/ITSMEI).
As a result, we can see a reduction in the time that the vehicle spent stopping due to an event or congestion. Also, it has reduced travel time as well as increased average vehicle speed.
As further work, we intend to explore A* algorithm or other similar shortest path searching to improve the route computation time. Moreover, we plan to apply the ITSMEI to different contexts, for instance, highway environments.
Footnotes
Handling Editor: Kavita Pandey
Declaration of conflicting interests
The author(s) declared no potential conflicts of interest with respect to the research, authorship, and/or publication of this article.
Funding
The author(s) disclosed receipt of the following financial support for the research, authorship, and/or publication of this article: RI Meneguette would like to thanks CNPq (process 407248/2018-8 and 309822/2018-1) for funding the research project, the financial support granted by São Paulo Research Foundation (FAPESP), process 2020/07162-0, in his research.