
Abstract
Compared with public transport operations, urban freight traffic and its associated delivery operations seem to be frequently overlooked in urban traffic management and traffic flow theory. One explanation for this is certainly the lack of available data, as the competitive freight transport market is fragmented and several actors are unwilling to collect or share tactical and operational data. In this study, we use the unique pNEUMA drone data set from Athens, Greece, to shed light on urban freight operations. We discuss macroscopic traffic indicators in a multimodal context. As the vehicle stopping behavior can adversely influence traffic flow, we reveal the stopping behavior of the different modes represented in the data set using clustering techniques. We find that urban freight vehicles’ stopping frequency lies between the stopping frequencies of cars and buses. We reveal the distribution of stopping times for loading and unloading stops in Athens to have a mean of around 380 seconds. Clustering all loading and unloading stops further reveals three groups of loading and unloading stops that could be labeled by incorporating knowledge and expertise about local particularities. The limited flight time of drones, owing to their battery capacities, did not allow reconstruction of longer vehicle routes, such as an entire vehicle tour within the network. However, this could be addressed in future research by realizing continuous large-scale monitoring routines. The revealed vehicle behavior parameters can be used in traffic models to generate further insights into the impacts of urban freight transport to inform public sector decision makers.
Keywords
The field of urban freight transport (UFT) is considered essential for the functioning of urban economies as it provides the freight flows that are vital to providing products and services within the urban area ( 1 ). At the same time, UFT contributes to the existing externalities of transport (e.g., congestion or pollutant emissions). As these externalities are typically borne by society, minimizing the negative side effects and serving the framework conditions to optimize UFT system performance are key objectives of public sector decision-making. In this regard, the public sector bears the responsibility for implementing solutions that not only satisfy the short-term pressure to act but also anticipate future-viable solutions that will allow sufficient management of potential transport demands (for an overview on the variety of existing measures for the UFT management, see for example research by Holguín-Veras et al. ( 2 , 3 )). The extent of these future demands depends on various parameters that cannot be predicted precisely and with certainty, such as the expected impacts of new business models for on-demand grocery e-commerce or the effects of large-scale work-from-home movements.
As this responsibility is framed by existing and binding political objectives on a supranational, national, as well as regional level, a particular need for the proactive management of UFT systems ( 4 , 5 ) and for corresponding decision support approaches arises (e.g., Marcucci et al. ( 6 ), Otte et al. ( 7 ), and Otte and Meisen ( 8 )). To support the decision-making process and to ensure sufficient accuracy of the considerations during that process, introducing reliable real-world data into the process is important. However, owing to the heterogeneity of the involved interests within the highly competitive UFT market (e.g., leading to data privacy concerns and a reluctance to engage in informational cooperation), the field of UFT is characterized by a variety of data-related observations and resulting challenges that have been summarized in a recent report for the European Commission ( 1 ) and are represented within the bottom section of Figure 1.
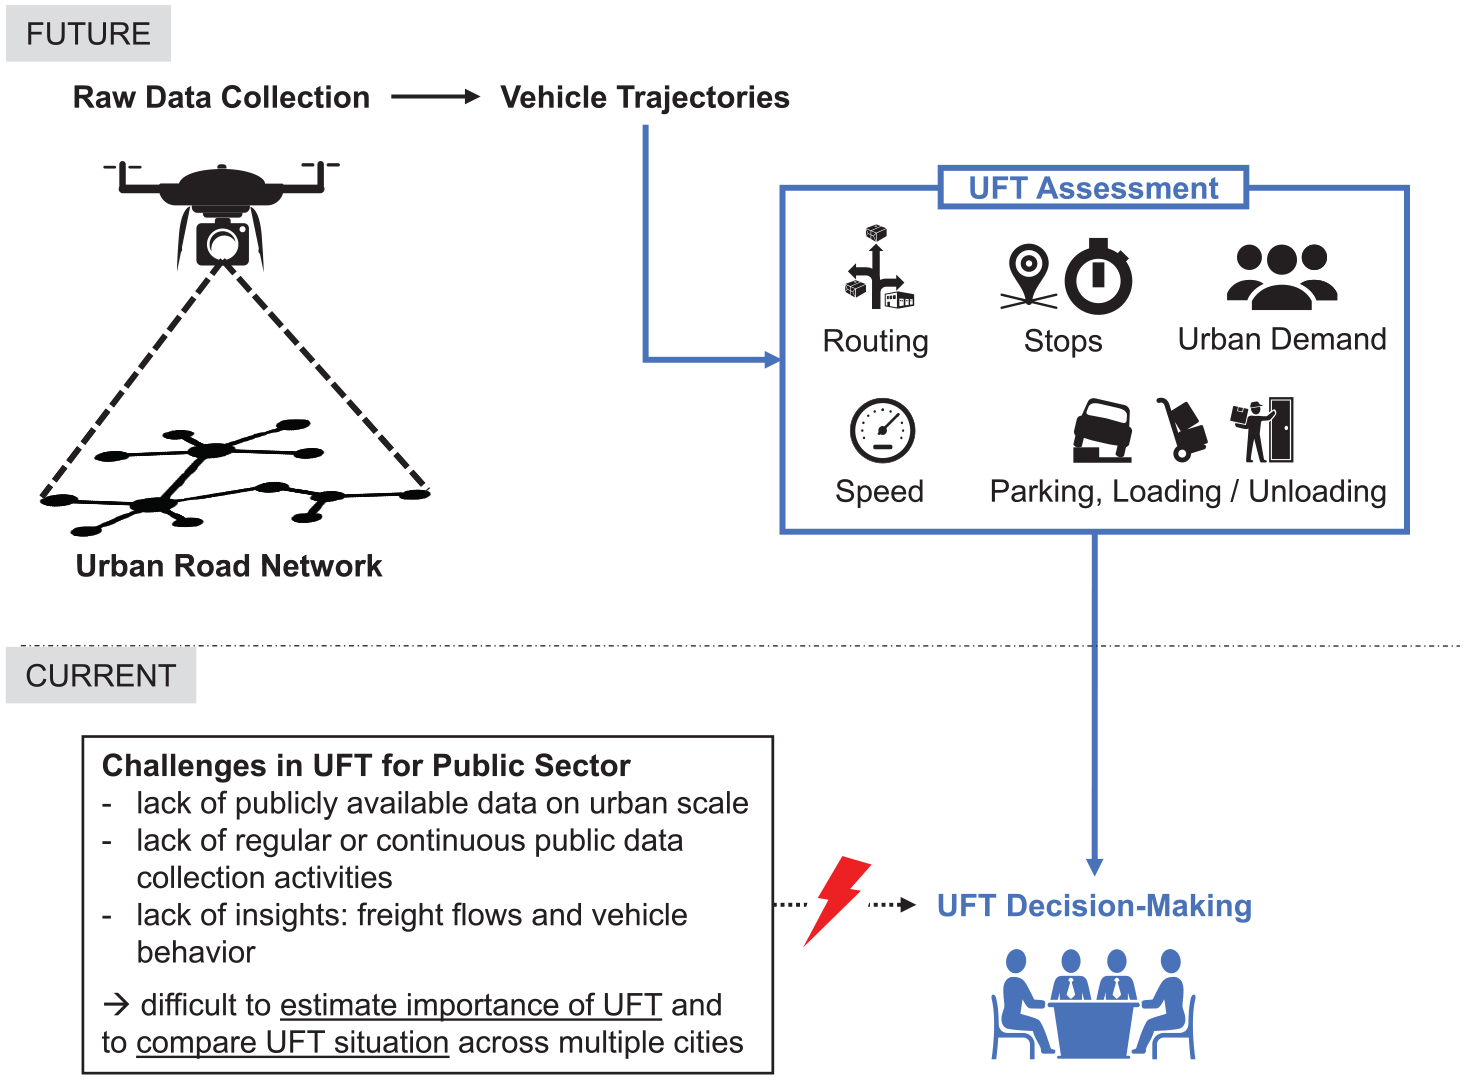
Vehicle trajectories extracted from drone data allow assessment of the urban freight transport (UFT) situation on an urban level.
To provide a reliable basis for more informed and transparent decision-making processes in municipalities, various approaches could be applied to obtain real-world data about the behavior of UFT systems ( 1 ): Data can be recorded from the real world (e.g., surveys, observation studies, interviews, sensors), generated in simulated environments, or exchanged with third parties (e.g., urban freight forums with stakeholders, open data platforms).
For the benefit of the overall system (and thus also for the benefit of each actor and interest group involved), it should be avoided that private interests and/or concerns influence (e.g., by adjusting the data quality or -selection provided), limit, or—at worst—even preclude the public sector from acting (e.g., by not making data available).Therefore, there is currently a particular necessity to develop methods to resolve potential dependencies of public sector decision makers from the willingness of third parties to provide data.
Further, methods to translate these data into information on the impact of UFT on traffic and its external costs are required for appropriate decision-making and regulation. However, in current urban traffic modeling, where externalities can be computed, urban freight vehicles (UFVs) have been considered as a vehicle type, but rarely with their associated loading and unloading stopping behavior that influences urban traffic. There has been substantial interest in modeling interactions between different vehicle types on motorways, for example, between cars and trucks ( 9 ). UFT research most notably addresses the problem of routing ( 10 , 11 ), the location of distribution centers ( 12 , 13 ), parking ( 14 ), or lately a possible integration into passenger transport by ride-parcel pooling ( 15 ).
Building on urban network flow models ( 16 – 18 ), we have already proposed a conceptual framework to assess the impact of UFT at a macroscopic network level ( 19 ). This is based on the additional delays on general traffic generated by UFV loading and unloading stops, which is considered similar to the behavior of buses ( 20 – 22 ), with UFV behavior being characterized by higher randomness in its design parameters (e.g., stop locations, stop distances, stop times) from the perspective of external observations.
In this study, we use data from a large-scale traffic monitoring experiment with (aerial) drones (i.e., pNEUMA data set from Athens, Greece ( 23 )) to take an initial step towards understanding the impacts of UFT on urban traffic to improve public sector decision-making in the context of UFT. A variety of UFT parameters can be derived or estimated using vehicle trajectories from drone data as seen in Figure 1. We first perform an exploratory data analysis to compare the behavior of UFVs to those of cars and buses within the network. Second, to parameterize UFT loading and unloading stops, we utilize k-means clustering to cluster UFT stops, which enables us to separate loading and unloading stops from the general traffic-related stops of UFVs (e.g., at traffic lights, in congestion).
This paper is organized as follows. In the next section, we introduce the pNEUMA data set, explain our data processing procedures and describe an exploratory data analysis from the UFT perspective. Subsequently, we perform a clustering of urban freight vehicle stops to separate the service stops for loading or unloading goods from traffic-related stops. We close this paper by discussing the results and pointing out where the results could be used in modeling and decision-making.
Data Set
We utilize the pNEUMA data set presented by Barmpounakis and Geroliminis ( 23 ). In their recent traffic-monitoring experiment, they used (consumer) quadcopter drones (DJI Phantom 4 Advanced; see manufacturer’s website ( 24 ) for detailed technical specifications) to collect video footage (4K: 4096 × 2160 at 25 fps) of a predefined monitoring area within the city of Athens (Greece). In total, the monitoring area consisted of 1.3 km2 and included an approximately 10-km road network with approximately 100 intersections (see Figure 2).
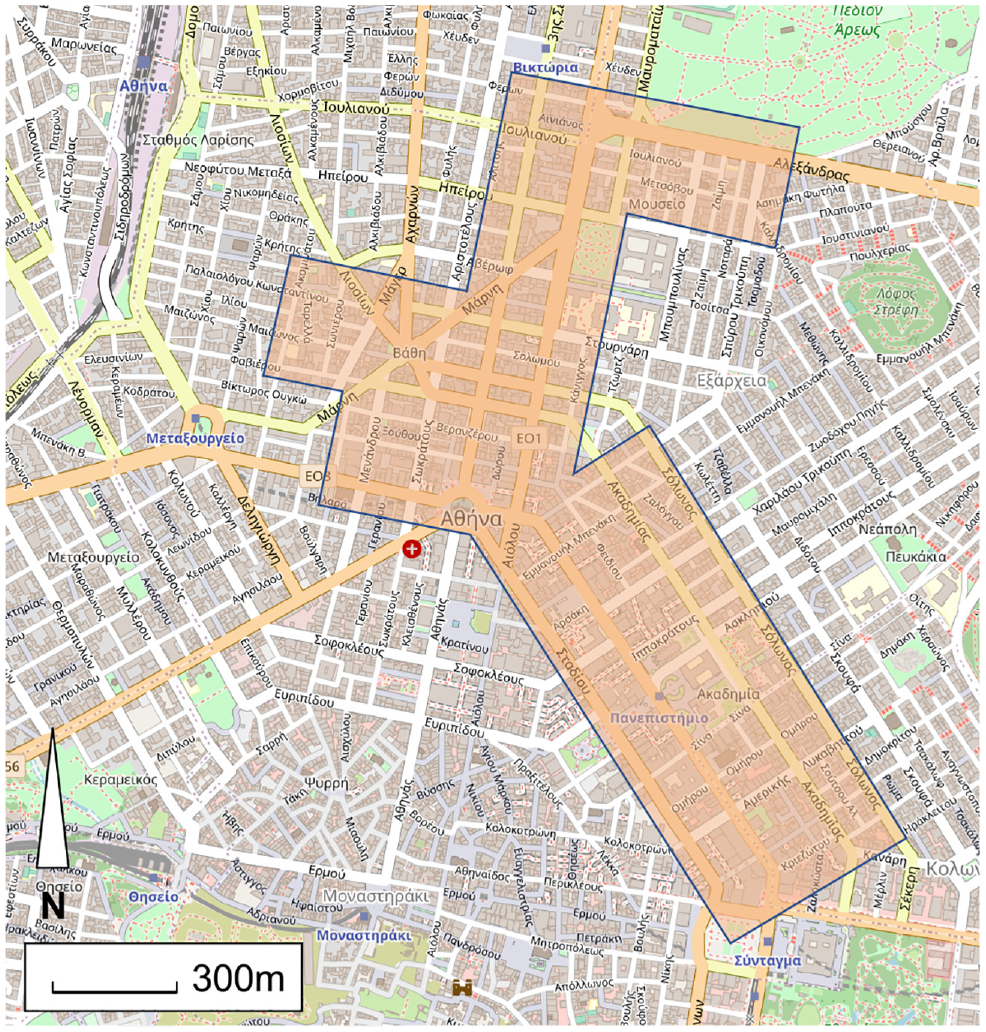
Experimental site in Athens. The polygon indicates the overall monitoring area covered by the drone swarm.
The authors’ experimental design contained a swarm of ten neighboring drones with synchronous individual hovering points and overlapping monitoring areas to enable not only the synchronization of time and space but also the reidentification of vehicles beyond the limitations of one individual monitoring area. The drones’ takeoff and landing areas were deployed on two rooftops within the city center. Having chosen the essential parameters of the experiment (i.e., takeoff and landing areas, size of swarm, hovering points, altitude), specific flight plans were defined for each drone (e.g., takeoff times, routes, altitude profiles) to realize simultaneous and energy-efficient traffic stream recordings. The monitoring took place during the morning peak between 8:00 and 10:30 a.m. for every day of a working week. Each of the 2.5 hour morning peaks was segmented into five sequential flights (i.e., monitoring sequences) of 30 minutes including the takeoff and landing procedures (e.g., for battery change). Therefore, the simultaneous swarmwide traffic recording time per monitoring sequence was marginally shorter than 30 minutes. For the overall monitoring experiment, professional drone pilots controlled the drones following the predefined flight plans.
In a subsequent offline analysis of the recorded videos, detailed vehicle trajectories were identified. The offline analysis was subcontracted to DataFromSky, a company that claims greater than 98% accuracy for vehicle detection and tracking. Although the company does not disclose its proprietary algorithms, this accuracy has been manually validated in research by Barmpounakis and Geroliminis, in which further details about the data set as well as the overall data collection procedure can be obtained ( 23 ). The data set itself can be downloaded from Geroliminis and Barmpounakis ( 25 ).
In this study, we focus exclusively on vehicles that we can confidently identify to be performing freight operations. In the present data, the only information available for this purpose is the vehicle type. The original data distinguish between two types of freight vehicles: medium and heavy. According to DataFromSky ( 26 ), medium refers to the vehicle classification type Ordinary Goods Vehicle 1, which covers most notably freight vehicles with two or three axles. Heavy refers to the type Ordinary Goods Vehicle 2: vehicles with four or more axles, articulated vehicles, and medium vehicles with a trailer. We expect that the majority of medium and heavy vehicles would be performing freight operations, therefore, both of these vehicle types are analyzed in our study. However, we cannot make statements about vehicles that may have a potential hybrid use, for example, a medium vehicle operating as a minibus or a car delivering freight. With access to local expertise we will be able to match the different vehicle types to specific associated services in future research.
Preprocessing
To prepare the pNEUMA data set for our analysis, we preprocessed the data in four consecutive steps: (i) reshaping the original data for each flight from a wide to a long data format, (ii) reducing the file size to ensure computability by keeping only observations that are 0.16 s apart, instead 0.04 s as in the original data, (iii) assembling all 20 flight data sets into a single data frame, in which single vehicles are uniquely identified by a track-ID and a flight-ID (the same vehicle must not have the same track-ID during another flight-ID), and (iv) segregating information for each vehicle independent of momentary points of time (e.g., vehicle type, total travel distance, average speed).
We are confident that the second step particularly does not alter the results in unforeseen ways as this step simplifies the trajectories and changes the traveled distance by no more than 2 meters in the most unfavorable case (0.12 s × 15 m/s). We find that Flight 8 (file 20181029_dX_0900_0930) deviates substantially from all other flights as it reportes lower traffic volume, most likely the result of a shorter observation period. As the reason for this was unclear, we removed this flight from the sample.
Exploratory Data Analysis
The basic performance indicators and traffic relationships within the data can be found in Barmpounakis and Geroliminis’ orgininal research ( 23 ). Therefore, we do not explore these global indicators further, but rather focus on the multimodal traffic and its associated stopping behavior that might influence network traffic. Figure 3 shows the fractions of observed vehicles and vehicle-kilometers traveled. Note, the same vehicle might have been observed multiple times within the design of the experiment (e.g., segmentation of the monitoring area into ten subsegments). It can be seen that cars constitute the largest fraction of vehicles; buses and UFVs comprise less than 10% of the total. Interestingly, UFVs constitute a larger fraction than buses; in traffic flow modeling, however, the behavior of buses in urban road network modeling receives much more attention (e.g., Castrillon and Laval ( 21 )). Nevertheless, both UFVs and buses are moving bottlenecks that can be modeled (see Muñoz and Daganzo ( 27 )). Another interesting observation from Figure 3 is that the percentages for number of vehicles and vehicle-kilometers traveled are similar, indicating that all vehicle types travel at a similar space-mean journey speed in the network.
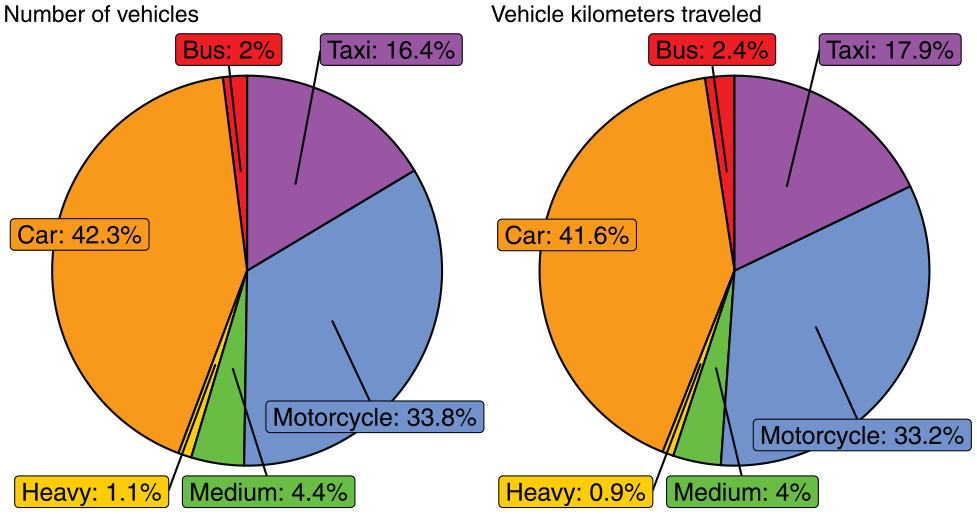
Breakdown of the number of vehicles and vehicle-kilometers traveled in the pNEUMA sample from Athens.
In the following sections, we further investigate the traffic behavior of buses, cars, and UFVs in the network. As stated, in our analysis UFVs correspond to the group of medium and heavy vehicles in the original data, albeit being aware that some freight transport trips might also be undertaken by cars. As we are particularly interested in monitoring and assessing the behavior of UFVs within the urban network, we decided to compare them with two other vehicle types for the following reasons: we compare them with cars because they are commonly considered the reference mode in networks; and we compare them with buses because of their similarities to UFVs, that is, additional stops during a journey that might negatively affect network performance. In Figure 4, we compare the number of stops, the travel time, travel distance, and journey speed of cars, buses, and UFVs; the sample means are presented in Table 1.
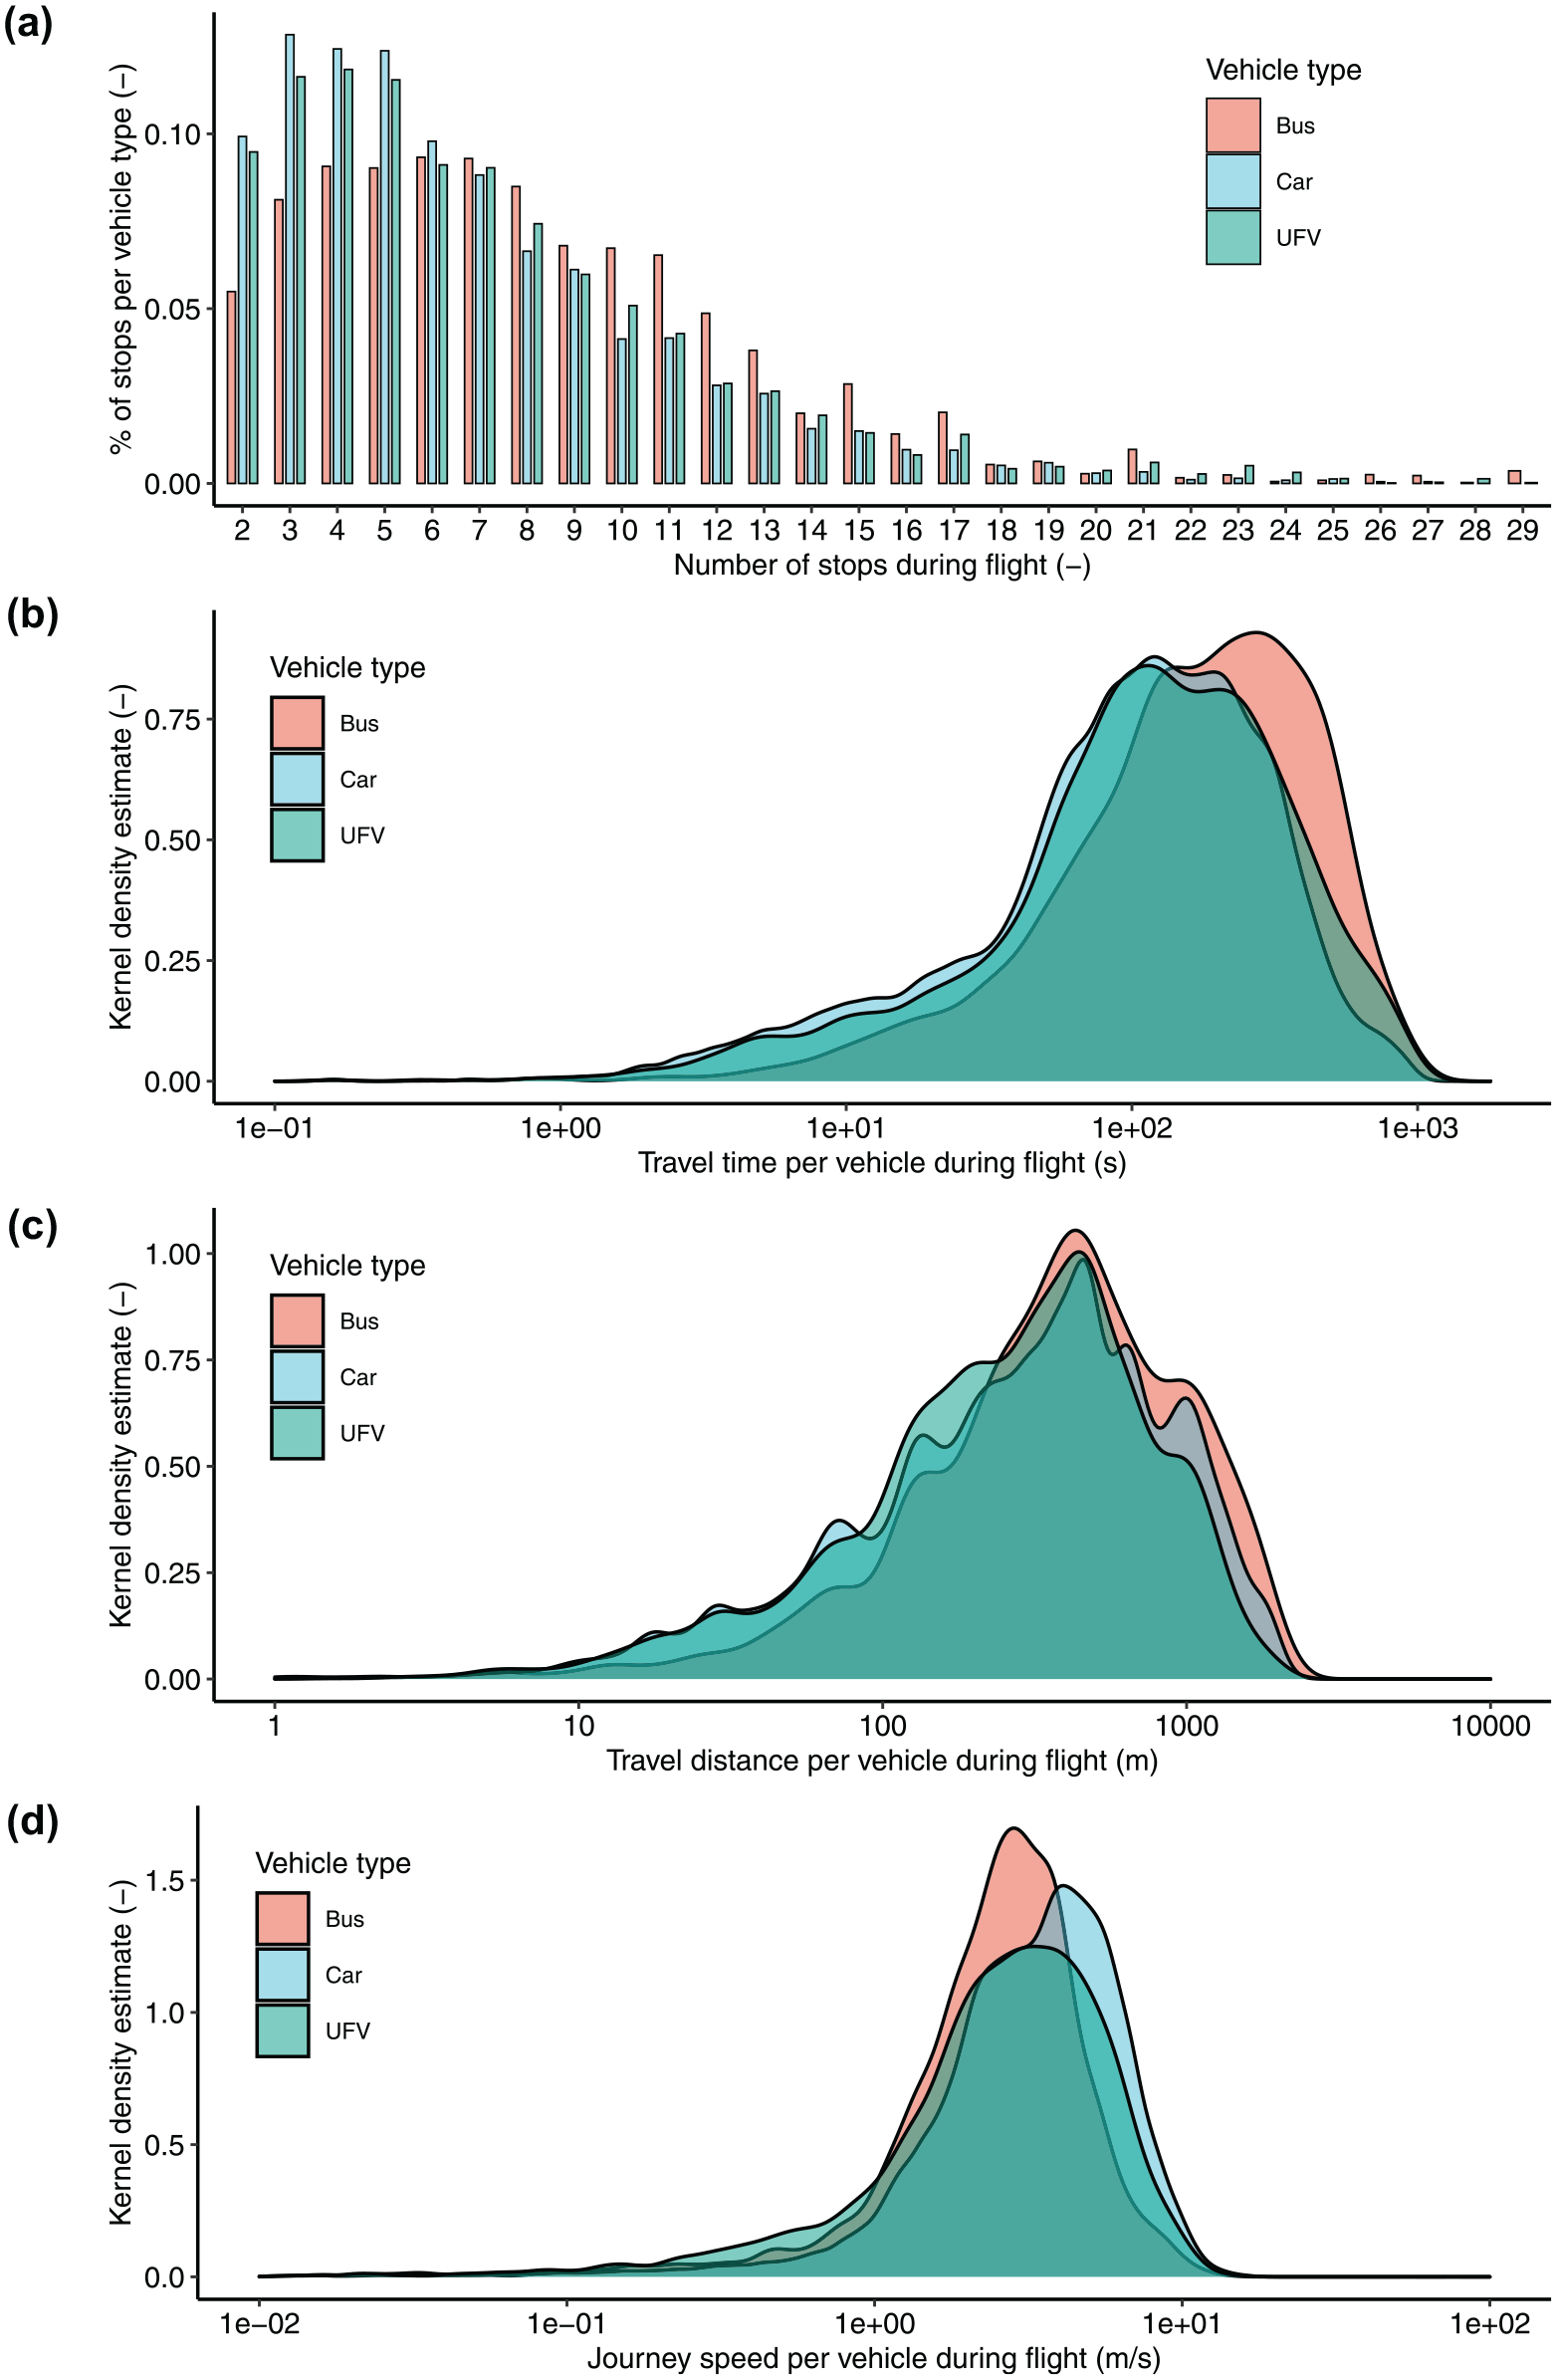
Distributions of study-relevant parameters from the original data: (a) number of stops, (b) travel time, (c) travel distance, and (d) journey speed.
Sample Means of Number of Stops, Travel Time, and Travel Distance for Cars, Buses, and UFVs in the pNEUMA Data
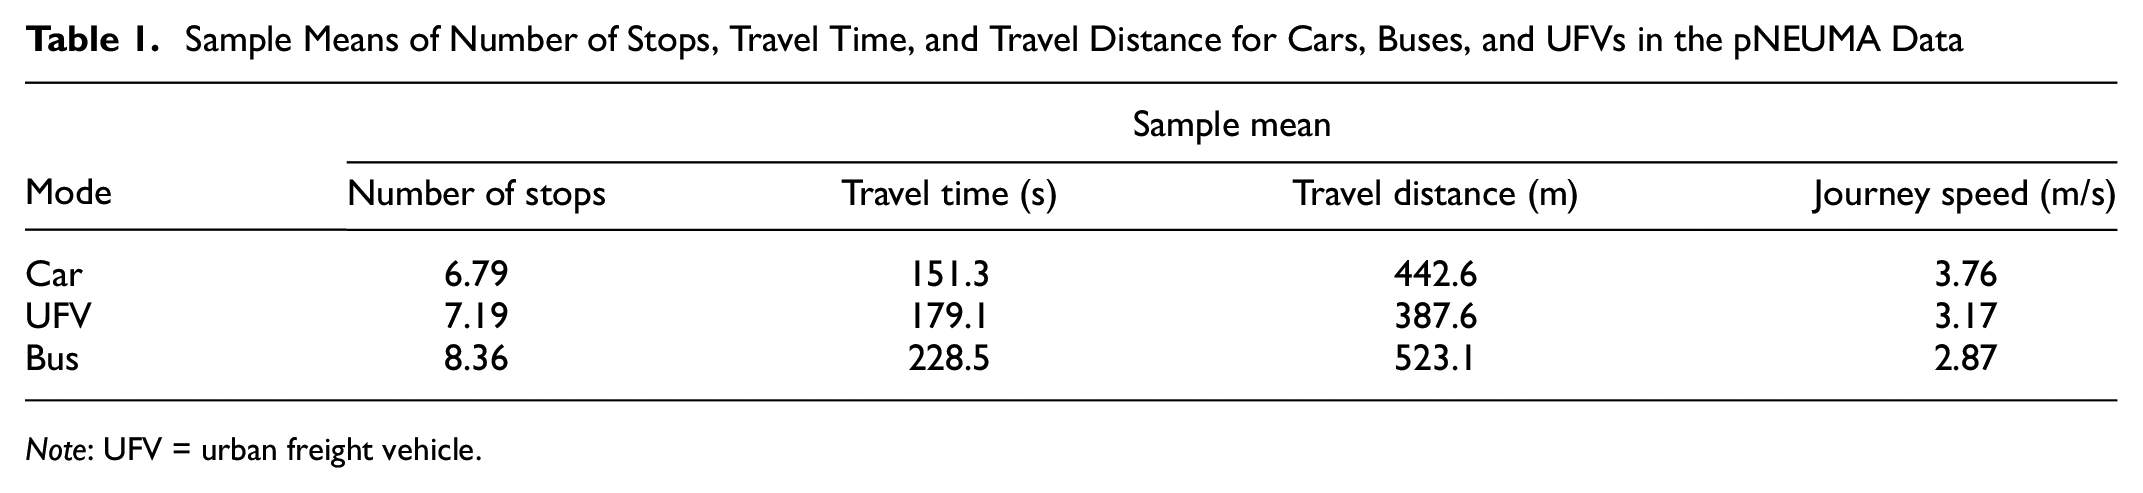
Note
In Figure 4a, we observe Poisson-like distributions for each vehicle type. From Table 1, we can confirm this finding as cars have the least number of stops on average, whereas UFVs stop more and buses stop the most. Note that we consider a vehicle to be stopped when it travels less than 1 km/h. This is intuitive as cars rarely have additional stops apart from traffic- and signal-induced stops. The difference in the number of stops between buses and UFVs suggests that UFVs perform fewer service stops (e.g., for loading and unloading) compared with buses. Figure 4b shows that buses tend to travel longer during each drone flight compared with cars and UFVs. In other words, cars and UFVs tend to begin or end their trip later or earlier than buses, which again is intuitive as buses usually follow a stop sequence that is much longer than the 20 to 30minutes observation period. Conversely, we see in Figure 4c that the trip lengths are very similar, although buses have slightly higher values than cars and UFVs. This can be explained similarly to the travel time findings: many buses are traveling thoughout an observation interval and, compared with cars and UFVs, do not necessarily take the shortest path as their routing is typically aimed at maximizing public accessibility, incoporating predefined routes and schedules instead of minimizing the travel distance. Combining travel distance and travel time, as expected, the space mean journey speeds (Figure 4d) shows that cars have the highest speed and buses the lowest because of more stops that delay the journey. UFVs positioned between the other two, as their number of stops also falls within the two.
We conclude from this exploratory analysis of the data from an urban freight perspective that UFVs perform, on average, more stops than cars, but fewer than buses, which reduces their journey speed in the network. Furthermore, it should be noted that these additional stops within the network would presumably create additional delays for other vehicles in the network as well as for the overall network.
Revealing Urban Freight Vehicle Behavior From Drone Data
We investigate the behavior of UFVs in an urban road network based on large-scale drone data in three consecutive steps: (i) identification of stops; (ii) clustering of all stops to reveal the essential parameters and associated distributions; and (iii) clustering the service stops to reveal different types of services present in the data.
Identification of Stops
The data selected from the pNEUMA data for our analysis reports vehicle movements every 0.16 s. Thus, it is likely that all vehicle stopping maneuvers would be recorded in the data. To characterize stops, we derive three attributes: the stop duration, the distance traveled before stopping, and the number of vehicles (all vehicle types) that stopped within a 5-m radius around the stop location during observation. The latter variable is derived to characterize the stop location, for example, a location with several vehicles indicates proximity to a stop line (e.g., traffic signal), whereas a location with few vehicles might indicate a different location along a link. We define a vehicle to be stopped at a location when it drives less than 1 km/h, stops for more than 2 s, and move more than 2 m between stops; we also require that vehicle to stop at least twice to meet the criteria. The resulting data set contains 232,799 stop observations from which 20,640 could be assigned to medium and heavy vehicles, the two vehicle types that correspond to the UFV fleet.
Clustering of Stops
We use the NbClust package ( 28 ) to determine the optimal number of clusters we would retrieve from k-means when using the attributes stop duration, stop distance, and total number of vehicles at the stop location. This function suggests four clusters as the optimal underlying structure. Figure 5 shows the distributions of the three variables in each cluster and Figure 6 illustrates the locations of all stops by cluster. The cluster means are presented in Table 2.
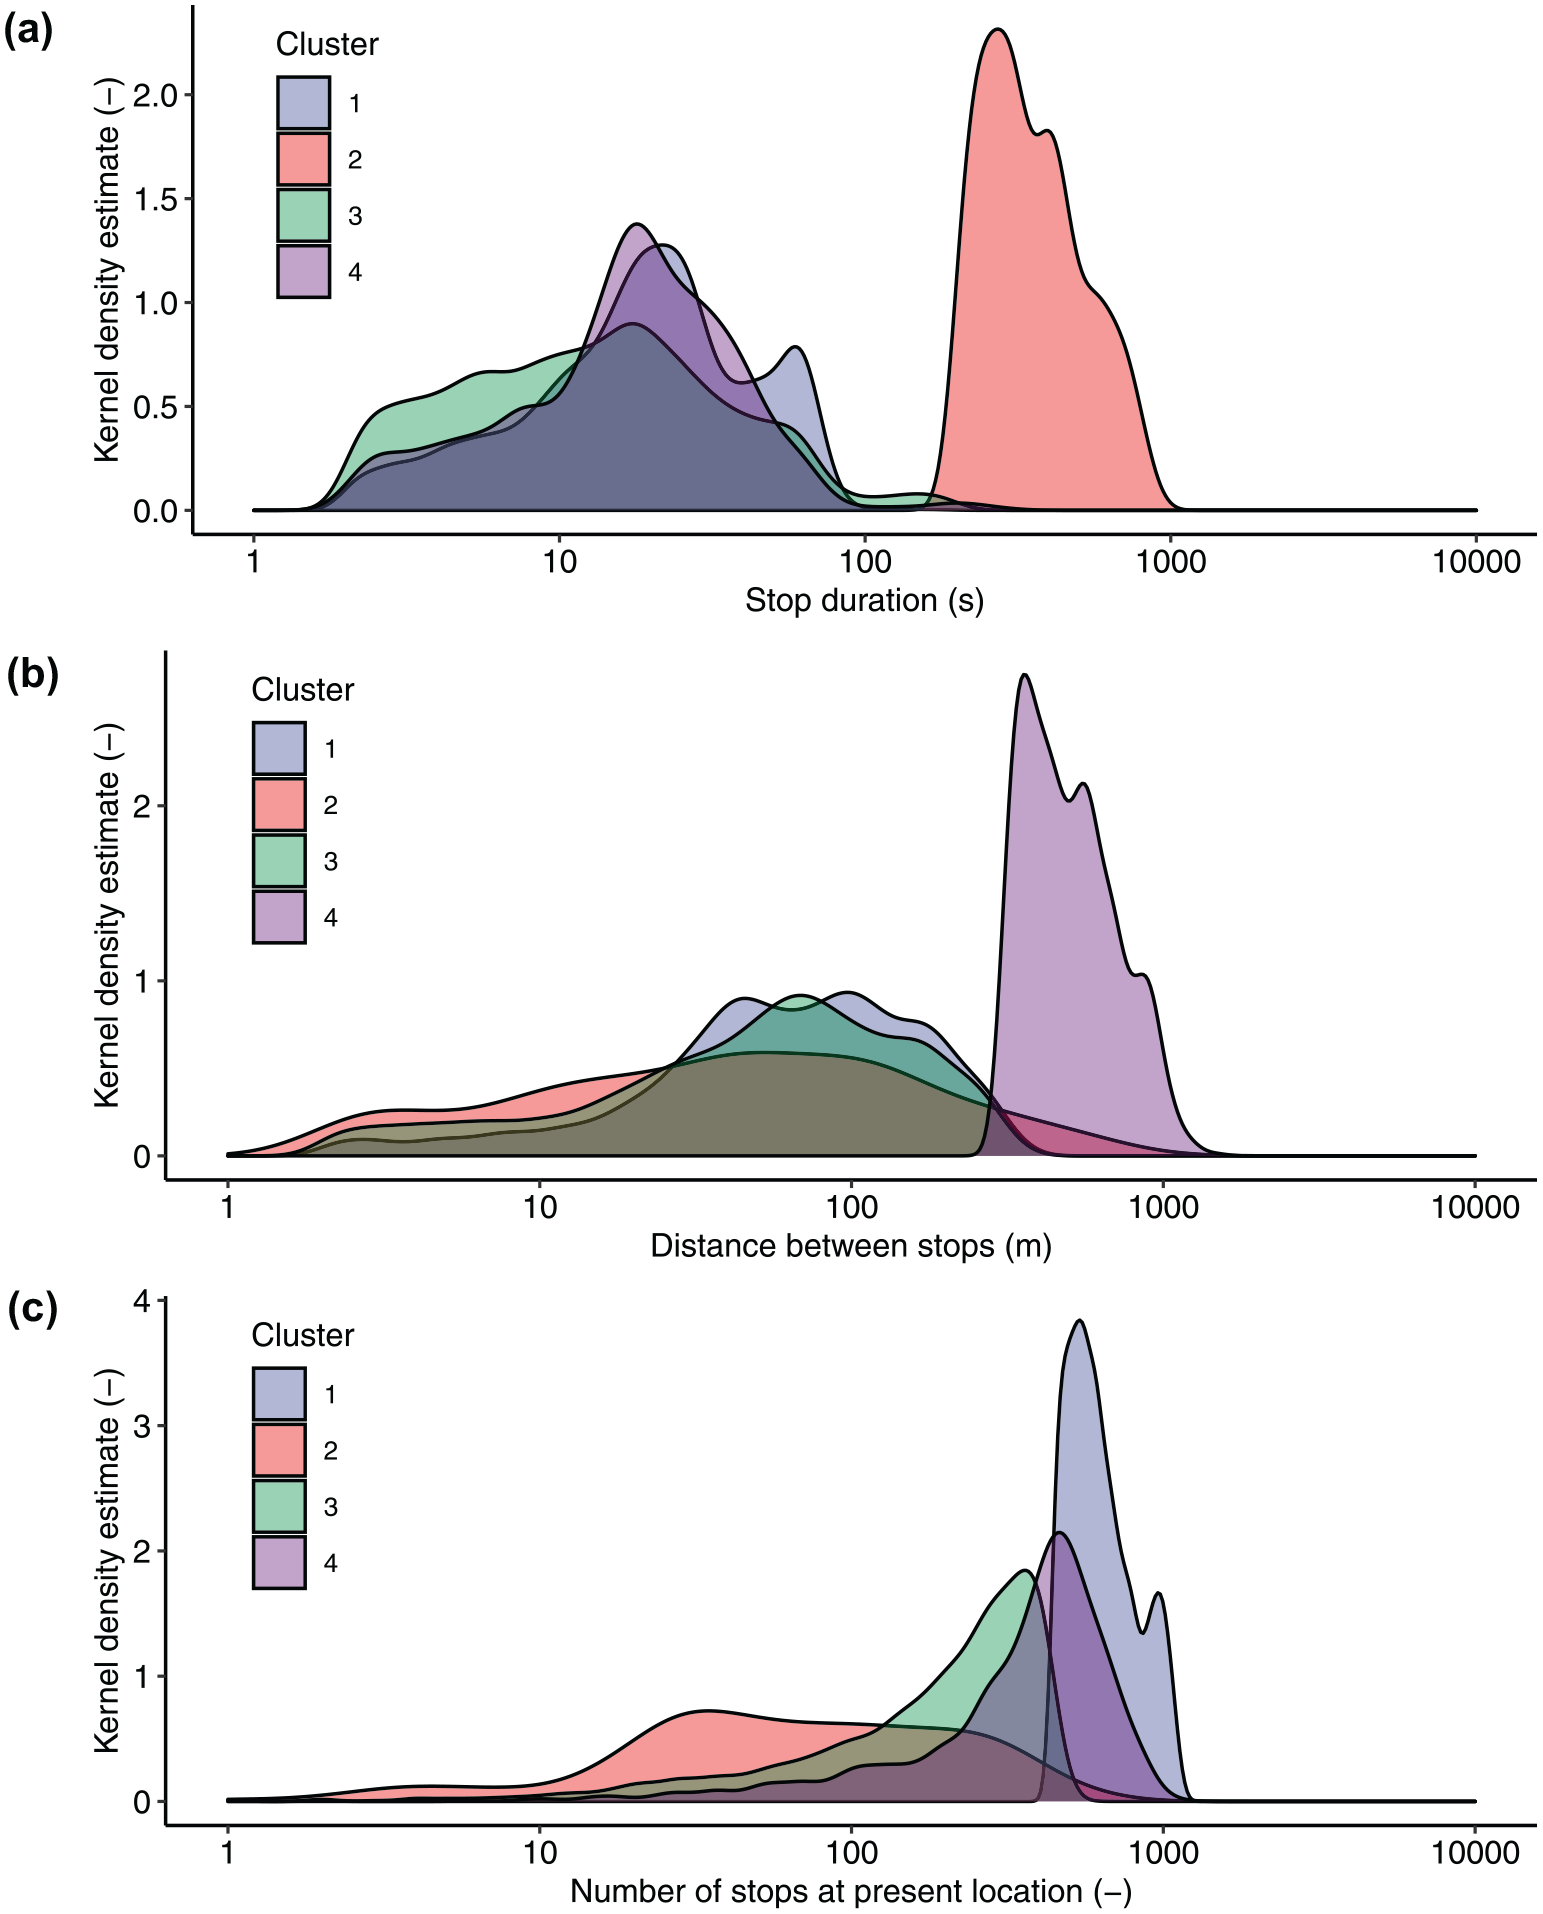
Cluster distributions of (a) stop duration, (b) stop distance, and (c) number of other vehicles stopped at present location.
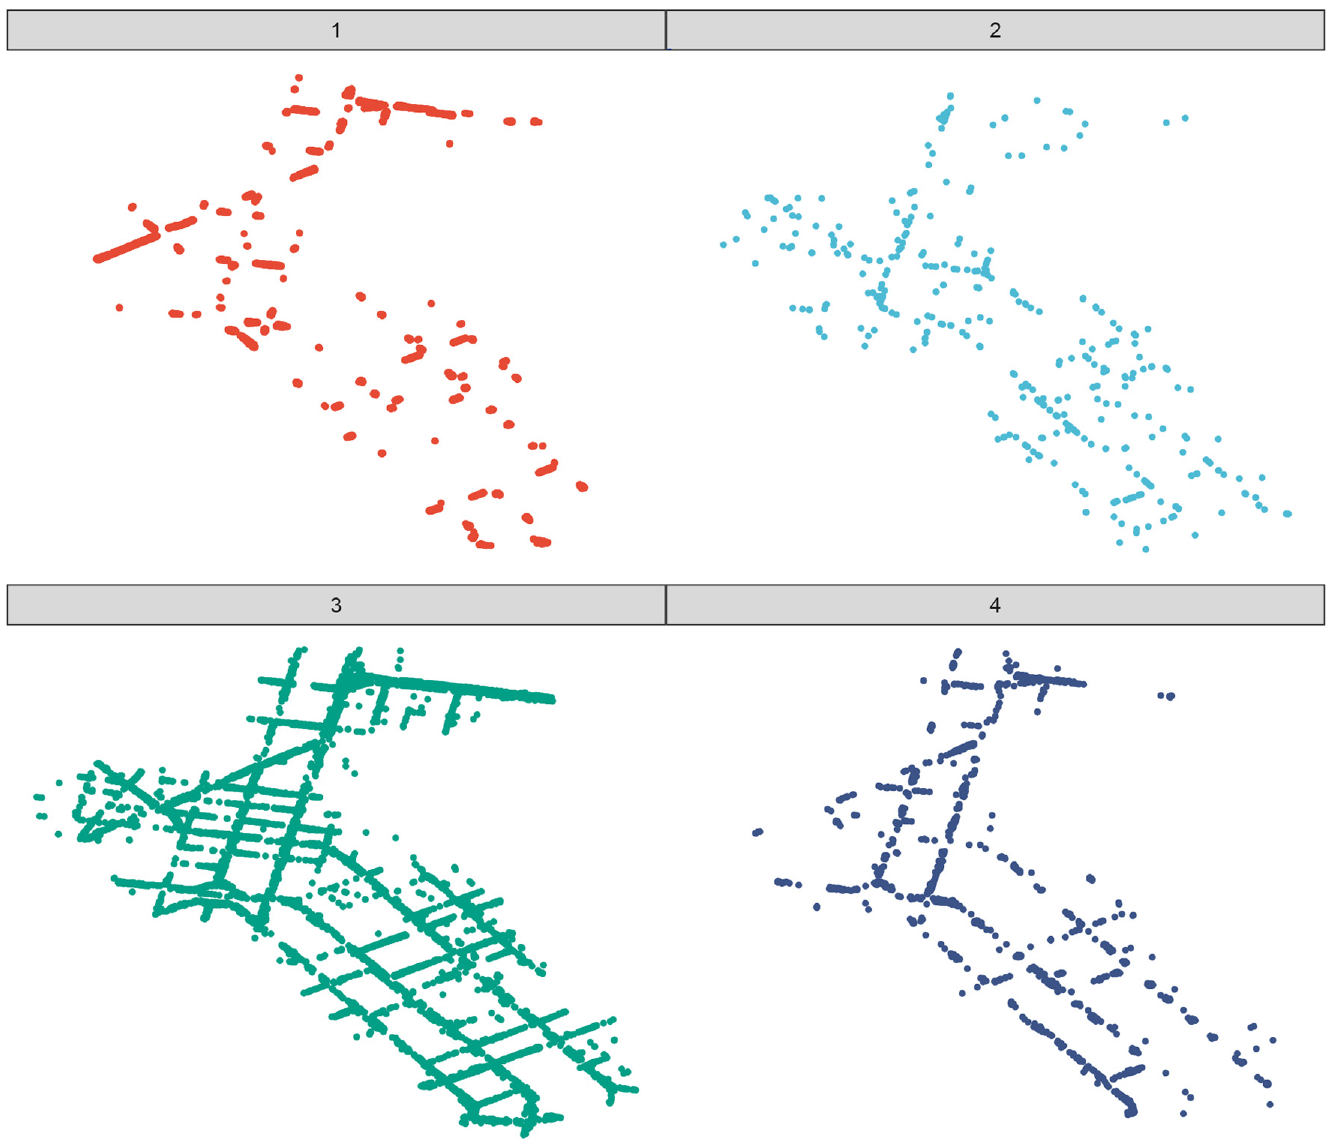
Stop locations of UFVs in Athens by cluster.
Cluster Means for Stop Duration, Stop Distance, and Number of Other Stopped Vehicles
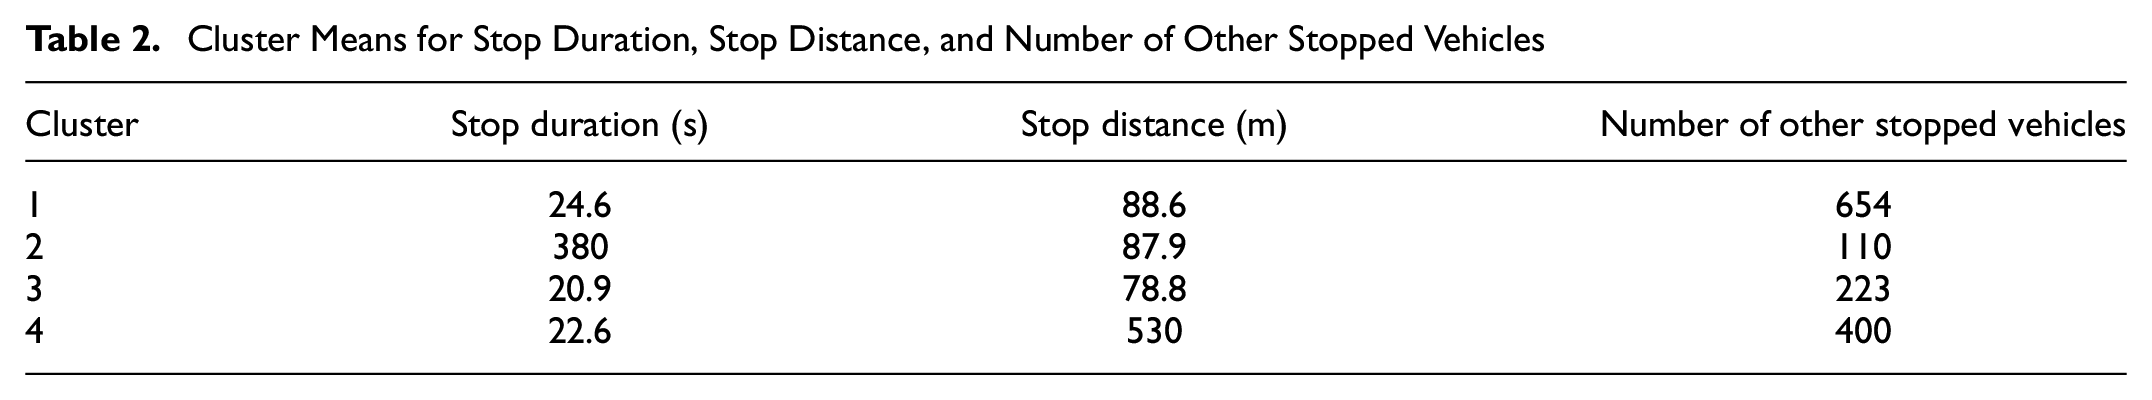
Arguably, we expect that the first- (40% of all stops), third- (50% of all stops), and fourth cluster (8% of all stops) described traffic signal stopsas suggested by the findings from Figure 5. The first cluster seems to describe stops at locations with a higher traffic load (e.g., closer to a stop line); the third cluster shows similar distances and durations as the first cluster, but with fewer other vehicles at the stopping location, suggesting this is describing stops in a queue further away from the stop line. The fourth cluster seems to describe traffic signal stops at main roads where road segments are longer and vehicles might proceed in green waves. We conclude that the second cluster (2% of all stops) most likely corresponds to UFT service stops: longer stop durations, stop distances that covered a wide range, and substantially fewer other vehicle stops at the stop location.
The 394 identified stops from the second cluster contain 364 unique vehicles in which 335 reported one UFT service stop, 28 reported two UFT service stops, and one reported three UFT service stops. Arguably, the short recording time (approx. 20 minutes) during the 30 minutes flight and the comparatively limited monitoring area prevent observing the entire UFV routing graph within the urban area. Figure 7 shows the kernel density estimate of the distances between UFT service stops (not the distances used for clustering as there are too few observations). The distribution has a mean of 111 meters and a standard deviation of 123 meters. In the observed cases, the distances are primarily within the length of a link.
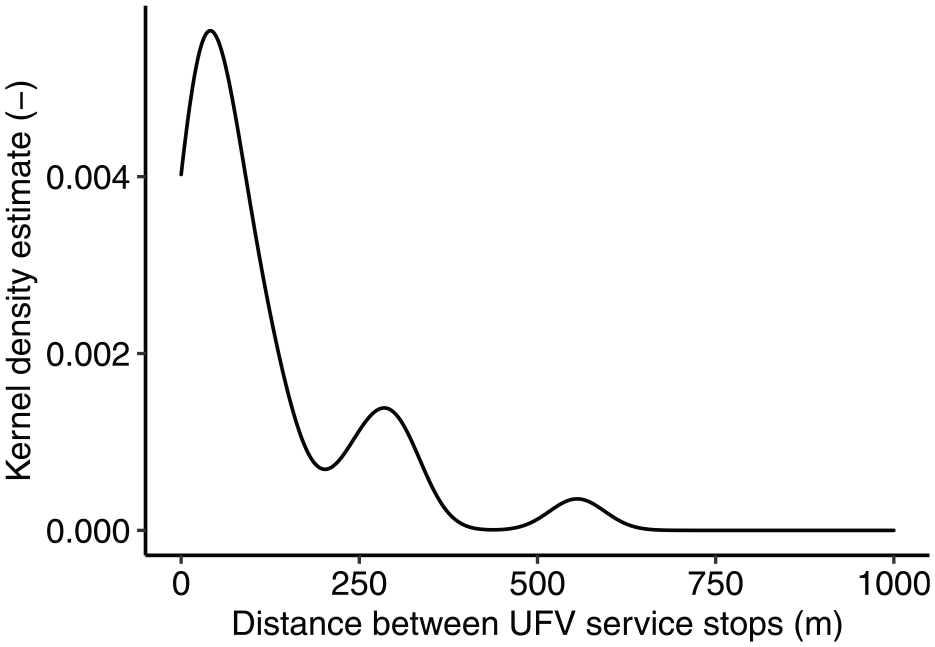
Distribution of distances between two UFT service stops.
Clustering of UFT Stops
We select all likely UFT service stops and repeat the aforementioned procedure. The optimal number of clusters indicated by the NbClust package ( 28 ) is three. Figure 8 shows the distribution of the stop durations and distances between stops that suggest different service types. In the next step, involving local knowledge and expertise to assign specific services (e.g., from different UFT market segments) to each cluster is recommended.
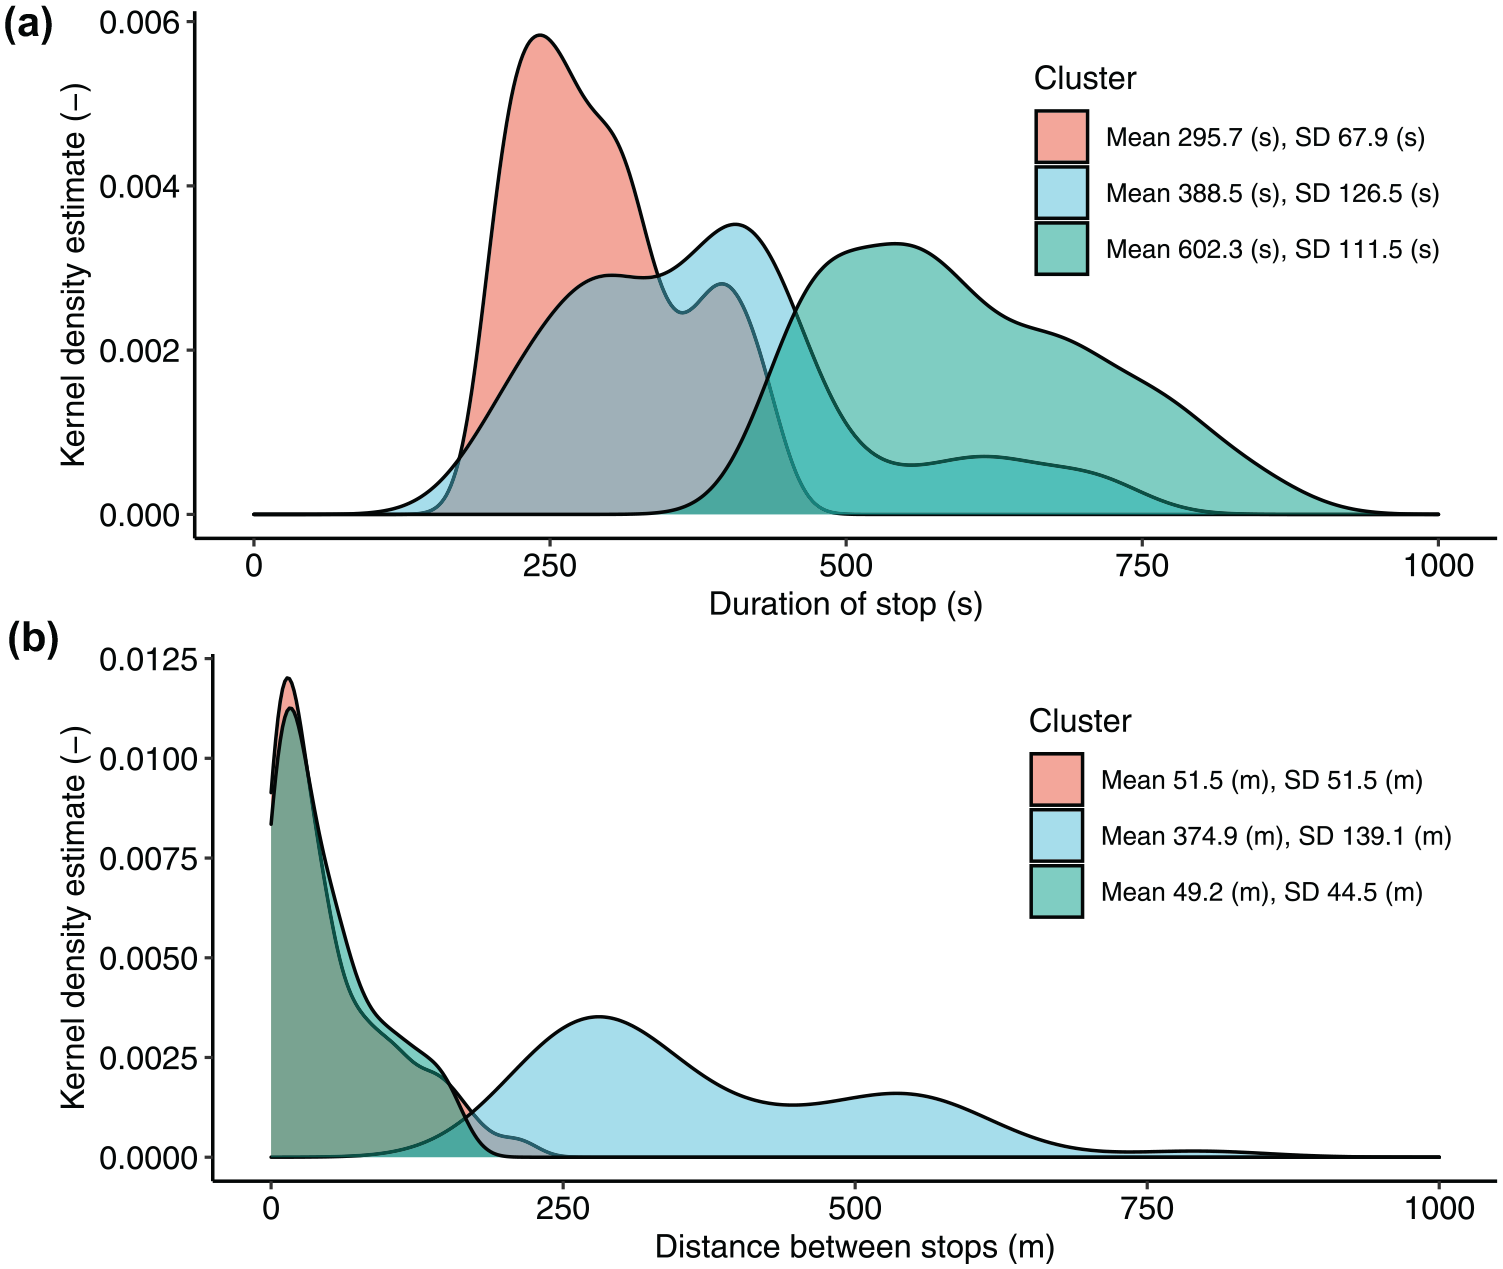
Distributions of (a) stop duration and (b) stop distance for the three UFT service stop clusters.
Conclusions and Outlook
In this study we investigated the extent to which UFV operations parameters can be extracted from large-scale drone data. Usually, network-wide data on urban freight transport is difficult to access for planners and traffic managers, among others, because of heterogeneous interests and a strong competition within the UFT market. From the drone data, we extracted all stops of UFVs. For each stop, we collected the attributes of stop time, distance traveled from the previous stop (i.e., stop distance), and the number of other vehicles that stopped at that particular location during the observation period. Using k-means clustering, we found one cluster that most likely described UFT service stops. Three other clusters characterized general traffic-related stops (e.g., at traffic lights or in queues). Clustering the UFT service stops further showed that at least three different types of UFT services were present in Athens, judging from the analyzed data. Our analysis showed that approximately 5% of all UFVs performed at least one service stop during the observation period. A UFT service stop lasted an average of 380 seconds. As battery capacity limits the drones’ flight time, only a few UFVs reported more than one service stop. In cases where multiple stops were observable, the stops had an average spacing of around 100 meters. These findings add to a list of urban logistics “rules of thumb” for cities in developed countries, as suggested, for example, by Dablanc ( 29 ) and taken up by van der Bossche et al. ( 1 ): (i) 0.1 service stops for loading or unloading operations per person per day, (ii) around 300 to 400 heavy vehicle (lorry) trips per 1,000 people per day, (iii) and 30 to 50 tons of freight per person per year.
Drone data are a comparatively new source for traffic flow analyses. As the initial paper by Barmpounakis and Geroliminis ( 23 ) has shown, standard traffic flow parameters can be obtained at high accuracy from such data (>98%). We have shown that further interesting urban traffic flow parameters can be derived, which are usually difficult to monitor or access and therefore rarely monitored. Our findings could be corroborated by conducting expert interviews or surveys on site, which may also support the wider acceptance of drone data for public sector decision-making. As the cost of drones and video processing are likely to fall owing to decreasing hardware costs and increasing process automation, such drone data-collection procedures could become standard tools for temporary large-scale traffic observations, facilitating municipal decision-making processes.
We conclude that network-wide drone data, as collected in Athens, are a promising data source to obtain information on UFV operations. It is a data collection method that does not require operators to disclose confidential information. With increasing flight times and lower data collection costs, such drone data could be used by traffic planners and managers at large scale to obtain reliable parameter estimates for calibrating models, as well as for use in subsequent decision-making. In addition, as the data comprise observations of all road-based modes, the collection costs could be shared among departments, further lowering barriers to applying this data collection method. Using such a data-driven approach also allows the revealing of white-label vehicles as UFT services, which are otherwise difficult to classify. This new data source consequently offers municipalities the prospect of collecting UFT data without involving market participants, which could encourage other UFT actors to share their data to avoid decision-making based on data that might be disadvantageous for them. Nevertheless, we have to acknowledge that reliable identification of entire UFV routing graphs is currently impossible as complete routes cannot be recovered from trajectory observations within the monitoring areas owing to realizable flight times.
The presented analysis will be extended to give more insights into the behavior of UFVs. This will include testing different clustering techniques as well as adding further (spatial) attributes. Integrating knowledge about local particularities might help to label the different types of service stops revealed from the data, that will allow the development of further applications. For example, with data that span longer periods and consequently reveal more UFV service stops, a mapping of these stops to nearby facilities and points of interest as well as the quantification of land used or consumed by stopped vehicles could add value for decisions on the regulation of UFV operations. Furthermore, we will explore how and under which conditions the stopping of UFVs affects the following traffic, that is, the impact on speed. These results will also be included in traffic flow models (e.g., Loder and Otte (19)), to develop macroscopic models that will inform decisions makers on the impact of UFV operations in their urban network. In addition, we could use the revealed parameters in a microscopic traffic simulator in a larger experimental design to investigate and validate the findings on traffic impact. Finally, we will also continue to investigate which of the revealed effects provide global validity and which are locally specific.
In closing, although UFVs presumably produce more vehicle-kilometers than buses and stop more than cars, presumably obstructing other road users during that process (especially without dedicated infrastructure that exists for buses), they do receive less attention in explicit traffic flow modeling and thus subsequently also in policy making. This study has shown that, with extensive data from which many could benefit, and comparatively simple data analysis, network-wide information on urban freight operations can be retrieved. This could have positive impacts on cost–benefit appraisals and avoid misleading assumptions or inappropriate “gut decisions” in the context of UFT. To this end, this paper emphasizes the need to consider UFVs not only as a dedicated vehicle type, but also as a specific transportation service.
Footnotes
Acknowledgements
The authors acknowledge the support of Yannik Dietz of RWTH Aachen University in the processing and analysis of the original data. Moreover, the authors thank the three anonymous reviewers for taking the time to review an earlier version of this manuscript and for sharing their constructive and fruitful comments toward an improved manuscript.
Author Contributions
The authors confirm contribution to the paper as follows: study conception and design: A. Loder, T. Otte; data collection: A. Loder, T. Otte; analysis and interpretation of results: A. Loder, T. Otte; draft manuscript preparation: A. Loder, T. Otte, K. Bogenberger. All authors reviewed the results and approved the final version of the manuscript.
Declaration of Conflicting Interests
The authors declared no potential conflicts of interest with respect to the research, authorship, and/or publication of this article.
Funding
The authors disclosed receipt of the following financial support for the research, authorship, and/or publication of this article: The authors acknowledge the support from the German Federal Ministry for Digital and Transport (BMDV) for the funding of the project TEMPUS, grant no. 01MM20008K.
Data Accessibility Statement
The data used in this study can be obtained from open-traffic.epfl.ch (pNEUMA).