
Abstract
Through decades of operation, deformation fluctuation becomes a central problem affecting the normal operating of concrete truss combination arch bridge. In order to clarify the mechanism of temperature-induced deformation and its impact on structural stress distribution, this article reports on the temperature distribution and its effect on the deformation of concrete truss combination arch bridge based on bridge health monitoring on a proto bridge with 138 m main span. The temperature distribution and deformation characteristics of the bridge structure in deep valley area are studied. Both of the daily and yearly temperature variation and structural deformation are studied based on bridge health monitoring. Using the outcome of monitoring data, three-dimensional solid finite element models are established to analyze the mechanism of temperature-induced deformation of the whole bridge under different temperature fields. The influence of temperature-induced effect is discussed on local damage based on the damage observation of the background bridge. The outcome of comparisons with field observation validates the analysis results. The relevant monitoring and simulation result can be referenced for the design and evaluation of similar bridges.
Introduction
Concrete composite truss arch bridge is a type of combination bridge structure that first used in China, 1980s. Its upper chords are disconnected at an appropriate position to form a combination structure of two-cantilever truss on the two ends and an arch in the middle. 1 This type of structure could not only reduce the horizontal thrust of the middle arch, but also improve the spanning capacity of the whole superstructure. However, in the past 10 years, partly due to the rapid growth of traffic volume as well as its inherent characteristics, this bridge type has many diseases, and some bridges are even facing demolition. Chen and Du 2 pointed out that there are a lot of transverse cracks in the lower chord of double columns of concrete composite truss arch bridge, which are caused by excessive local tension stress that gives rise to concrete cracking. He and Guo 3 studied the solid web of composite truss arch bridge and found that shrinkage and creep lead to excessive tension stress at the lower edge of the middle and solid web, which leads to transverse penetration cracks. Du summarized and analyzed the main disease characteristics of composite truss arch bridge on the basis of existing research. 4 Scholars such as Li, 5 Niu et al., 6 Li, 7 and Xiao et al. 8 put forward different strengthening measures for existing diseases. For the mechanism of damages, Du et al. 9 found that temperature stress is one of the main causes of diseases of concrete composite truss arch bridges. Elbadry and Ghali 10 observed the temperature field of the prestressing bridge and found that one of the causes of the large cracks was the transverse temperature stress of concrete. Roberts et al. 11 used finite element method (FEM) to analyze the effect of longitudinal and transverse temperature stress on bridge safety under the action of nonlinear temperature gradient, and proposed corresponding rehabilitation configuration methods to limit the generation of temperature cracks. Suzuki et al. 12 found that the surface temperature of prestressed concrete box-beam bridge was higher than that of air during daytime, but opposite at night. Peiretti et al. 13 found four kinds of temperature monitoring data, which can be used to predict bridge deformation. Guo et al. 14 proposed an evaluation method based on probabilistic finite element (FE) to analyze the time-dependent reliabilities of prestressed concrete box-girder bridges with problem of excessive long-term deflection and unexpected cracks. Zhao et al. 15 identified the temperature-induced and train-induced deflections of the bridge girder from deflection data by the wavelet transform. Thermal effects of a long-span suspension bridge were studied by Xia et al. 16 based on 1-year monitoring data under operating conditions. A case study on the temperature effects on cable-stayed bridge using heath monitoring system was presented by Cao et al. 17 Le and Nishio 18 carried out studies on the air temperature effects on the global deformation on a long-span cable-stayed bridge by time-series analysis of global positioning system (GPS) monitoring data. Displacement behavior along longitudinal direction of a jointless steel-truss arch railway bridge was studied in Zhao et al. 19 using the empirical wavelet transform of monitoring data. Based on results of field tests and three-dimensional (3D) FE models with various physical parameters, Moazam et al. 20 studied the frequencies and effect factors such as number of spans and span length on the railway concrete arch bridges. Yazdani et al. 21 proposed a semi-analytical method to predict the rates of energy release and consequent media simulation. Because of the particularity of the concrete truss combination arch (CTCA) bridge, temperature-induced deformation law is obviously different from that of ordinary hingeless arch bridges, which forms new arch foot at the expansion joints in the bridge deck. The purpose of this article is to fill the gap in the study of temperature-induced deformation monitoring and its influence on performance of concrete truss combination arch bridge. The sensor distribution and monitoring system setting is presented in the next section followed by the analysis of monitoring data and the deformation and temperature distribution from the point of view of daily temperature difference and annual temperature difference. Then, 3D FE model simulation is carried out to study the mechanism of temperature effect and validate the observation of the bridge damage. A summary of main findings of the bridge health monitoring (BHM) analysis and mechanism is given in section “Conclusion.” Issues related to verification of the 3D FEM are presented in Appendix 1.
Sensors and monitoring system
The proto bridge
The total length of the proto bridge is 178 m, and the span arrangement is 14 m+138 m+10 m+2 × 8m. The main span of prestressed CTCA bridge is 138 m. Lower chord follows quadratic parabola line shape and has a rise-span ratio of 1/6 and a rise-height of 23 m. As the elevation of structure shown in Figure 1, the west side part is a fixed end beam with a span of 14 m and the east side is a continuous rigid frame with three spans (10 m+2×8 m). The rigid frames are designed as prestressed members which provide the substantial support for the cantilever part, and consolidated with abutment and also fixed to the piers. The middle part of the main bridge uses box-section structure with variation depth. The overall longitudinal slope from west side to east side is 3%. The bridge consists of two separate bridges for two-way traffic with a width of 11.75 m per direction. All of the vertical chord, oblique web chord, and lower chord use box-shape section, and the geometry scale and the external dimension of the section detail are listed in Table 1. The design live load is grade Car-20 based on the standard 22 used in the time of construction.

Elevation of the proto bridge: (a) structural geometry scale (unit: m), (b) photo of actual bridge, and (c) detail of new arch foot.
Geometry and section scale of the proto bridge.

Unlike common concrete truss bridge, the proto bridge studied in this article has two expansion joints in its upper chord, which divided the superstructure into three parts as follows: the cantilever truss on the two sides and the new arch in the middle part that supported on the ends of two side cantilevers.
Sensor arrangement
The construction of the left proto bridge was completed in September 1999 with a temperature of about 15°C; the right bridge was completed in June 2000 with a temperature of about 20°C. The bridge was opened to traffic in December 2000 and BHM system was installed in 2007. The BHM system is composed of field testing system, data transmission system, and data processing and safety assessment system. As the basic part of data acquisition, the bridge arch has 101 measuring points, including 66 static, 32 dynamic, and three environmental measuring points. In this article, we limit our attention to the related parameters of temperature-induced deformation. Sensors 771018, 771012, 771011, 771004, and 769204 are used to measure the deflection of the key position of bridge deck west direction, which reflected the deformation of “Foundation – west,”“New arch foot – west,”“Mid-span,”“New arch foot – east,” and “Foundation – east,” respectively. And the ambient temperature is measured by a separate sensor 174411 that independent from the structure. JMZX-212AT and JMZX-210AT type sensors, corresponding to points 1–24, are used to monitor structural temperature and strain, which were arranged on the lower chord, vertical chord, and oblique web chord. The arrangement of sensors is shown in Figure 2.

Distribution of the sensors.
Yearly temperature
The annual temperature change trend of structure temperature is similar to that of environment temperature, but the range of structure temperature variation is more obvious. As shown in Figure 3, the main manifestation is that the low temperature value of structure is slightly higher than the minimum value of environment. The high temperature value of structure is larger than the maximum value of environment. The annual temperature variation trend of chord, vertical chord, and oblique web chord is the same. The annual temperature change of the lower edge of the mid-span solid arch rib is the most gentle and around the average temperature: in winter, it is slightly lower than the average temperature of structure members, and in summer, it is slightly higher than the average temperature of the members.
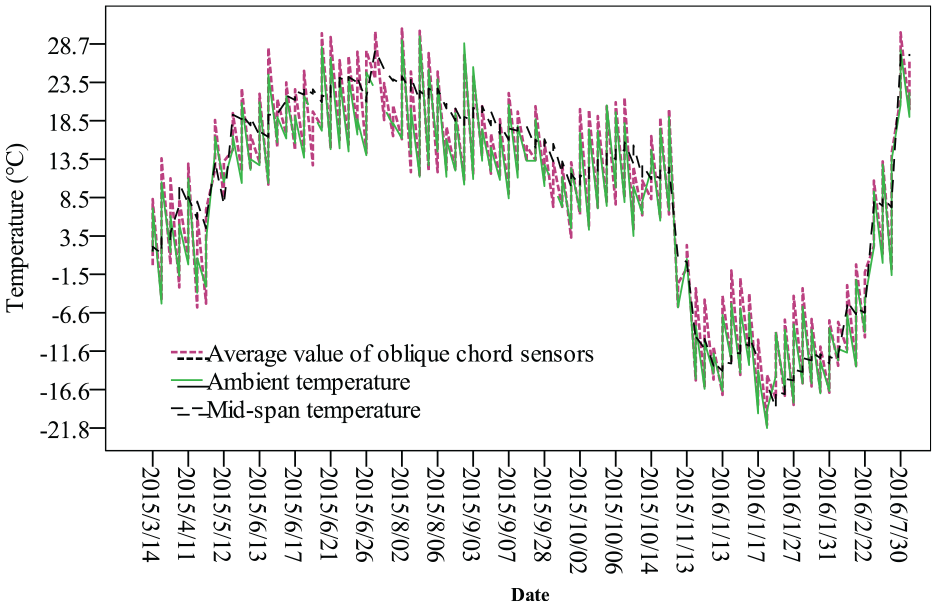
Temperature variation in long term.
Temperature-induced deformation
Using sensor data on 22 June 2015 and 15 January 2016 as the representative value of the summer and winter deflections, respectively, and taking the deformation of the bridge deck at 00:42 and 00:11 a.m. as the initial base value for the two representative samples, the relative deformation of the bridge deck is illustrated, as shown in Figure 4. The deformation of mid-span deck is significant compared with location of foundation and new arch foot. Based on the same temperature variation, the upward deformation of summer is 5.4 mm that is more sensitive than that 3.4 mm of winter.

Representative value of daily temperature variation: (a) summer, 22 June 2015 and (b) winter, 15 January 2016.
Six representative dates in different seasons are selected for yearly comparison as shown in Figure 5. The deflection of the bridge deck from foundation to one-fourth span (L/4) is not obvious; by contrast, the deflection of the structure between L/4 on the west side and L/4 on the east side changes significantly. Especially, the deflection of the mid-span decreases with the increase of temperature from January to July, and the deflection changes by 7 cm. However, CTCA bridge behaves an obvious M-shape deformation in the winter and the deflection of arch crown can reach 9∼10 cm compared with deck level, which is around the construction closure temperature 20°C. The theoretical value of temperature-induced deformation of truss combination arch bridge is linearly with the temperature, which the crown deflects by about 3.0 cm for the temperature decreasing 10°C. While the temperature-induced deformation of the bridge deck from foundation to new arch foot is small, the deck deflects by 0.1∼0.3 cm with the temperature decreasing by 10°C. Field investigation shows that because the concrete structure is located in the deep valley area and the altitude difference of structural member is large, when the ambient temperature changes, the temperature change of the structure is not constant, and the temperature-induced deformation also varies.
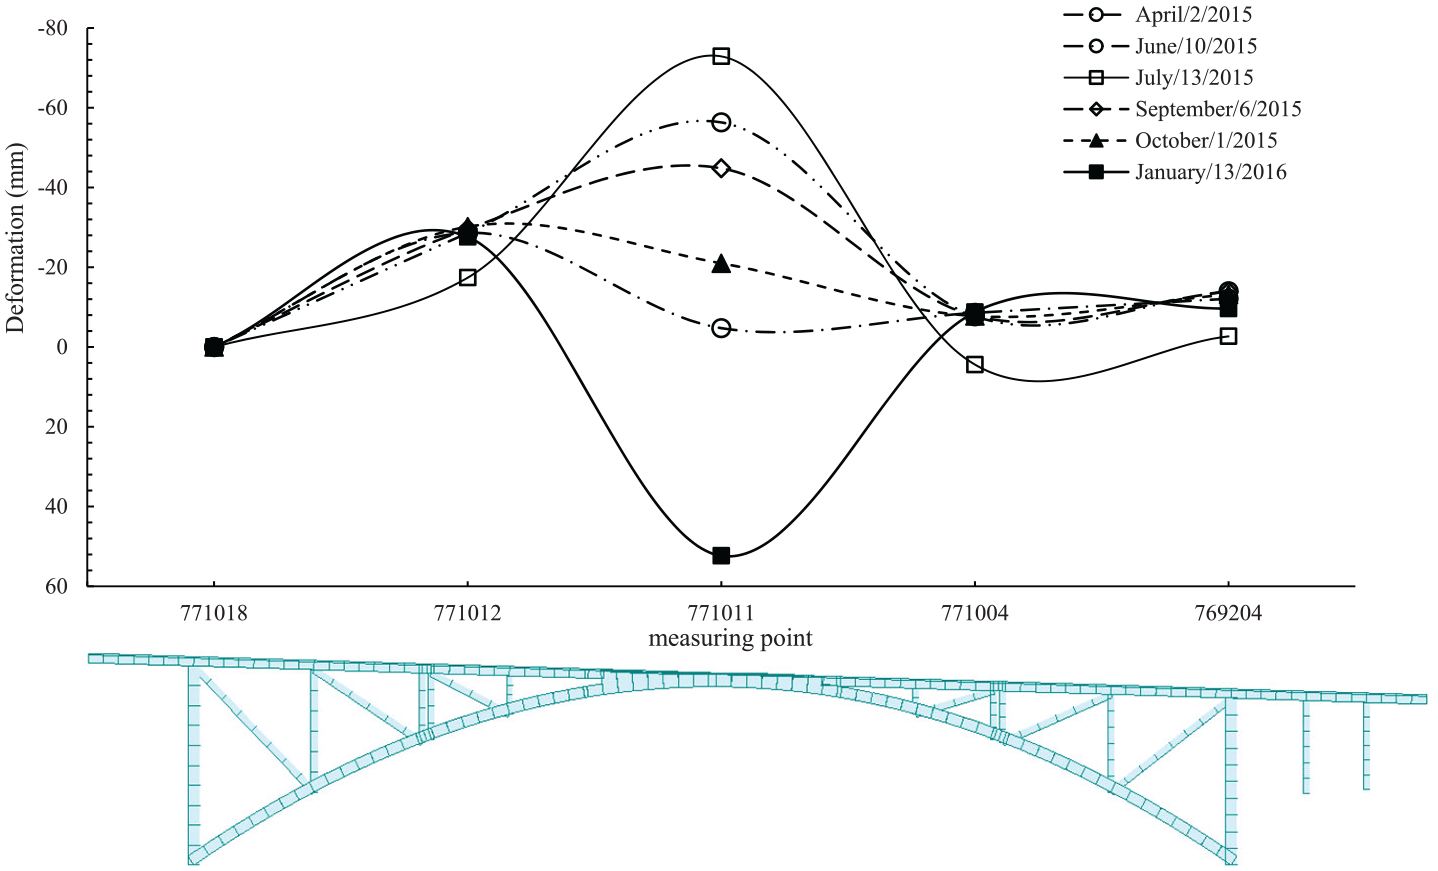
Deck alignment comparison.
FE simulation and analysis
FE model
In order to translate the mechanism of deformation and assess the corresponding stress caused by temperature variation, FE analysis is carried out in this section. For structural analysis from a macro point of view, one-dimensional (1D) planar FEM still plays an important role to give the result of internal force, planar deformation, which is consistent with the design code and convenient for the structural design. However, when the local stress is the main object of study to be focused on, using 3D FEM is necessary to consider the spatial effect of large section and complicated structural junctions, especially for the concrete element. 3D FEM with solid element was applied widely in both of static and dynamic structural property analyses for full-scale concrete bridges.20,23,24 In this study, in accordance with the actual bridge, FE models are established using solid element to analyze the overall and local stress of concrete truss arch bridges. As shown in Figure 6, the X-direction is the longitudinal direction of the bridge, the Y-direction is the vertical, and the Z-direction is the lateral; the two ends of arch foot, pier column, and bridge deck are fully fixed. The model includes two parts: the main concrete bridge and the prestressing tendons. The concrete is C50 and the design strength of prestressing force is 1860 MPa. The 3D FE model is conservatively considered by combining artificial optimization and automatic meshing and the longitudinal mesh size of the 3D FE model is controlled within 0.3 m; consequently, the 3D FE model built in this study consists of 129,068 concrete elements and 4440 prestress tendon elements using software package ABAQUS. The element types of concrete and prestress tendon are solid element C3D8R and 3D truss element T3D2, respectively. The interaction of embedded region is used to constrain the combination between the prestress bars and the concrete. In order to keep balance between the simulation outcome and computational costing, nonlinearity is not considered in this study and the cracks were indicated indirectly by checking whether the principal stress exceeded the design strength of the concrete, and the propagation process of crack was not considered. A verification of the 3D FEM compared with theoretical result on a cantilever beam is illustrated in Appendix 1. More subtle simulation can be referenced to relative study.14,21 Using the practical method of this study, the simulation can be carried out efficiently on a personal computer, for example, the simulation of Case 1 to Case 3 mentioned in the remained part of this section can be completed in no more than 30 min on Lenovo portable workstation equipped with quad core CPU of i7-4700MQ processor and 16 GB random access memory (RAM).

FE model: (a) concrete section and (b) prestress tendon.
The external load mainly includes two parts: prestressing load and non-uniform temperature field. The heat conduction process is not considered in this study. The permanent effect stress of the prestressing tendon is 1200 MPa. The material parameter setting of FE model is listed in Table 2.
FE model parameter.

The initial temperature field of the model is 0°C, and the thermal effect is applied to the model according to the measured temperature curve. The stress characteristics of the prestressed concrete composite truss arch are analyzed. Comparing the linear characteristics of temperature-induced deformation and stress distribution under the action of overall temperature rise, fall, and uneven temperature field, the calculation is divided into four cases:
Case 1: uniform temperature field −30°C.
Case 2: non-uniform temperature field −29°C∼−32°C (from bottom to top).
Case 3: non-uniform temperature field −32°C ∼−29°C (from bottom to top).
Case 4: temperature field −30°C and self-weight effect.
All of the four cases include the prestressing effect and the default initial temperature field of the model is 0°C. According to the measured temperature curve, the cooling effect of the model is applied to the model, respectively. Because the winter temperature at the bridge site is generally in the vicinity of −15°C and the temperature difference is about −30°C compared to the temperature when the bridge completed the closure, the uniform temperature field of −30°C is set to study the 3D stress state of concrete in Case 1. And based on the observation, a difference of 3°C was find from the arch crown to arch foot, which in the daytime, temperature decreasing gradient is from the arch foot to arch crown, and in the night, the temperature decreases from the arch crown to arch foot. Case 2 simulates a temperature drop at the bridge site at night of which the temperature decreases from −29°C to −32°C from the arch foot to the bridge deck; Case 3 analyzes a temperature drop at the bridge site during the day that the bridge deck temperature is slightly higher.
There are six steps set in total to consider different load combinations for the FE analysis in the model of Case 1 to Case 3: Step 1, self-weight; Step 2, temperature decreasing of concrete by −20°C; Step 3, temperature of prestress tendon decreasing by −30°C; Step 4, temperature of both of prestress tendon and concrete decreasing by −30°C (Case 1); Step 5, temperature of prestress tendon decreasing by −30°C and uneven temperature field −29°C∼−30°C (from bottom to top) applied on concrete (Case 2); and Step 6, temperature of prestress tendon decreasing by −30°C and uneven temperature field −32°C∼−29°C (from bottom to top) applied on concrete (Case 3). Step 1 and Step 2 are used to qualitatively judge the correct direction of the load. And Step 3 is used to check the effect of temperature decreasing on the prestressing; the result shows that the effect is small and negligible. Another model was utilized to consider dead load, prestressing effect, and temperature effect (Case 4) and validate the observation of the cracks.
FE result of temperature effect
The result of deformation of Case 1∼Case 3 is shown in Table 3, and the location of 15 observation points is shown in Figure 7. When the temperature changes, the bridge deck alignment of the concrete composite truss arch bridge takes the upper chord of the new arch foot as the peak point of wavy. The temperature-induced deformation of the bridge deck corresponding to the main arch ring is M-shaped. For long-span CTCA bridge, new arch foot and the double columns above it play an extremely important role in the temperature-induced deformation. It is noticed that under the action of non-uniform temperature field, the overall deformation of long-span concrete composite truss arch bridge deck is similar to that under the action of overall temperature rising and falling, and the deflection difference of each point is less than 3 mm. Deflection of mid-span computed by FEM shows good agreement with the observation that the deflection rate is 9.7 cm/3 = 3.23 cm per 10°C. The variation between the FE result and BHM data could be due to: the randomness of the material of actual bridge; the FE model takes account the prestress tendon but neglects the effect of reinforcement rebar; the effective prestress assumed may not completely reflect the actual condition and the contribution of the pavement to the structure is not considered. These factors may cause a smaller rigidity and thus make the result of deflection more significant.
Deformation of deck (unit: mm).


Deformation shape and computing points.
The simulation results of stress from Case 1 to Case 3 indicate that a temperature gradient of 3°C on a base of −30°C uniform temperature field has less effect on the deformation and stress no matter the temperature decreasing from arch crown to foot or from arch foot to the crown. And that means for the disadvantage condition of CTCA bridge, the overall temperature field is critical for the structural safety. Engineer should pay attention to the temperature drop especially in cold winter day. Besides, there is still some difference: the gradient of decreasing from arch foot to arch crown is the most adverse showing that the arch crown is more sensitive to the cooling effect. Because the contour figure is similar, only Case 3 for temperature effect is shown in the reminder of this section. There is no direct specification of the limit for the thermal induced deflection, but long-term deflection limit is suggested, for example, in Chinese standard,
25
if mid-span deflection is bigger than 1/1000 of span length
The 3D stress of long-span concrete truss composite arch bridge under uneven temperature field (Case 3) is shown in Figure 8. The stress along the bridge is mainly in tension. The critical section of concrete is the lower edge of mid-span box-girder section and the upper edge of lower chord of double columns above the new arch foot. Vertical stress under non-uniform temperature field basically meets the allowable value of concrete stress. Under the action of temperature gradient, concrete stress is still within the allowable range. However, it is noteworthy that the local tension–compression bonding of the lower chord of double columns makes the stress complex and partly exceeds the ultimate tensile strength of concrete, which is easy to cause concrete cracking. Under the decreasing temperature effect, both the new arch foot of the main arch rib to the middle of the span and the bridge deck deflects. The inner vertical chord of the double columns inclines to the middle of the span. And the outer vertical chord basically keeps upright, which results in the concrete tension at the junction of the double vertical chord and the lower chord. At the same time, the oblique web chord was pulled, which drives the new arch foot of the main arch ring to camber upward, thus the lower end of the outer vertical chord of new arch foot was compressed. Correspondingly, there were many cracks in the lower chord of double columns and double columns. Also, cracks in the middle of the double columns were observed (field observation is shown in the next section).

Effect of temperature decreasing on the stress distribution: (a) mid-span, (b) lower chord, (c) new arch foot, and (d) fixed ends.
The transverse stress of the bridge under non-uniform temperature field basically meets the requirements, but the local tensile stress at the end consolidation of the arch foot and the bridge deck exceeds the standard tensile strength of concrete, which easily leads to transverse penetrating cracks under the action of temperature gradient. As shown in Figure 8(d), region around fixed ends of excess stress can be identified from contour of principal stress; then by comparing the axial stress of different directions, the transverse stress (S33 in FE model) contributes the main part of the fixed ends stress, which indicates under the temperature decreasing effect, the fixed ends restrain the concrete from shrinkage in transverse direction and the resulting stress cannot be neglected.
Field observation and validation of FE simulation
According to the appearance checking of mid-span part, cracks include as follows: (1) longitudinal cracks were found on the right web of the solid abdomen (30 cm long and 0.08 mm wide) (Figure 9(a)); (2) oblique crack (30 cm long and 0.14 mm wide) was found on the web plate (Figure 9(b)); and (3) longitudinal crack (50 cm long and 0.1 mm wide) across the middle floor of the mid-span segment (Figure 9(c)).

Cracks of mid-span box-section segment: (a) longitudinal web cracks, (b) inclined web racks, and (c) longitudinal floor cracks.
The simulation result of this section is based on the load combination of dead load (self-weight), prestressing load, and temperature field (Case 4 in the section of FE model). The principal tensile stress of the lower edge of the mid-span solid web section is much larger, which exceeds the standard tensile strength of concrete and easily causes concrete cracking. As shown in Figure 10, under the action of temperature, self-weight, and prestressing force, the positive bending moment occurs from the double columns to the middle of the span, which results in the local axial tensile stress of the mid-span floor that is relatively large to form cracks. From Figure 10(a), one can identify the prominent principal stress appears around corner of box-shape segment and the middle part along the central line. And we can find from Figure 10(b), the large corner principal force mainly comes from the longitudinal force that is consistent with the positive shear lag effect on the box-shape section, and from Figure 10(c), region around the central line of bottom floor appears transverse stress exceeds the concrete strength, which contributes to the longitudinal cracks of the floor plate. There is a jump of shear force at the junction of hollow and solid web in vertical direction of bridge, which leads to the excessive local vertical shear stress at the junction. By contrast, the stress distribution in the transverse bridge direction is more reasonable.

Stress distribution of mid-span segment: (a) principal tensile stress, (b) longitudinal stress, and (c) transverse stress.
For the new arch foot part, there are three longitudinal cracks on the top plate of box-section rib, which are about 2.5–3 m in length and 0.15 mm in width (Figure 11(a)). As shown in Figure 12, the principal tensile stress of the upper edge of the lower chord section of double columns exceeds the standard tensile strength of concrete, which easily leads to concrete cracking. Under the action of prestressing and temperature, the inclined web chord is in the compressive state along the bridge and drives the new arch foot to deviate from the inclined web chord, which results in the compression of the lower edge of the section of the new arch foot and the tension of the upper edge of the section, so the top of the adjacent chord is prone to crack. From the aspect of vertical stress, the composite truss arch bridge under the combined action of loads has relatively large shear stress at the new arch foot, which is prone to cause shear failure, the transverse stress state of the bridge is more reasonable, and the crack resistance of the concrete at the joint is relatively weak.
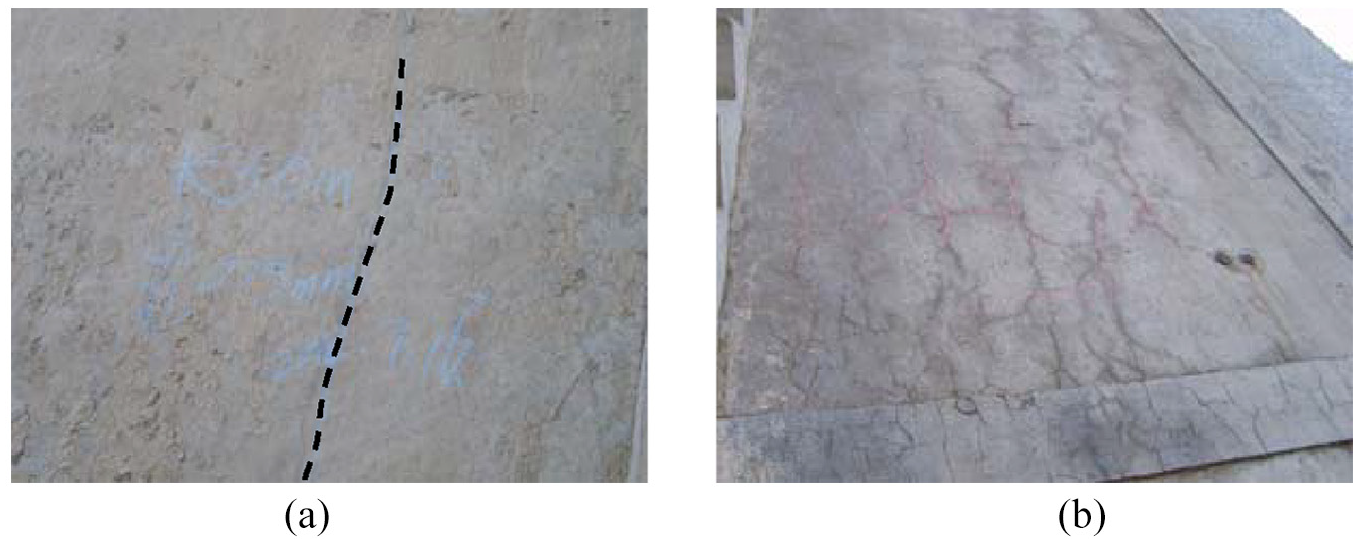
Cracks on arch rib: (a) longitudinal cracks on arch rib and (b) fixed end of arch foot.

Stress distribution around new arch foot: (a) principal tensile stress, (b) longitudinal stress, (c) vertical stress, and (d) transverse stress.
For the fixed end, there are reticulate cracks at the arch foot (Figure 11(b)) of the right main arch ring with an area of 3 × 2 m2. The possible mechanisms of the cracks are as follows: the local concrete tensile stress of the small box-girder on both sides of the vertical bridge consolidation end is large enough to form local vertical cracks. The stress of the concrete at the end of the transverse bridge exceeds its standard tensile strength and is liable to form transverse penetrating cracks as shown in Figure 13. Therefore, under the combined action of loads, it is easy to form retiform cracks at the arch foot consolidation. For the cracks, the limit of width is 0.3 mm for transverse crack and 0.5 mm for longitudinal crack; the limit of crack length is 1/8 of section scale for judgment of normal service according to the evaluation standard. 25 Based on these regulation limits, the proto bridge is still within the normal service state, but close attention should be paid to extremely low temperature in winter.
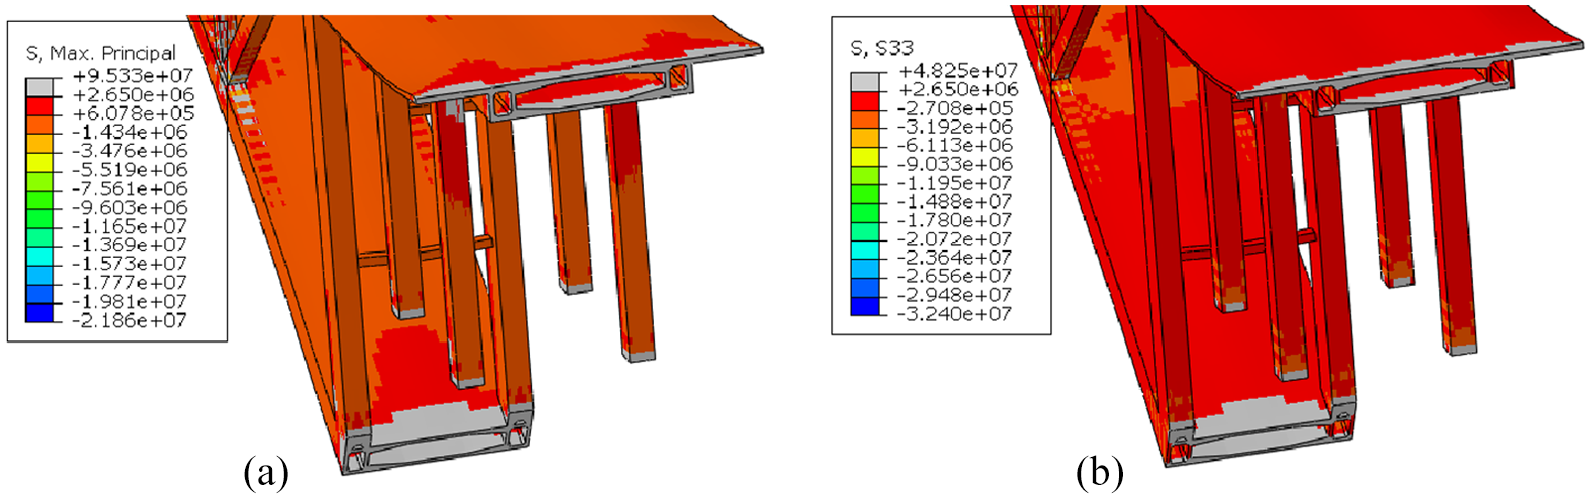
Stress distribution of fixed end: (a) principal tensile stress and (b) transverse stress.
Conclusion
Based on the monitoring of temperature, strain and deflection of health monitoring system and FE solid model analysis, the conclusions are drawn as follows:
For concrete bridges in deep valleys, the range of temperature variation of structure is larger than that of surrounding environment. Because of the large difference of structure altitude, the temperature of each component is different: the temperature of arch foot is lower than that of bridge deck in daytime and higher than that of bridge deck in night, and the difference in winter is about 3°C.
The deformation of CTCA bridge heavily depends on the temperature effect. The daily temperature deflection of mid-span section is 5.4 mm in the summer and 3.4 mm in the winter. For annual temperature, the deformation of the structure from fixed end to one-fourth span is small; by contract, the middle part between two new arch foot is significant, which forms an M-shape deformation of the whole bridge deck. The decreasing rate of arch crown deflection is about 3.0 cm for every 10°C decrease in temperature.
Based on the observation of crack and 3D FE simulation validation, three critical regions of CTCA bridge were identified as follows: the mid-span box-section segment, the new arch foot and contiguous double columns, and the fixed ends. And the temperature effect would cause distinct stress distribution on these regions. Under the action of temperature decreasing, large positive bending moment exists in the mid-span solid web section of long-span concrete composite arch bridge, and transverse cracks occur in the lower edge of the cross section when concrete is tensioned; the chord at the arch foot of double columns deflects upward, the new arch foot produces negative bending moment, and the concrete at the upper edge of the cross section is tensioned; the fixed ends of the CTCA bridge would appear retiform cracks which mainly contributed by the restrain stress under the temperature decreasing condition.
Footnotes
Appendix 1
Handling Editor: Nan Wu
Declaration of conflicting interests
The author(s) declared no potential conflicts of interest with respect to the research, authorship, and/or publication of this article.
Funding
The author(s) disclosed receipt of the following financial support for the research, authorship, and/or publication of this article: This study was supported by the National Science Foundation of the People’s Republic China (51208056) and the Fundamental Research Funds for the Central Universities (310821161013 and 300102218213).