
Abstract
Intensive animal husbandry is becoming more and more popular with the adoption of modern livestock farming technologies. In such circumstances, it is required that the welfare of animals be continuously monitored in a real-time way. To this end, this study describes one on-farm welfare monitoring system for goats, with a combination of Internet of Things and machine learning. First, the system was designed for uninterruptedly monitoring goat growth in a multifaceted and multilevel manner, by means of collecting on-farm videos and representative environmental data. Second, the monitoring hardware and software systems were presented in detail, aiming at supporting remote operation and maintenance, and convenience for further development. Third, several key approaches were put forward, including goat behavior analysis, anomaly data detection, and processing based on machine learning. Through practical deployment in the real situation, it was demonstrated that the developed system performed well and had good potential for offering real-time monitoring service for goats’ welfare, with the help of accurate environmental data and analysis of goat behavior.
Introduction
Livestock production is expected to increase further, for providing more food for the growing global population. It is apparent that market demands have driven livestock farming enterprises to increase the number of animals in their flock or herd globally.1,2 Therefore, intensive animal husbandry is becoming more and more popular with the adoption of modern livestock farming technologies. As a result, fewer resources are available per animal, which has resulted in new welfare problems, because the time is too limited to effectively provide individual animal care. 1 Nowadays, consumers and the wider society are also increasingly concerned about the welfare, health, and living conditions of farm animals. 2 For the purpose of providing enough care to animals, some researchers and farmers have been attempting to utilize advanced automatic tools for monitoring the welfare and health of their animals instead of the traditional ways.
In particular, one of the fundamental components of welfare in animal husbandry is providing appropriate environment, food, and water, which requires a substantial number of man-hours. The advancement of knowledge and technology in the current century, along with human expectations for a sufficiency of high-quality livestock products, has increased the demand for improved production monitoring.2–4 With the development of new technologies, the application and integration of new sensors and interpretation of data from multiple systems with reducing processing times means that information supply for farmers and researchers has been becoming easier than ever. Luckily, automatic monitoring of livestock behavior has already been made in numerous studies, often in conjunction with other behavioral and/or physiological features of the animals. There have been many studies in the literature that demonstrate how such technologies can help in observation of both the normal and abnormal behaviors of animals.4,5
Examples include employing radio frequency systems for locating animals, which utilize sensors and radio signals from a transmitter to triangulate a location, and the use of these location data to provide information on feeding and drinking behaviors of cattle and pigs.6–9 Further examples of the application of new technology are activity and lying behavior monitoring in cattle and pigs using accelerometers attached to the animals. 10 This technique has been widely applied for locomotion and lameness assessment.11,12 It has been witnessed that the application research on sheep and goat sensors is growing. Several types of on-animal sensors, such as motion sensors, heart rate monitors and echocardiograms, jaw and bite sensors, and contact loggers, have been used for monitoring sheep welfare, behavior, health, and environment management.5,6 As pointed out by Fogarty et al., 5 the global interest of this research area is also evident, particularly in Europe and Oceania. In addition, Asia is likely emerging as a dominant player in this field, based on the rapidly growing Asian economy.
However, attachment of sensors to monitor animal behaviors may cause stress and, in some cases, is impractical to use for scoring group behaviors due to their cost and vulnerability. An alternative technology that has been widely considered in agriculture and food engineering is machine vision.13,14 This approach is an automated, cheap, easy, non-stressful, and non-intrusive way to achieve the monitoring requirements of animal behavior. There are several types of machine vision techniques in the literature in which computer vision has been applied to different animals for detection of lying, feeding, drinking, locomotion, and aggressive and reproductive behaviors.3,15,16 Most of the studies have focused on the use of CCD cameras to monitor livestock behaviors, using top-view images along with mathematical processing methods. It has been observed that, in the past decade, increasing applications in three-dimensional (3D) imaging systems, for example, Kinect cameras, have the potential to offer further possibilities for improvement.16–18 Although many machine vision techniques have been recently applied by researchers for livestock behavior detection, further elaboration of image processing techniques could be an important step toward the development of an automated system that can detect the behaviors of animals and decide the best solution or alarm in unusual situations. Since AlexNet was proposed in 2012, deep learning techniques have emerged as powerful methods for learning feature representations automatically from data. Deep learning allows computational models consisting of multiple hierarchical layers to learn fantastically complex, subtle, and abstract representations instead of traditional handcrafted local descriptors and discriminative classifiers.19–22 In the past several years, deep learning methods have been increasingly attracting research attention in many computer vision application areas. It has been shown that these techniques have provided significant improvement for object detection, including animal behavior.23–25 Particularly, some typical deep learning models, for example, Faster Regional Convolutional Neural Network (Faster R-CNN), have already exhibited a powerful ability to automatically recognize the behavior of individual pigs and group-housed pigs under several conditions. 25
As we know, automatically continuous environment monitoring is essential for conducting one good and effective evaluation of animal welfare in addition to image analysis. However, due to in-situ imperfect sensor and network transmission failure, it is inevitable to generate abnormal sensory data in the livestock breeding Internet of Things system.26,27 It is well known that low-quality sensor data can significantly impair the ability of providing reliable real-time situation-awareness. Even worse, it might lead to the occurrence of false alarms, which is costly and time-consuming for farmers, and excess alarms would heavily devaluate the managerial value. Therefore, conducting automatic quality control of observational data is crucial to ensure timely and credible analysis of animal welfare. As a matter of fact, in order to offer good care to livestock, data anomalies need to be identified in near real-time. A large number of automated statistical and machine learning approaches have been put forward, such as minimum volume ellipsoid, nearest neighbor, clustering, decision tree, and deep learning.26–29 However, due to their inherent drawbacks, these aforementioned methods are not capable of detecting anomalies existing in streaming data in real-time. In order to achieve real-time anomaly detection, Xu et al. proposed an autoregressive data-driven model for environmental data streams and its corresponding prediction interval. 21 To deal with the missing data and outliers excluding, the authors introduced smooth Gaussian prior of weak assumptions on typical agricultural data, and short-term forecasts based on the Gaussian process were adopted to fill with missing data, and its prediction error was used to detect outliers. 26 Obviously, an effective and efficient anomaly detection technique not only identifies anomaly data online with high detection accuracy and low false alarm, but also satisfies some constraints in terms of computational and memory complexity. So far, support vector regression (SVR) has been successfully used in time-series analysis as well as anomaly detection, since it has the advantages of requirement of a limited number of training samples, while offering high generalization capability. 27 In addition, other machine learning algorithms with excellent prediction ability, for example, k-nearest neighbor (KNN) and gradient boosting regression, have good potential for implementing the detection of data anomaly. 30
The main objective of this study is to develop and deploy one on-farm welfare monitoring system for goats based on Internet of Things and machine learning. This article presents the detailed technical design and development with considerations of practical deployment and application. More specifically (1) designing one multifaceted and multilevel monitoring system for goat welfare through collecting on-farm videos and representative environmental data; (2) developing the aforementioned monitoring hardware and software systems, with supporting remote operation and maintenance, and convenience for further development, which means that system components, for example, sensors, actuators, and software function modules could be added, removed, and replaced easily; (3) proposing approaches for conducting goat behavior analysis, anomaly data detection, and processing based on machine learning; and (4) implementing the practical deployment in realistic sheepfold to evaluate the proposed monitoring system in terms of reliability and functionality.
The rest of the article is organized as follows. In section “Materials and methods,” we present the goat housing condition and the architecture of on-farm monitoring system, including the design of hardware and software systems, goat behavior analysis, anomaly data detection, and processing based on machine learning. The deployment and application evaluation of the developed system is given in section “Results and Discussion,” followed by concluding remarks in section “Conclusion.”
Materials and methods
Animals and housing
The experiment in this work was conducted at a commercial goat farm belonging to Hefei Angu Agricultural Ltd., Anhui Province, China. Around 60 goats were selected and assigned to 10 fully slatted pens (3.0 m wide×3.5 m long) made of hollow steel tubes, and with a fully slatted floor, so there were about 6 goats per pen (Figure 1). All pens were equipped with two long troughs, one with food and the other with water for the goats. The animals had ad libitum access to food (commercial grower diet) and water during the entire experiment period. Sheepfold light and temperature changed with the natural environmental condition. Two identical steel boxes with the same hardware equipment were installed on rafters in the location shown in Figure 1. Especially, two pens were selected for videos to be taken by means of top-upper side-view cameras.

Top view of the sheepfold.
Architecture of on-farm monitoring system
As illustrated in Figure 2, the architecture of the on-farm monitoring system had several components, including sensing, data transmission, and application layers and more specifically, WiFi-enabled communication and data transmission among the hardware node and remote server. The application layer was in charge of data analysis, providing two types of user interfaces with Web and mobile applications for displaying environmental data, goat videos, and behavior statistics, as well as controlling solenoid valves and ventilation fans inside the sheepfold. Sensing layer comprised the nodes for implementing data acquisition and actuation.

Architecture of on-farm monitoring system.
Node design and overview
More specifically, the hardware nodes were developed as follows. Raspberry Pi 3B+ was utilized as the mainboard, integrated with camera connected to network interface card, relay connected to general purpose input/output interfaces, and environmental sensors connected to USB, and auxiliary equipment, for example, clock, connected to specific interfaces. For ease of maintenance, appropriate configurations for nodes were required to be made. The nodes were powered by 12V, 1A DC.
As a matter of fact, there seldom exist off-the-shelf sensors with USB interfaces because of the limited transmission distance. Hence, RS485-to-USB converter was introduced for providing RS485 interfaces connected to environmental sensors. For the purpose of convenient maintenance, RS485 HUB was employed. As shown in Figure 3, one USB interface of Raspberry Pi 3B+ was connected to one RS485 HUB with the aid of an RS485-to-USB converter. As a result, the number of connected sensors was determined by RS485 HUB, which contributed to the fact that one USB could be connected to multiple sensors with RS485 sensors.
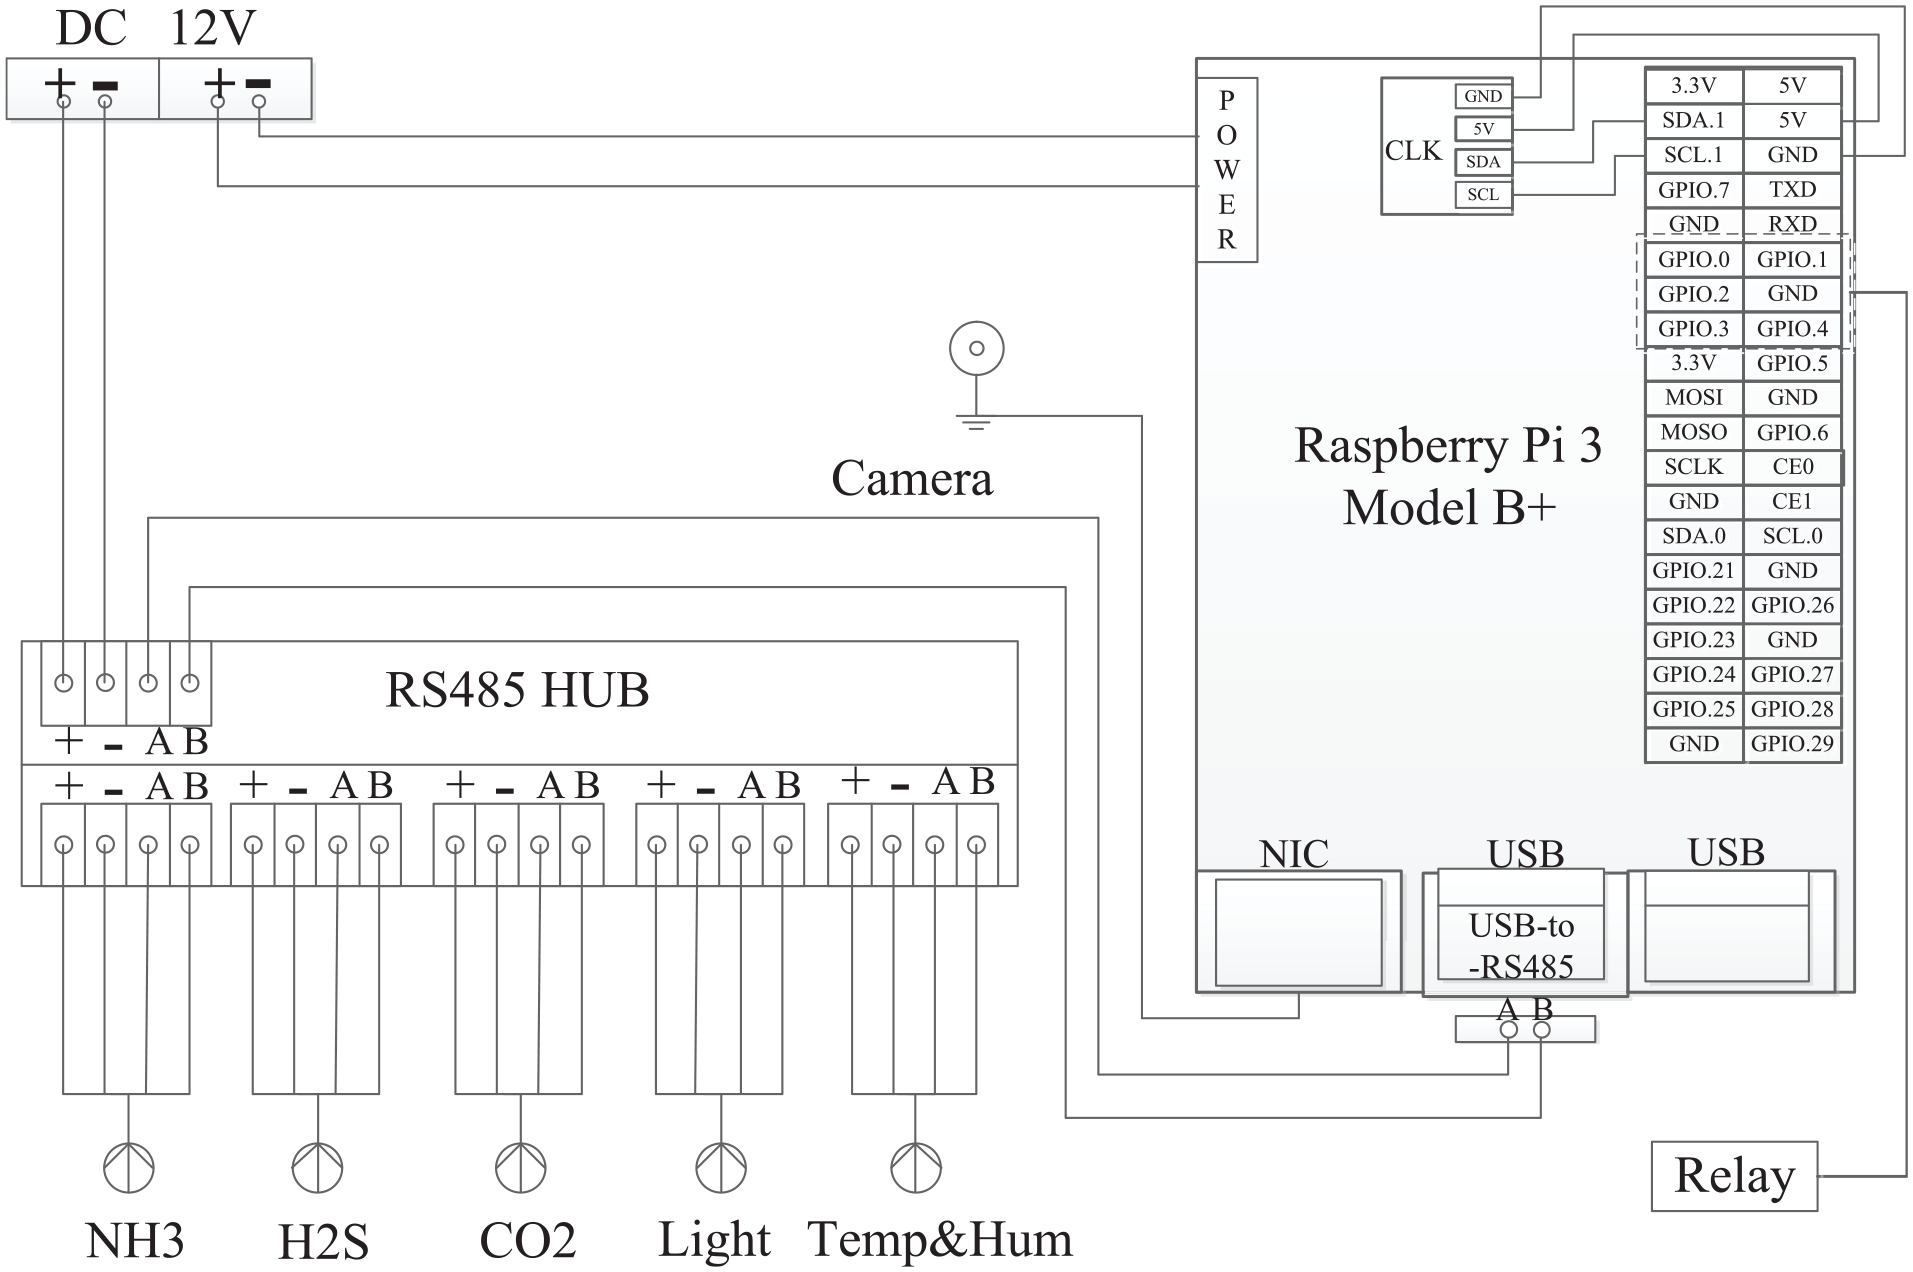
Block diagram of node.
It is well known that the concentration of some special gas in farms is crucial for animal growth and welfare.3,27 Here, the environmental sensors included the ambient light, NH3, H2S, CO2, and temperature and humidity. Up to four actuators were connected to each relay for controlling the operation of actuators including solenoid valves and ventilation fans.
Each device (sensor or actuator) connected to Raspberry Pi 3B+ was assigned a unique deviceID. The deviceID was an unsigned 16-bit integer with a maximum value of 65,535. The first being 1 and each ID thereafter was incremented by 1 for the ones connected to the same Raspberry Pi 3B+ node. The ID difference among the first device connected to the different Raspberry Pi 3B+ is 20 for distinguishing sensors from various nodes.
The packet parameters presented in Tables 1 and 2 pertain to the payload portion of the packet between the node and the server. As presented in Table 1, the payload packet comprised the packet header, data collection date and time, deviceID, and the parameters and value pairs. The actuator command packet consisted of the Header and command blocks (Table 2). The Header block contained packet length and packet type. The actCmd indicated the type of actuation command (open fan/solenoid valve) and the actuator number. The actTime indicated the maximum amount of duration to complete a command before a timeout. The DurationOn indicated how long a solenoid valve or ventilation fan should be open before it was closed and was only used with actTime set to open one actuator. The fan/solenoid valve was automatically closed when the time expired. Whenever the fan/solenoid valve successfully went into open or closed status, the node immediately responded to the server with an acknowledgment.
Data packet payload for nodes.

Node command packet for actuator.

Software system
Here, the Raspberry Pi 3B+ run Raspbian operating system, a Debian-based Linux distribution, was provided by the Raspberry Pi Foundation. It should be mentioned that several third-party operating systems could be available, as pointed out on the official Raspberry Website. 31 Actually, the Raspberry Pi 3B+ had almost the same capability as one microcomputer, programmable and easy to implement further development for extending its capabilities. As for the software development, Python was used based on the fact that it was recommended as one of the main programming languages. Raspberry 3B+ could be accessed locally, as well as over the Internet with the help of remote desktop tools, for example, Teamviewer (TeamViewer GmbH, Germany), which made it much easier to remotely conduct the node maintenance.
Five specialized programs were developed for the node operation, such as sensor data collected periodically, videos taken and sent in real-time, data sent periodically, and actuation performed on demand. More specifically, at every 5 min, the program sent data collection command to the sensors one by one, and got response values accordingly. Videos were taken by invoking cv2.VideoCapture, provided by the Open Source Computer Vision Library. 32 Environmental data was sent every 15 min on top of HTTP protocol. Actuation command was released on demand. In order to improve the reliability of the system, all of the former four programs were set to autostart mode by means of making configurations in the autostart file fold.
The Web server was in charge of receiving data and videos, and afterwards implemented anomaly detection and processing, and then stored into a database. The server also conducted the behavior analysis of goats periodically. The main implementation language involves HTML, Java Server Page, and JavaScript. More specifically, the graphs were created using ECharts (Baidu online network technology Co., Ltd, Beijing, China). MongoDB version 4.0.1 (MongoDB, Inc. New York, USA) was selected, a free and open-source cross-platform document-oriented NoSQL database. Web interface was capable of providing the visual display and convenient exporting of the stored data and videos from the hardware nodes, as well as goat behavior statistics. In addition, users of the Web interface could create and delete monitoring sites and sheepfolds, as well as implementing the operation of solenoid valve and ventilation fan via the Internet.
The mobile application was developed using the WeChat mini program. It should be mentioned that WeChat (Tencent Inc., Shenzhen, China) is one of the most popular social applications in China, with more than 1 billion active users monthly as of the fourth quarter of 2019. WeChat mini program was launched in 2017, which makes it possible for developers to create mini apps in the WeChat system, implemented using JavaScript plus a proprietary API. 33 Subsequently, users may install these inside the WeChat app through QR codes, instead of installing extra applications in their mobile devices. Moreover, in order to make WeChat mini program development as convenient as possible, Tencent Holdings Ltd. has released WeChat Developer Tools, integrating development and debugging, code editing, and code release functions, which help users to develop WeChat applications in simpler and more efficient ways. In our case, the developed mini program should have the ability to provide most function components of displaying environmental data, videos, and goat behavior statistics that the Web server had, as well as the manipulation of solenoid valves and fans.
Real-time anomaly detection for data streaming
The anomaly detection scheme was expected to implement two types of operations. One was to identify sensor measurement as either normal or anomaly. This article developed one real-time anomaly detection method that employed the prediction models of environmental data streams and prediction interval (PI) calculated from recent historical data to identify streaming data that did not conform to the historical patterns. The proposed method was used to calculate the PI estimated uncertainty in the data and in the parameters of the data-driven model. Data were classified as normal/anomalous based on whether or not they fell inside one given PI. The other operation was to replace it with the prediction value when there was missing measurement.
As illustrated in Figure 4, this study used a sliding window of q sensor measurements (or their expected values as explained shortly)
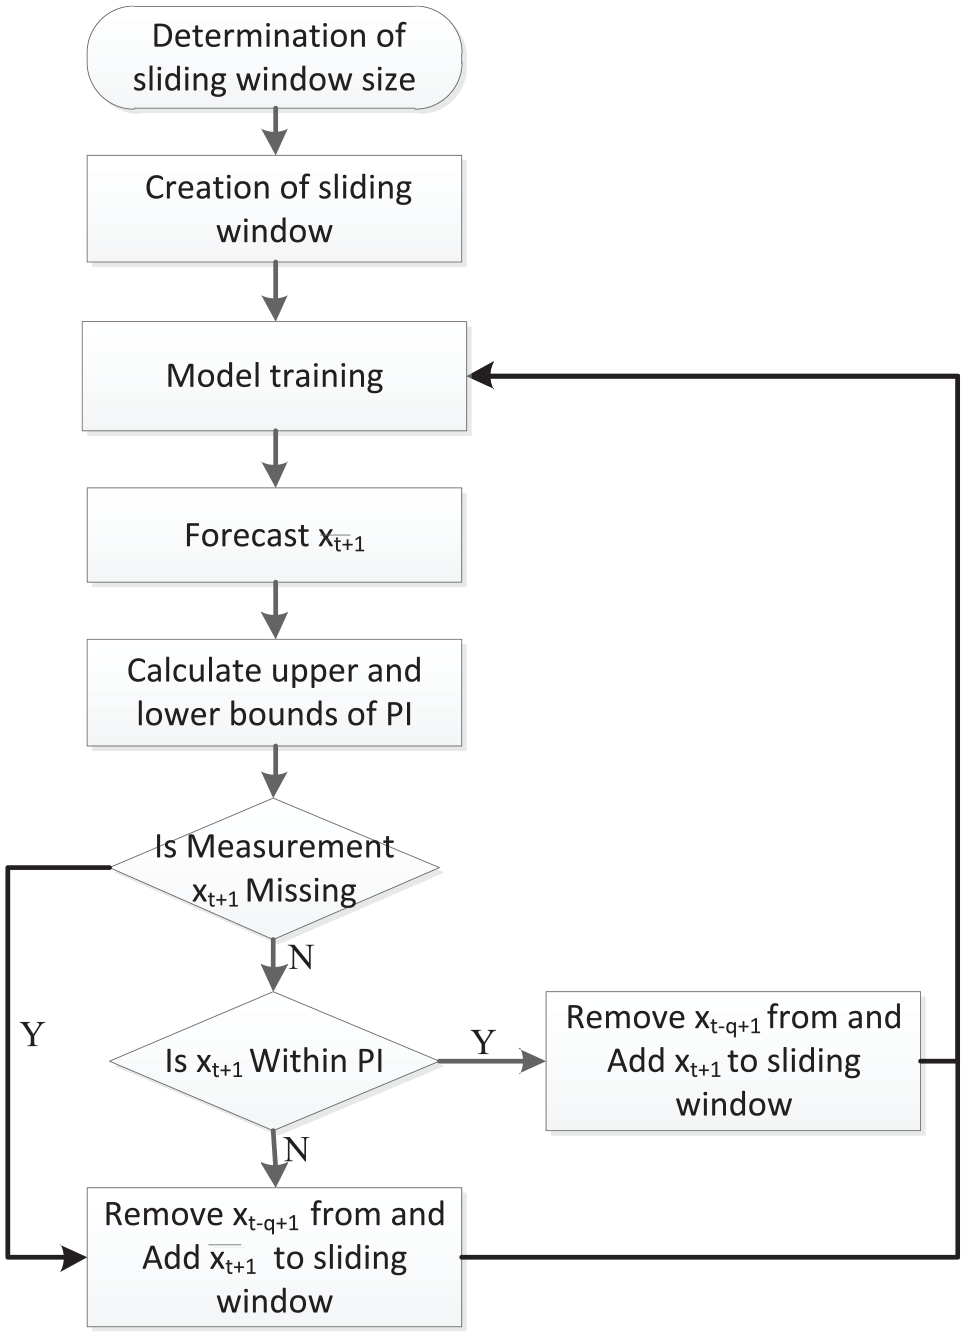
Flowchart of real-time anomaly detection for data streaming.
The sliding window was used for framing the data vectors that were to be used for model construction. Sliding window mechanism was one common strategy to frame one training set for model construction. For the next model, the sliding window will shift q data vectors allowing the q oldest data vectors to be removed from the window as

Here,
Obviously, there were two key factors needed to be considered carefully. One was the size of the sliding window. The other was the detection of anomaly data. It is well known that the size of the sliding window represents the tradeoff between prediction accuracy and computation overhead. Most techniques preferred to use a fixed sliding window. 28 However, it is not easy to determine the size of sliding window. In this article, the window size was determined taking into consideration data sampling interval, fluctuation degree, and periodic characteristics.
First, for each type of monitoring environmental data, we conducted the min–max normalization of the data within one period as follows

Here,
Subsequently, the window size, q, was estimated as follows

Here,
As mentioned above, one measurement was classified as anomalous if it deviated significantly from the one-step-ahead prediction of its value calculated using

Here,
Usually, some metrics were required for evaluation of the anomaly detection scheme. Comparing the assigned labels to the ground-truth labels, a true positive was defined as an anomaly correctly identified, whereas a false positive was defined as measurements incorrectly labeled as an anomaly. Here, two rates in the form of ratios were defined. First, one was the false positive rate (FPR) computed as the ratio of false positives to normal measurements The second rate was the true positive rate (TPR), also known as the detection rate, which was the ratio of true positives to anomalous measurements 27


Here,
Deep learning-based goat behavior analysis
It is crucial for evaluating the health and welfare of goats to figure out their daily behavior in precision goat farming. This section aims to propose automatic classification and quantification of goat behaviors based on deep learning. Obviously, accurate goat identification from video sequences is a prerequisite for conducting goat behavior recognition. As surveyed by Liu et al., 19 bounding boxes have been one of the widely used ways for evaluating generic object detection algorithms, and will be the approach we adopted in this article as well. Especially, there have been several good deep learning-based methods, such as Faster R-CNN, Single Shot MultiBox Detector (SSD), and YOLOv3 (You Only Look Once version 3). 19 When compared with the latter two methods, Faster R-CNN offers higher detection accuracy at the expense of computational cost. For the purpose of effectively evaluating goat behavior, Faster R-CNN was the algorithm employed to conduct the detection of individual goats.
As shown in Figure 5, the food or water lines were drawn for the aid of identifying the eating and drinking behavior. The intrinsic idea was that one goat behavior could be classified as drinking or eating, once its head was beyond the food or water lines. However, it often happened that their heads were blocked by their body or the hollow steel tubes when beyond the food or water lines. In addition, the goat head was too small to be easily detected. This would lead to failure in the goat behavior classification. In order to solve this problem, we took advantage of the position relationship between the bounding boxes of the whole goat body, food, and water lines.
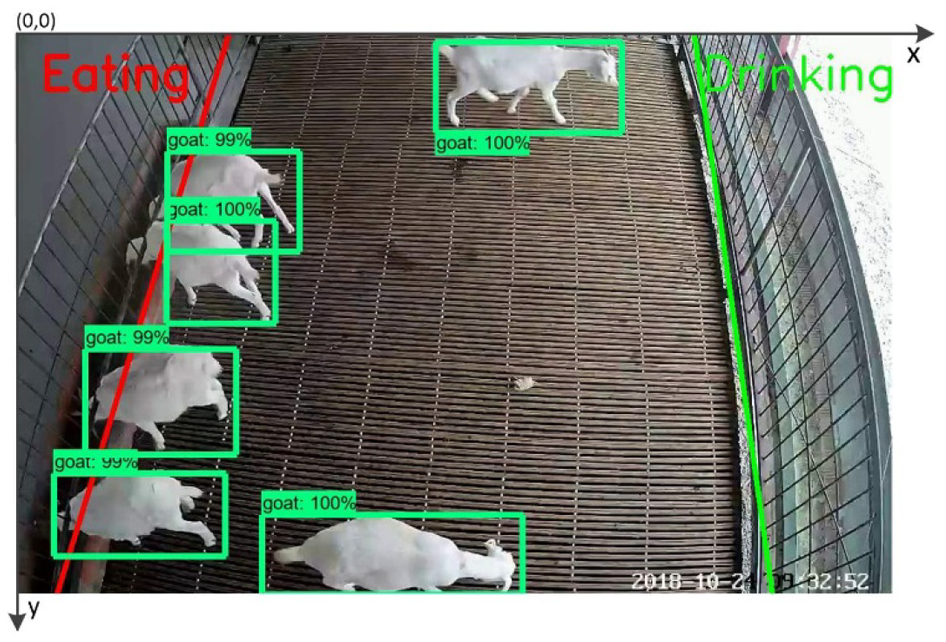
Scheme of goat behavior analysis.
Figure 6 illustrates the diagram of goat behavior analysis. First of all, the model train of goat detection was implemented. To this end, 500 frame images of goats with representative posture were deliberately chosen and labeled as the unique class using the labelImg software. Subsequently, several techniques of dataset augmentation, such as rotation, scaling, translation, and perspective transform, are employed for artificially enlarging the number of training images to 3500 frame images. As a result, 3000 of these frame images were fed into the Faster R-CNN Inception v2 for conducting model train. Moreover, 10-fold cross-validation was implemented. After the completion of training, the model was exported and tested using the rest frame images.

Flowchart of goat behavior analysis.
After goat detection was implemented using faster R-CNN, the center of the object bounding box was used as the representative position of goats. The next step was to implement the accurate classification of the goat behavior. Subsequently, further analysis was conducted by identifying whether or not there were crossing points between food/water lines and bounding boxes. If there were, the recognition of eating and drinking was implemented by making the numerical calculation and comparison, followed in the next paragraph. Otherwise, the amount of goat movement d was estimated based on the Euclidean distance between the centers of two closest object bounding boxes in continuous video frames. The goat behavior was labeled as walking if the corresponding distance d was greater than the specified threshold (Threshold Walking (TW)). Otherwise, the goat behavior was labeled as resting. Last but not least, for ease of calculating the area, the coordinate system was established as depicted in Figure 5, where the origin of the coordinates was located on the top-left corner of frames.
The recognition of goat eating and drinking was based on the area of the bounding box beyond the food/water lines, compared with the whole area of bounding box. As illustrated in Figure 5, there might be three possible shapes, namely, trapezoid, triangle, and rectangle, formed by the area of bounding box beyond the lines. The calculation of these aforementioned areas could be solved on the basis of the knowledge of elementary mathematics. Subsequently, further analysis was conducted for making the classification of eating and drinking behaviors. The following description takes the recognition procedure of eating behavior as an example, which means that there were crossing points between the food line and the bounding box. Note that the recognition of drinking behavior follows the similar procedure. After calculating the area of the rectangular bounding box beyond the food line, the ratio area_ratio, denoted as symbol “r1” of the calculated area to the whole area was estimated. Next, the eating behavior was recognized by checking whether the area_ratio was greater than the specified thresholds of discriminating eating behavior. It is apparent that the aforementioned thresholds were crucial for the result of goat behavior recognition. Moreover, the specified thresholds should be determined according to the characteristics of the bounding box and eating behavior. Here, two specified thresholds were required because of the fact that there were differences among area_ratio when the length of the horizontal side was greater than the vertical side or the opposite. As illustrated in Figure 6, two specified thresholds for discriminating eating behavior are Threshold Eating 1 and 2, abbreviated as TE1 and TE2, respectively. In a similar way, two specified thresholds for discriminating drinking behavior are Threshold Drinking 1 and 2, abbreviated as TD1 and TD2.
Results and discussion
The proposed system was implemented with three parts: node hardware, Web-based application, and mobile application. The monitoring system was deployed and put into operation on 14 July 2018. Since then, it has been performing well and providing real-time monitoring service for the goats’ welfare. As a result, the economic gains and breeding efficiency were improved from the following aspects: reducing manual labor costs of acquiring sheepfold environment and goats’ behavior, timely offering appropriate living conditions, and growth care for goats.
Node hardware
Referring to Figure 7, the developed node was placed inside one steel box, and installed in the sheepfold. This node is designed to collect on-farm videos and environmental data from the sheepfold, as well as controlling solenoid valves and ventilation fans. As shown in Figure 7(a), the mainboard of Raspberry 3B+ was installed inside one customized shield. In our case, Raspberry 3B+ was manufactured by ALSRobot Technology Co., Ltd., Harbin, China. It was released in March 2018 with a 1.4 GHz 64 bit quad core ARM Cortex-A53 processor, on-board 2.4/5 GHz dual-band WiFi, Bluetooth, and USB boot capabilities. 31 Raspberry 3B+ was powered by AC–DC adapter with a capacity of 12V, 1A DC. One 16G SanDisk MicroSD card (SanDisk Corp., USA) was inserted into its card slot for storing the operation system and application software.

Development and installation of sensor and actuator node. (a) Developed node. (b) Installed node.
As can be seen in Figure 7(a), one USB interface of Raspberry 3B+ was connected to one RS485 HUB (Leishen Electronics Co. Ltd., Shijiazhuang, China) with the aid of an RS485-to-USB converter (CH340 chipset, Xinde Electronics Co. Ltd., ShenZhen, China). The used RS485 HUB had 10 groups of interfaces, each group of which could meet the requirement of data collection and power supply of one RS485 sensor. As shown in Figure 7(a) and (b), five environmental sensors, such as ambient light, NH3, H2S, CO2, and temperature and humidity (Leishen Electronics Co. Ltd., ShiJiaZhuang, China), were connected to the RS485 HUB. In addition, the network and other USB interfaces were used to provide access for cameras (ezviz C3W, HIKVision Digital Technology Co. Ltd., HangZhou, China). Fifteen video frames were taken per second. Yunhui relay (Qinyuansheng Electronics Co. Ltd., ShenZhen, China) had four channels, two of which were connected for controlling the operation of actuators, including solenoid valves and ventilation fans. Due to the requirement of triggering voltage, the relay was used for controlling the supply of 12 DC that was further employed for switching on/off the solenoid valves and ventilation fans.
The node hardware accounted for a major portion of the total development and deployment cost. In our case, the total cost of the individual node was about US$587. Around US$65 was required for a package that included Raspberry Pi 3B+ mainboard and its auxiliaries, such as power adapter, SD card, heat sink, and shield. About US$17 was spent on RS485 HUB and RS485-to-USB converter, US$5 on Relay, and US$30 on camera. The costs of five environmental sensors varied depending on the type selected, generally costing between US$450 and US$500 in total. The node cost was much less than many commercial products. In addition, the developed node was easy to remotely operate and maintain in addition to the convenience for further development.
On-farm monitoring system
As shown in Figure 8, an Apache plus Tomcat Web server provided data for remote users over the Internet. In particular, Web interface offered friendly access of viewing on-farm videos and environmental information as illustrated in the middle and right of Figure 8(a). The on-farm videos and environmental data were updated and visualized in real-time. The AJAX architecture was used for providing dynamic data updates without frequent page refreshes, when developing Web-based user interface for data presentation. Representative icons were used for making environmental data presented in a visual manner. In addition, the behavior statistics of goats within the corresponding pen could be obtained by clicking the tab “Behavior.” As shown in Figure 8(a) left, the Web interface offers the management function of monitoring sites and sheepfolds, as well as investigating the historical videos of sheepfolds, managing the alarms, and daily breeding events.

GUIs of Web-based monitoring system. (a) Real-time videos and environmental data. (b) Graphs of environmental data. (c) Control of solenoid valves and fans.
As mentioned before, the graphs of historical data were created by means of ECharts. Moreover, one can make a choice about the combination display of environmental data, as well as the data within his interested time interval (past 3 days by default), which made it much easier for one to get good knowledge of the data trend. In addition, the displayed data and its chart could be exported into the file formats of both Excel and JPG, which improved the potential of further utilizing the collected information data. More specifically, one actual example of the monitoring data acquired from the first node from 23 to 25 November 2018 are shown in Figure 8(b), which showed the change in CO2, H2S, light, air humidity, and temperature. It can be observed that the displayed environmental data changed periodically with time. Particularly, the temperature was greater in the daytime than in the nighttime; on the contrary, the humidity exhibited conversely. This phenomenon was normal and understandable. It should be mentioned that the anomaly data shown in Figure 8 had been eliminated by the proposed method described in section “Architecture of on-farm monitoring system,” which is presented in detail in the following section.
As can be observed in Figure 8(c), there were several HTML tables providing the display of the nodes, sensors, and actuators. The actuator table lists the actuator names, the installation locations, and node IDs to which actuators were attached, along with the actuator status and remaining working time. Each actuator in the table had an HTML text input field to enter the spray duration and toggle buttons labeled Open and Close, which the user could click to actuate fans or solenoid valve. When the toggle button was clicked, the actuator was changed to the other status until a response packet was received from the node with updated status. The updated status indicated that the actuator was at open or closed mode, or that an error had occurred. In addition, the color-coded toggle buttons helped in quickly assessing the actuator working status.
Figure 9 illustrates the main function interfaces of the WeChat mini program. One was able to remotely, conveniently acquire the real-time videos and environmental data without installing any additional software. As can be seen in Figure 9(a), one could watch various monitoring videos by clicking the name of pens. The behavior statistics of goats within corresponding pens could be shown by clicking the toggle button labeled video and behavior. Moreover, one could obtain the various real-time environmental data, even the data changing trend by clicking the corresponding buttons, as shown in Figure 9(b). It is worth mentioning that the mini program also provided the remote control of solenoid valves and fans, as presented in Figure 9(c).

GUIs of WeChat mini program. (a) Videos. (b) Data. (c) Actuator control.
As shown in Figure 1, there were two set of nodes deployed in the same sheepfold. This was because single measurement of environmental information at a location was not sufficient to reflect that of the whole sheepfold. Multiple sampling locations were commonly useful for gaining a better understanding of the sheepfold condition. In our case, users got the environmental information by averaging the monitored data from two sets of nodes. Once one property was greater than the specified threshold, the alarm was triggered, and users could get the alarm by email. Simultaneously, the actuators could be automatically operated for controlling the environment condition of sheepfold. Alternatively, the farmer could take over the control and determine whether the actuators needed to be put into open mode with the Web-based application and WeChat mini program.
Anomaly data detection
As we know, there are several kernel functions available when applying SVR. In our case, the radial basis function (RBF) function was selected as the kernel function based on preliminary experiments. In addition, the penalty factor C and gamma were 1.0 and 0.01, respectively. The hyperparameter K of KNN was equal to 5. The model was run on the computer with 16GB RAM and Intel (R) Core (TM) i5-8400 2.81 GHz.
The experimental data were collected from 13 to 29 October 2018. It was observed that the trend of all these data periodically changed on a 24-h cycle. The regulation factor
In order to verify the rationality of sliding window sizes in formula (3), intensive experiments were conducted for evaluating the root-mean-square error (RMSE) change of SVR and KNN under the condition of various window sizes for all the five monitoring data. Figure 10 depicts the relationship between RMSE and the sliding window size for SVR and KNN. With the increase in window size by 5, the prediction deviations of monitoring factors were investigated in the range [10,40] SVR was first taken into consideration. As shown in Figure 10(a), the prediction of air temperature and humidity offered the least RMSE when the window size was around 20. Meanwhile, the prediction of CO2 and NH3 had the least RMSE when the window size was within the range [15,20]. By contrast, the least RMSE appeared when the window size was 10 for H2S. Hence, the aforementioned window sizes basically matched the result calculated in formula (3). As for KNN, it can be seen in Figure 10(b) that the prediction of air temperature and humidity had the least RMSE when the window size was equal to about 20. Moreover, KNN had the least prediction error of CO2 and NH3 for window sizes of about 20 and 15, respectively. As for H2S, the RMSE tended to increase slightly with the increase in window size. Therefore, it can be concluded that the appropriate sliding window sizes could be determined when using formula (3).

Prediction error of two models with various sliding window sizes. (a) Prediction RMSE of SVR. (b) Prediction RMSE of KNN.
As tabulated in Table 3, the performance of anomaly detection varied with the interested environmental properties. Here, the confidence of 95% was considered. As for air temperature and humidity, both SVR and KNN had close TPRs that were above 95%. However, the significant differences in FPRs were observed. More specifically, SVR offered the improvement of more than 85% in FPRs compared with KNN. With the increase in the trend fluctuation, the TPRs offered by SVR and KNN tended to decrease. In particular, KNN was superior to SVR in regard to CO2, NH3 and H2S in terms of TPRs and FPRs. Through securitization, it was found out that SVR outperformed KNN in terms of prediction accuracy when implementing the prediction of air temperature and humidity. Meanwhile, the opposite performance appeared when implementing the prediction of CO2, NH3 and H2S.
Anomaly detection performance.

SVR: support vector regression; KNN: k-nearest neighbor; TPR: true positive rate; FPR: false positive rate; RMSE: root-mean-square error.
Hence, it can be concluded that the prediction deviation of the models was negatively correlated with the abnormal detection performance and could impose more significant influence on the FPRs in comparison with the TPRs, especially when dealing with the data with high fluctuation. Particularly, SVR was suitable for conducting anomaly detection of sensory data with low fluctuation, whereas KNN was a better choice if considering those data with high fluctuation. In addition, it was found out that on average SVR spent about 0.4 ms on the evaluation of each data point, which was close to KNN. Nevertheless, it is worth pointing out that the proposed scheme had good capacity of dealing with missing value in addition to anomaly data. More specifically, among five groups of monitoring environmental data, there were totally 15 missing data that were made up of prediction data. Meanwhile, there were 537 collected data detected as anomalous data. Several series of data shown in Figure 8(b) demonstrated the effectiveness of the proposed anomaly detection scheme.
Goat behavior analysis
In order to validate the automated analysis of goat behavior, the percentage of frames correctly estimating the number of goats in the sheepfold with reference to manual labeling was determined. As shown in Figure 11, two categories of typical scenarios, that is, feeding and non-feeding, were considered for evaluating the proposed behavior analysis. Two groups of 10-min video clips, in Pen 2, were taken from 21 to 29 October 2018, every day at 7:00 a.m. and 12:00 a.m., respectively. The morning video clips were classified as the feeding scenarios, since the new food was given at 7:00 a.m. and 4:00 p.m. every day. By contrast, the noon video clips were the non-feeding scenarios. As mentioned before, the goats could have ad libitum access to food (commercial grower diet) and water because there was food and water in the troughs all the time. In the feeding scenario, there might be high probability where the eating dominated the behavior distribution of the goats. On the contrary, the rest behavior might take most of the goat behaviors in the non-feeding scenario.

Two scenarios for goat behavior analysis. (a) Feeding scenario. (b) Non-feeding scenario.
The experiment was carried out based on the deep learning framework of TensorFow 1.9.0 operating on the computer with 16 GB RAM and Intel (R) Core (TM) i5-8400 2.81 GHz with NVIDIA GeForce GTX 1050 Ti GPU and corresponding CUDA-9.0 and CUDNN-7.1. The training parameters for Faster R-CNN Inception v2 were as follows. The number of categories was one. The number of training iterations was 120,000. The learning rate was initially 0.001 for the first 80,000 steps and subsequently 0.0001 for the last 40,000 steps, and the batch size was equal to 16. Through preliminary experiments, it was observed that it was appropriate for recognizing the behavior of goats when we had the following thresholds. The two thresholds of discriminating eating behavior were 0.001 and 0.320 for TE 1 and 2, respectively. The drinking thresholds were 0.001 and 0.470 for TD 1 and 2, respectively. The walking thresholds were 7.32, 8.34, 9.75, and 11.50 when the numbers of frame intervals were 1, 3, 6, 9, and 12, respectively.
Figure 12 shows the distribution results of goat behavior analysis in the experiment carried out for this work. The abscissa lists several interested frame intervals, as well as the ground truth denoted as “0.” Note that the ground truth referred to the result of behavior recognition by direct human observation. More specifically, this figure presents the ratio of four behaviors of goats under various conditions. It is apparent that the proposed method offered good estimation (close to the actual action) of the goat behavior. Under scrutiny, we observed that in the feeding scenario, the average errors of behavior recognition were 1.01%, 1.06%, 1.10%, 1.83%, and 2.81%, when the number of frame intervals was 1, 3, 6, 9, and 12, respectively. In the non-feeding scenario, the results of behavior analysis suffered from deviations of 0.05%, 0.07%, 0.11%, 0.26%, and 0.47%, when there were 1, 3, 6, 9, and 12 frame intervals. Therefore, it was witnessed that the ability of recognition tended to decrease as the frame intervals increased. Particularly, it should be pointed out that there was significant deterioration in the behavior recognition once the number of frame intervals was greater than 9. In the feeding scenario, the recognition error was mainly from overlapping goats which resulted in two or more goats bounded in the same bounding boxes. In addition, this error was caused by the nonuniform speed of goat movement and the rapid switch among different behaviors. In the non-feeding scenario, the recognition error lay in the two aspects of walking and resting, which could be explained as follows. One reason was from the nonuniform speed of goat movement. Another was the fact that there was change in goat shape due to scratching and fighting. Nevertheless, it can be concluded that the proposed method could provide appropriate estimation of the goat behavior only if the number of frame intervals was not greater than 6. It is worth mentioning that the proposed goat behavior analysis outperformed the existing method in Yang et al., 25 in terms of animal detection complexity and behavior recognition accuracy.

Goat behavior distribution under various frame intervals. (a) Feeding scenario. (b) Non-feeding scenario.
As mentioned before, Faster R-CNN has the characteristics of offering higher detection accuracy at the expense of computational cost. In our case, it was found that the goat detection speed of Faster R-CNN reaches on average four frames per second. Thus, there might be one potential obstacle to apply Faster R-CNN on analyzing real-time videos/streaming. Nevertheless, it should be emphasized that when implementing behavior analysis, if the number of frame intervals was 6, the goat detection speed of the frames could reach 24 frames/s, which means that the proposed method, with one inexpensive personal computer, could be qualified for monitoring goat behavior in a real-time way.
Conclusion
During this study, one on-farm system was developed for monitoring the goat welfare by integrating Internet of Things and machine learning. Internet of Things was in charge of collecting on-farm videos and representative environmental data. Meanwhile, the approaches based on machine learning undertook goat behavior analysis, detection, and processing of anomaly data. Generally, the proposed system possessed the characteristics of remote operation and maintenance, as well as convenience for further development. The accurate environmental data and goat behavior distribution were acquired when implementing practical deployment and application of the developed monitoring system in one real sheepfold, showing its reliability and functionality. As one multifaceted and multilevel monitoring system for goat welfare, it may be a useful reference for future precision livestock farming. In the future work, we plan to implement more behavior analyses, for example, aggression and lameness, as well as goat weighing and other routine tasks, for improving the on-farm monitoring system.
Footnotes
Acknowledgements
The authors thank the research farms that participated in this study for giving the opportunity of data collection by providing the study environment, experimental animals, and required information. In particular, the authors thank Jingyao Zhang, Junxiang Ma, Qingqiang Lv, Yiming Shen, and Shifang Feng for their invaluable assistance with the experiments.
Handling Editor: Marcin Wozniak
Declaration of conflicting interests
The author(s) declared no potential conflicts of interest with respect to the research, authorship, and/or publication of this article.
Funding
The author(s) disclosed receipt of the following financial support for the research, authorship, and/or publication of this article: The subject is sponsored by the Anhui Key Laboratory of Intelligent Agricultural Technology and Equipment (No. APKLSATE2019X004), the National Natural Science Foundation of P. R. China (No. 61502411), the Introduction and Innovation of International Advanced Agricultural Science and Technology Program (No. 2016-X34), the Natural Science Foundation of Anhui Province (No. 1608085QF126), the Key Research and Development Plan of Anhui Province (No. 1804a07020108, 201904a06020056), and the Natural Science Major Project for Anhui Provincial University (No. KJ2019ZD20).