
Abstract
Void defects under track slabs are the main danger affecting the safe operation of high-speed railways. In the short high-speed railway maintenance periods, China’s high-speed railway line maintenance operations must quickly and dynamically determine void defects under track slabs that are in service without contact. However, the detection of void defects under track slabs still mainly relies on the manual inspection and flaw detection by railway workers during the railway maintenance period. If the defects are not quickly identified, the consequences could be disastrous. This article presents a new method for the non-contact dynamic detection of void defects under track slabs. The method involves the use of air-coupled ultrasonic sensors to generate and receive ultrasonic guided waves in the track slab to quantitatively represent the size of the void defect according to the principle of energy leakage of guided waves in the propagation process. The characteristics of the position-amplitude curve, taking the position of the beam axis as the abscissa and the amplitude of the time domain signal as the ordinate, were numerically calculated and analyzed. The quantitative relationship between the convex interval of the position-amplitude curve and the size of the void defect was obtained, and an imaging method of the void defects based on x, y two-dimensional line scanning data fusion is proposed. The excitation and reception methods of air-coupled ultrasonic guided waves were studied, and a 1:1 model of the track structure was built in the laboratory to verify the method and detect the void defect under the track slab. The experimental results show that ultrasonic guided waves can be excited and received in the track slab by air-coupled ultrasonic sensors. Based on the guided wave energy leakage principle, the quantitative characterization and imaging of the void defect under track slabs can be realized.
Keywords
Introduction
By the end of 2018, the total operating mileage of China’s high-speed railway was 29,000 km. 1 The ballastless track structure is the main track structure used for China’s high-speed railway, accounting for more than 50% of the high-speed railway’s operating lines. 2 The ballastless track structure is a typical slab concrete composite structure that integrates a track slab (concrete material) and a bottom plate (concrete material) with cement asphalt mortar. The ballastless track structure is an important bearing component. Under the influence of dynamic loads, temperature, and other environmental factors, void defects may occur under the track slab. 3 Taking the Shanghai–Hangzhou high-speed railway under the Shanghai Administration of China Railway as an example, a total of 3912 void defects under the track slab were found in 2018. Void defects under track slabs have become the main danger affecting the safe operation of high-speed railways. However, the detection of void defects under track slabs still mainly relies on manual inspection and flaw detection by railway workers during the high-speed railway overhaul period (also known as the “skylight period”). 4 If the void defect is not found in time, the consequences could be disastrous. Especially in the high-temperature season, void defects occur frequently and determining how to quickly and accurately perform non-contact dynamic detection of void defects under track slabs has become a core problem that needs to be solved in the maintenance of high-speed railway lines. At present, the conventional dynamic detection of high-speed railway lines in China mainly involves the use of large-scale track inspection vehicles; however, the existing track inspection vehicles can only be used to conduct routine detection of track geometry and basic dynamic parameters, and the non-contact dynamic detection of void defects under track slabs is not yet possible. 5 The main non-destructive testing methods for identification of void defects under slab concrete composite structures include electromagnetic radar, far-infrared imaging, impact echo, and ultrasonic methods. The electromagnetic radar wave method 6 is affected by the metal medium, and the many prestressed steel bars in the track slab (the first layer in the ballastless track structure) seriously affect the detection performance of the electromagnetic radar, so identifying void defects is difficult. The far-infrared imaging method 7 has a detection depth of 10 cm and needs to be tested in the morning and evening (when the temperature changes fastest); however, the skylight period of high-speed railway maintenance is from 1:00 a.m. to 4:00 a.m., which limits the application of far-infrared imaging in the detection of defects in ballastless track structures. The impact echo method 8 uses transient impact force to induce the free vibration of the slab and judges the structural state through the spectral features. It is a relatively mature concrete non-destructive testing method. However, the impact echo method needs to generate an excitation source via hammering with a hammer. It is a contact detection method, which cannot rapidly and dynamically detect void defects without contact. The conventional ultrasonic methods 9 mainly use the reflection generated by the body wave on the defect surface to judge whether a void defect exists inside the structure, and its point-by-point detection method is inefficient and cannot meet the needs of long-line and large-area ballastless track structure detection in the short period of high-speed railway maintenance.
Ultrasonic guided waves have a large detection range, multimode characteristics, and strong detection ability and can detect structures from long distances and large scales with a small number of sensors10–12 and can be used to select suitable single or multiple blues by adjusting excitation frequency. Ryden and Lowe 13 established the characteristic guided wave equation of a three-layer bonded concrete pavement structure using a global matrix and solved its dispersion curve, which provided theoretical guidance for the non-destructive testing of concrete highways using guided waves. Li et al. 14 simulated the propagation of ultrasonic guided waves in reinforced concrete beams using the finite element method, used the correlation between different layered signals and excitation signals to characterize the layer size, and verified the correctness of this method using experiments. Song and Popovics 15 analyzed the influence of the weakly bonded interface layer on the dispersion characteristics in the ladle concrete structure, used the S0-mode guided wave to detect the layer in the ladle concrete, and obtained accurate quantitative results. Garcia et al. 16 used ultrasonic guided waves to monitor the evolution law of interfacial layer defects in reinforced concrete plates and quantitatively characterized the size of void defects based on the energy leakage. The ultrasonic guided wave method for the detection of defects in concrete often uses an ultrasonic sensor to excite and receive guided waves through a liquid coupling agent on the concrete, which not only has strict requirements for the flatness of the concrete surface, but also the detection result is affected by the coupling agent, so rapid and dynamic detection is difficult.
Air-coupled ultrasonic technology can overcome the bottleneck of the traditional ultrasonic method and provides a new method for non-contact dynamic detection of void defects under track slabs. This technology was originally used to detect the quality of wood and paper in the 1970s, and it has been widely used in non-destructive testing of wood products, 17 paper products, 18 and composite materials. 19 The first application of air-coupled ultrasonic technology for concrete involved placing air-coupled sensors on both sides of the samples to excite longitudinal waves to detect the strength of concrete. 20 Subsequently, air-coupled ultrasonic waves were used to monitor the porosity or cracks of small cement stone, mortar, and concrete and to characterize the distribution of aggregates in asphalt concrete.21,22 In the limited published research, non-contact dynamic detection is often realized by air-coupled longitudinal ultrasonic waves, but the point-by-point detection method restricts the detection efficiency, and achieving rapid and dynamic detection of void defects under in-service track slabs is difficult. 23 Combining the ultrasonic guided wave method and air-coupled ultrasonic technology can simultaneously meet the needs of both detection and detection efficiency for void defects under track slabs. This combination can also realize the rapid and non-contact dynamic detection of long-line and large-area void defects under track slabs in service. Therefore, we propose a new non-contact dynamic detection method for void defects under track slabs. The method uses air-coupled ultrasonic sensors to excite and receive ultrasonic guided waves in the track slab and to quantitatively characterize the size of the void defect according to the energy leakage principle of the guided wave during propagation. First, we analyzed the energy leakage principle of ultrasonic guided waves. On this basis, we established a model of air-coupled ultrasonic guided wave for void defects under oblique incident conditions and numerically calculated and analyzed the characteristics of the position-amplitude curve, taking the position of the beam axis as the abscissa and the amplitude of the time domain signal as the ordinate. Then, the guided wave beam propagation process in the void defect under a track slab was analyzed, and the quantitative relationship between the convex section of the position-amplitude curve and the size of void defect was obtained. A void defect imaging method based on x, y two-dimensional (2D) line scanning data fusion was created. Second, we studied the excitation and reception methods of air-coupled ultrasonic guided wave, and we verified the propagation of guided waves generated by air-coupled ultrasonic sensors in track slab using experiments. Finally, the interaction between ultrasonic guided waves and void defects, as well as the imaging quality and accuracy of void defect, was analyzed using experiments on a 1:1 model of a ballastless track structure in the laboratory.
Method
Principle of guided wave energy leakage
For the bonded interface, the displacement and stress of the particles on the interface are not zero, and the guided wave energy can propagate from one side of the interface to the other. When guided waves propagate in slabs with partially rigid interfaces, their energy changes include attenuation due to increasing distance and leakage due to passing through rigid interfaces.24–26 Therefore, the energy change in the guided wave propagating in the slab can be regarded as being caused by energy attenuation and leakage. When guided waves propagate in a bonded structure with the void defect length of x, according to the guided wave energy leakage principle, the energy change of a guided wave in the medium is as follows

where
As shown in Figure 1, two slabs of media A and B, which are uniform and without defects, are bonded together, in which slab A is on the top and slab B is on the bottom. The space between the transmitting point (T point) and the receiving point (R point) on the upper surface of slab A is L. When guided waves with certain intensity are excited in slab A, three cases of guided waves exist on the propagation path L as follows:
As shown in Figure 1(a), the bonded interface between slab A and B is completely void. At this time, the upper and lower surfaces of slab A satisfy the free boundary conditions on the propagation path. The guided wave propagating in slab A is W1 and the received signal is S1.
As shown in Figure 1(b), the bonded interface between slabs A and B is partially void. At this time, the rigid boundary condition and the free boundary condition exist simultaneously on the lower surface of the slab A over the entire propagation path. The guided wave propagating in the slab A is W2 and the received signal is S2.
As shown in Figure 1(c), the bonded interface between slabs A and B is not void. At this time, the lower surface of slab A is under a rigid connection condition throughout the propagation path. The guided wave propagating in slab A is W3 and the received signal is S3.
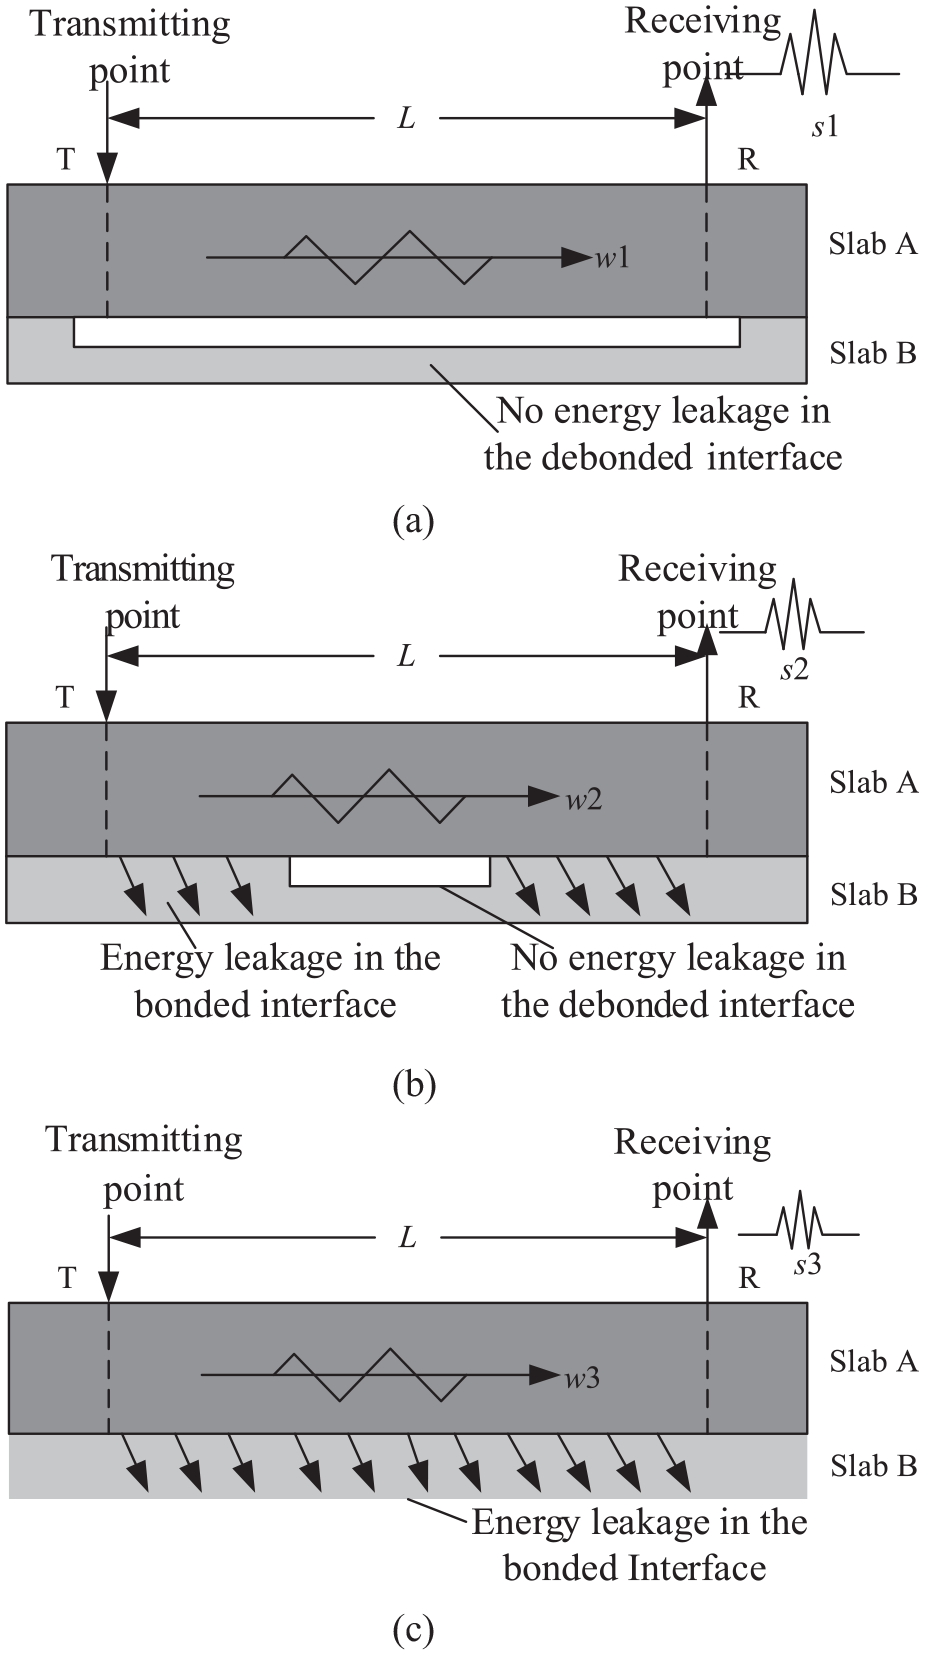
Principle of detection of void defects using guided waves: (a) completely void, (b) partially void, and (c) not void.
The amplitude of the ultrasonic signal is proportional to the sound pressure received, whereas the sound intensity is proportional to the square of the sound pressure amplitude. Therefore, a monotonic correspondence exists between the amplitude of the ultrasonic signal and the ultrasonic energy. According to equation (1), the smaller the defect length x, the smaller the guided wave energy at the receiving point. Conversely, the guided wave energy at the receiving point is higher when the defect length is longer. In the three cases in Figure 1, the energy P relationship of the guided wave propagating in A plate is P(W1) > P(W2) > P(W3) and the magnitude of the signal amplitude of the guided wave is P(S1) > P(S2) > P(S3). Therefore, the existence and size of the void defect on the propagation path L can be judged by the amplitude of the guided wave signal at the receiving point (R point).
Air-coupled ultrasonic guided wave detection model under oblique incident conditions
The air-coupled ultrasonic guided wave is excited by the air-coupled ultrasonic sensor to generate guided waves in the slab by oblique incidence of the longitudinal wave. Considering the attenuation of ultrasonic waves in the air, we established the guided wave detection simulation model for void defects under track slabs under the condition of oblique incidence of air-coupled ultrasonic wave, as shown in Figure 2

where A0 is the signal amplitude of the guided wave at the incident point, Ly is the distance between the transmitting sensor and the receiving sensor, h is the height of the sensor from the surface of the slab, θ is the incident angle, W is the width of the guided beam, α1 is the attenuation coefficient of ultrasonic wave in the air, α2 is the attenuation coefficient of guided waves in the slab, β is the attenuation coefficient of guided waves in the slab, M is the area of the void defect on the guided wave propagation path, the origin o of the Cartesian coordinate system is located at the center of the defect, the length of the defect is D, and sensors scan along the x-axis direction with scanning step dx and scanning length is Lx.

Air-coupled ultrasonic guided detection model of void defects.
When the void defect is square, M is a function of the position of the beam axis x and the length of void defect, that is

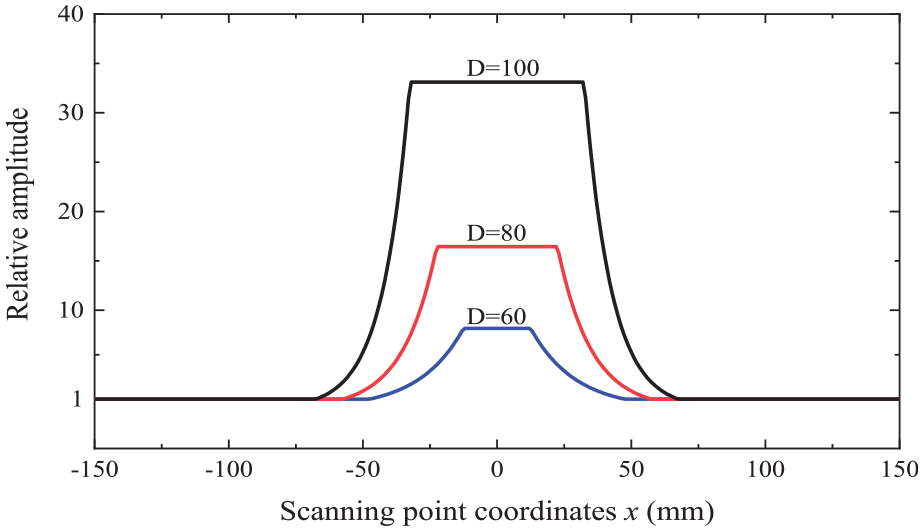
Using the model in Figure 2 to simulate the air-coupled ultrasonic guided wave to detect void defects, the specific parameters in the simulation model were as follows: A0 = 1, α1 = 0.023 Np/cm, α2 = 0.02 Np/cm, β = 0.35 Np/cm, Ly = 440 mm, Lx = 300 mm, w = 35 mm, h = 10 mm, θ = 3.8°, and dx = 1 mm. The guided wave detection simulation results when the length of the void defect D was 60, 80, and 100 mm were calculated, and the position-amplitude curve shown in Figure 3 was obtained. To facilitate discussion, the signal amplitude in the area without a void defect was normalized as shown in Figure 3. The position-amplitude curve has the following characteristics:
The position-amplitude curves corresponding to the different sizes of void defects are trapezoidal. The straight line at the top of the curve corresponds to the guided wave sound beam completely covering the position of the void defect. This occurs because when distance Ly between the two sensors and the width W of the sound beam are constant, the area M of the void defect covered by the guided wave sound beam is within a certain range, and the signal amplitude reaches the maximum at this time. When the axis of the guided beam departs from the void defect, the corresponding curve amplitude decreases gradually and reaches a minimum in the area without a void defect. When the void defect is small, M decreases first, meaning the corresponding curve amplitude decreases first.
The amplitude difference in the curve corresponding to the different sizes of void defects is different; the larger the size of the void defect, the larger the curve wave amplitude difference.
The curve corresponding to the different-sized void defects is a convex function, and the range of the convex interval is related to the size of the void defect. The larger the size of the void defect, the larger the convex interval range; conversely, the smaller the convex interval range. For example, when the size of the void defect is D = 80 mm, the convex interval range is [−57.5, 57.5]; when the void defect size is D = 100 mm, the convex interval range is [−67.5, 67.5].
Simulation results of detection of different-sized void defects using guided waves.
Quantitative analysis
The detection model shown in Figure 2 shows that when the guided wave beam moves in the positive direction of x, the right side of the beam reaches the left edge of the defect and the left side of the beam leaves the right edge of the defect. The beam axis coordinates correspond to the left endpoint value (i.e. x = − (W+D)/2) and the right endpoint value (i.e. x = (W+D)/2) of the convex interval of the position-amplitude curve. Let the length of the position-magnitude curve convex section be L; then, the void defect size D has the following relationship with the convex interval length L

where W is the width of the guided beam, which is the width of sensor wafer.
According to equation (4), the size of the defect along the scanning direction can be calculated according to the length of the convex interval of the position-amplitude curve, which can only determine the position information of the defect in the x-axis direction. If the complete 2D information of void defect is to be obtained, the position information of the void defect in the y direction should be scanned again. As shown in Figure 4, the 2D imaging of the void defect can be realized by fusing the data of the scanning results along x and y directions in the “one sends and the other receives the signals” detection mode.

x, y two-dimensional line scanning data fusion imaging.
The implementation process of this method is as follows
Step 1: Scan along the x direction, collect m data, and record as follows

Step 2: Scan along the y direction, collect n data, and record as follows

Step 3: The vectors Xm and Yn are, respectively, multiplied by the n-order column vector In and the m-order column vector Im to obtain the matrices AX and AY


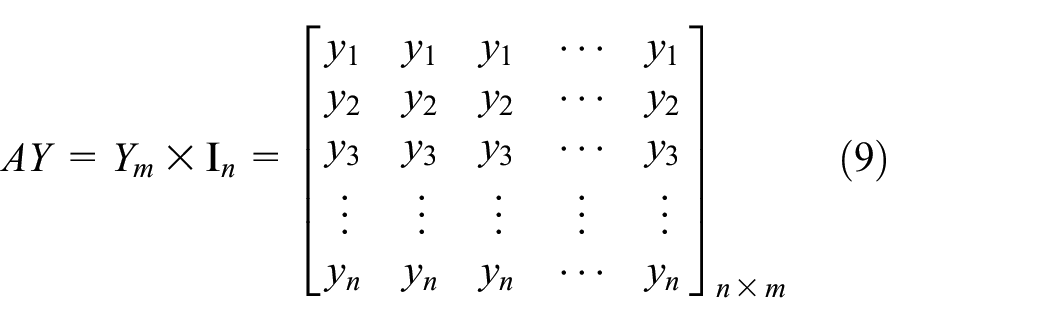
Step 4: Transpose the matrix AY and then add it to the matrix AX to produce matrix A

Air-coupled ultrasonic guided wave propagation in track slab
Transmission and reception of air-coupled ultrasonic guided waves
As shown in Figure 5, the ballastless track structure is a typical three-layer concrete bond structure. To facilitate analysis, we made the following assumptions for the ballastless track structure: (1) the three layers of materials are all ideal elastic materials, (2) the three layers of materials themselves are uniform, and (3) the three layers of materials have no void defect, and the void defect only appears at the bonded interface.
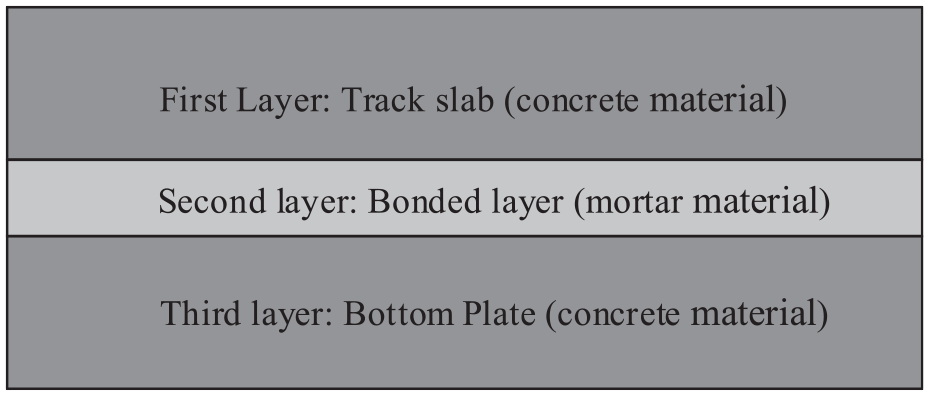
Concrete bonded structure.
If the void defect occurs between the first layer and the second layer in a ballastless track structure, the first layer can be treated as slab A, and the second and third layers were treated as slab B. Then, the concrete bonded structure is equivalent to the bonded structure of slabs A and B, in which slab B is a two-layer slab structure. As shown in Figure 6, two concrete slabs A and B are bonded together, with slab A on top and slab B on the bottom. The ultrasonic transmitting point T and the receiving point R are located on the upper surface of slab A, the spacing between point T and point R is Ly, and a square void defect of length D exists between slabs A and B. The guided wave propagates in the y direction and scans in the x-axis direction. Each scanning point records the position of the beam axis and the amplitude of the corresponding time domain signal. After scanning, the position-amplitude curve was created with the position of the beam axis as the abscissa and the amplitude of the time domain signal as the ordinate. If the void defect occurs between the second and the third layers, the first layer and the second layer were treated as slab A, and the third layer as slab B. At this time, slab A is a two-layer slab structure, and the dispersion curve needs to be solved according to the guided wave characteristic equation in a two-layer slab.

Void defect detection method using guided waves.
Air-coupled ultrasonic guided waves are generated by obliquely incident longitudinal waves in the testing samples. The excitation and reception of single guided wave modes follow Snell’s law 27

where c1 and c2 are the sound velocity of sound wave propagation in mediums 1 and 2, respectively; θ1 is the incident angle of sound wave incident from medium 1 to 2; and θ2 is the refraction angle of sound wave in medium 2.
For the guided wave propagating in the slab, the direction of the propagation is parallel to the plane of the slab and along the positive direction of x1, that is, θ2 = 90°. If the wave number k2 at a certain frequency is obtained from the dispersion curve, the phase velocity is c2 = ω/k2. Therefore, when the air-coupled ultrasonic sensor excites the signal, the incident angle θ1 of the sound beam can be obtained using Snell’s law

where c1 is the speed of sound in the air.
According to equation (12), the phase velocity dispersion curve of a guided wave and the angle and frequency-thickness product dispersion curve of each mode can be obtained. As shown in Figure 7, when a guided wave propagates in a slab structure, it leaks into the air continuously, and the leaky guided wave formed in the air is received by the receiving sensor. Because guided waves propagate parallel to the plane of the slab, the incident angle of the sound wave incident from the slab to the air is 90°. According to Snell’s law, the incident angle of the guided wave in air is equal to the incident angle of the guided wave from air to slab. Generally, to receive strong guided wave, the frequency and angle of the receiving sensor are the same as those of the transmitting sensor.

Transmission, propagation, and reception of air-coupled ultrasonic guided waves.
According to the dispersion equation of the multilayer slab, the group velocity and phase velocity dispersion curve of the guided wave propagation in the track slab can be obtained, as shown in Figure 8(a) and (b). The dispersion curve of the incident angle and frequency-thickness product are obtained according to equation (12), as shown in Figure 8(c). When the frequency-thickness product is 6 MHz mm, an A2 mode guided wave with a group velocity of 4000 m/s can be excited in the track slab at an incident angle of 3.8°. The physical parameters of the track slab studied in this article are listed in Table 1.
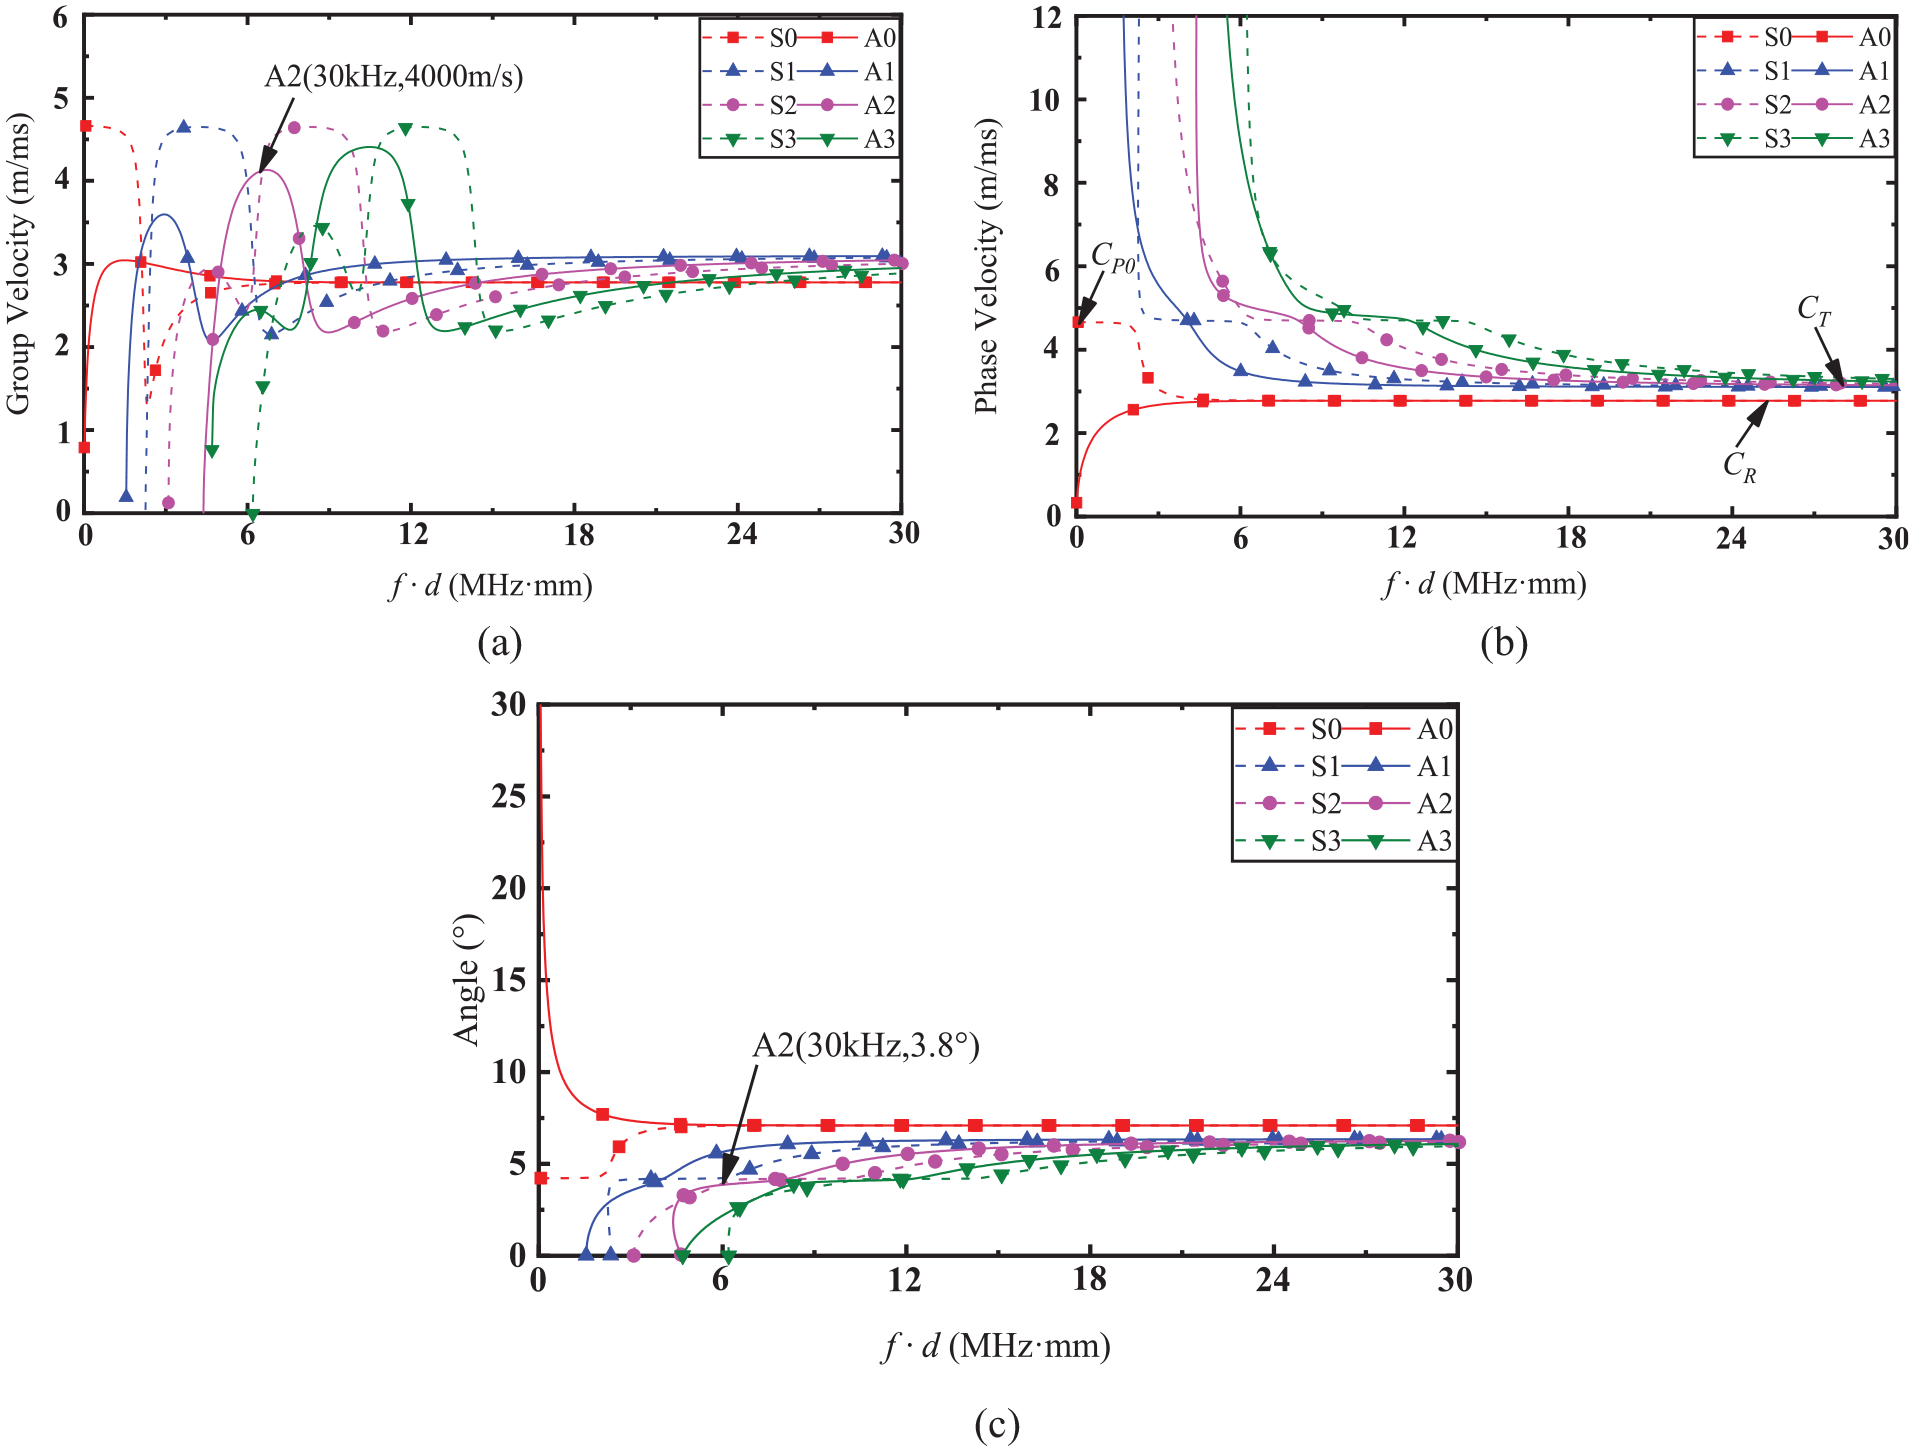
Dispersion curves of guided wave propagation in track slabs: (a) phase velocity, (b) group velocity, and (c) incident angle.
Physical parameters of the track slab.

Air-coupled ultrasonic guided wave propagation experiment in track slab
An air-coupled ultrasonic excitation and reception system was developed to verify the propagation rule of ultrasonic guided waves in track slabs, providing a method for the subsequent detection of void defects under track slabs. As shown in Figure 9, the system was mainly composed of a JPR-600c pulse generator (Japan Exploration Co., Ltd, Yokohama, Japan), air-coupled ultrasonic sensor (Suzhou Air-Coupled Ultrasonic Technology Co., Ltd, Suzhou, China), NI9188XT chassis (National Instruments, Austin, TX, USA), NI9775 analog card (National Instruments), NI9401 digital card (National Instruments), and preamplifier with band-pass filtering function. The upper computer program was written by LabView software (National Instruments) to control the supersonic sensor. The JPR-600c pulse generator can excite rectangular pulse waves with voltages up to 600 V, the amplifier gain was 60 dB and provided band-pass filtering, the air-coupled ultrasonic sensor has a frequency of 30 kHz, the NI9775 analog module was used to collect the ultrasonic signals with maximum sampling rate of 20 Mbit/s, and the NI9401 digital module was used for signal synchronization. The NI9775 and NI9401 were embedded into the slots of the NI9188XT chassis and communicated with industrial computer through the network port.

Air-coupled ultrasonic transmitting and receiving system: (a) system framework and (b) physical object.
An air-coupled ultrasonic sensor with a central frequency of 30 kHz was used to excite guided waves on the upper surface of the track slab at an inclined angle of 3.8°. The signals received by the air-coupled ultrasonic receiving sensor on the same side are shown in Figure 10(a). Looking at the first guided wave signal with a high signal-to-noise ratio, the spectrum in Figure 10(b) shows that the center frequency of the sensor used was 30 kHz. From the calculated dispersion curve of the incident angle and frequency-thickness product, when the excitation frequency was 30 kHz and the incident angle was 3.8°, the guided wave in A2 mode could be excited in the track slab. The receiving sensor was moved in 5-mm steps parallel to the surface of the track slab at a position far from the fixed air-coupled ultrasonic transmitting sensor, and collected a total of 10 signals. Figure 11(a) depicts the data collected at different positions of the track slab at an incident angle of 3.8°. The group velocity of the mode was calculated to be 3950 m/s, which is consistent with the theoretical group velocity of 4000 m/s. The time–frequency short-time Fourier transform (STFT) distribution is shown in Figure 11(b). Compared with the theoretical dispersion curve and the time–frequency distribution, the A2 mode energy concentrates around the theoretical dispersion curve, which is in good agreement with the theoretical curve. Only A2 modes exist in theory, but other higher order modes are produced in experiments.

(a) Time domain signals of guided waves received on the track slab and (b) their spectrum.

(a) Time domain signal and (b) short-time Fourier transform (STFT) time–frequency distribution at different positions on the track slab.
Experiment detecting a void defect under a track slab
Experimental system and samples
To verify the feasibility of detecting void defects under track slabs using air-coupled ultrasonic guided waves, we constructed an experimental system, as shown in Figure 12, which was composed of a computer, a high-energy ultrasonic excitation receiver, air-coupled ultrasonic sensors, a track inspection trolley, and a ballastless track structure. As shown in Figure 12, in the 1:1 model of a ballastless track structure, the proportion and material of each layer were strictly in accordance with the Code for Durability Design of Railway Concrete Structures (TB 10005-2010), and the construction process was in accordance with pretensioned prestressed concrete slab of CRTS III slab ballastless track for high-speed railway (Q/CR 567-2017). The construction unit was the China Railway Second Bureau. In the production process of the 1:1 model of the ballastless track structure, a void defect 200 mm in length, 200 mm in width, and 15 mm in height was buried at the interface of the second and third layers.

Experimental system for detecting a void defect under a track slab and 1:1 model of ballastless track structure.
Analysis of interaction between guided wave and void defect
We fixed the sensor spacing Ly at 750 mm (four times greater than the wavelength) and the inclination angle at 3.8°. Then, according to the scanning method shown in Figure 13, linear scanning along the x- and y-axis directions was conducted on the sample, and a total of 14 sets of signals were collected with 40 mm as the step length. The scanning results along the x-axis direction in Figure 14(a) show that the guided wave signals received in the area without the void defect were the smallest because the bonded interface on the scanning path was a rigid interface, and the guided wave energy leakage was larger. The guided wave signal received in the void defect area was the largest, which was due to the void defect on the scanning path, and the energy of guided wave did not leak at the free interface. The amplitudes of the guided wave signals received at the left and right boundaries of the void defect were between the amplitudes of the guided wave signals in the void defect area and the region without a void defect. This occurred because the guided wave sound beam did not completely cover the void defect, and some of the guided wave energy leaks. The scanning results along the y-axis direction are shown in Figure 14(b), where the same rule can be obtained. These experimental results showed that the interaction between the guided wave and void defect is consistent with the energy leakage principle and simulation analysis results, which indicates the feasibility of using the energy leakage principle to detect void defects.

Scanning method: (a) scanning along the x-axis direction and (b) scanning along the y-axis direction.
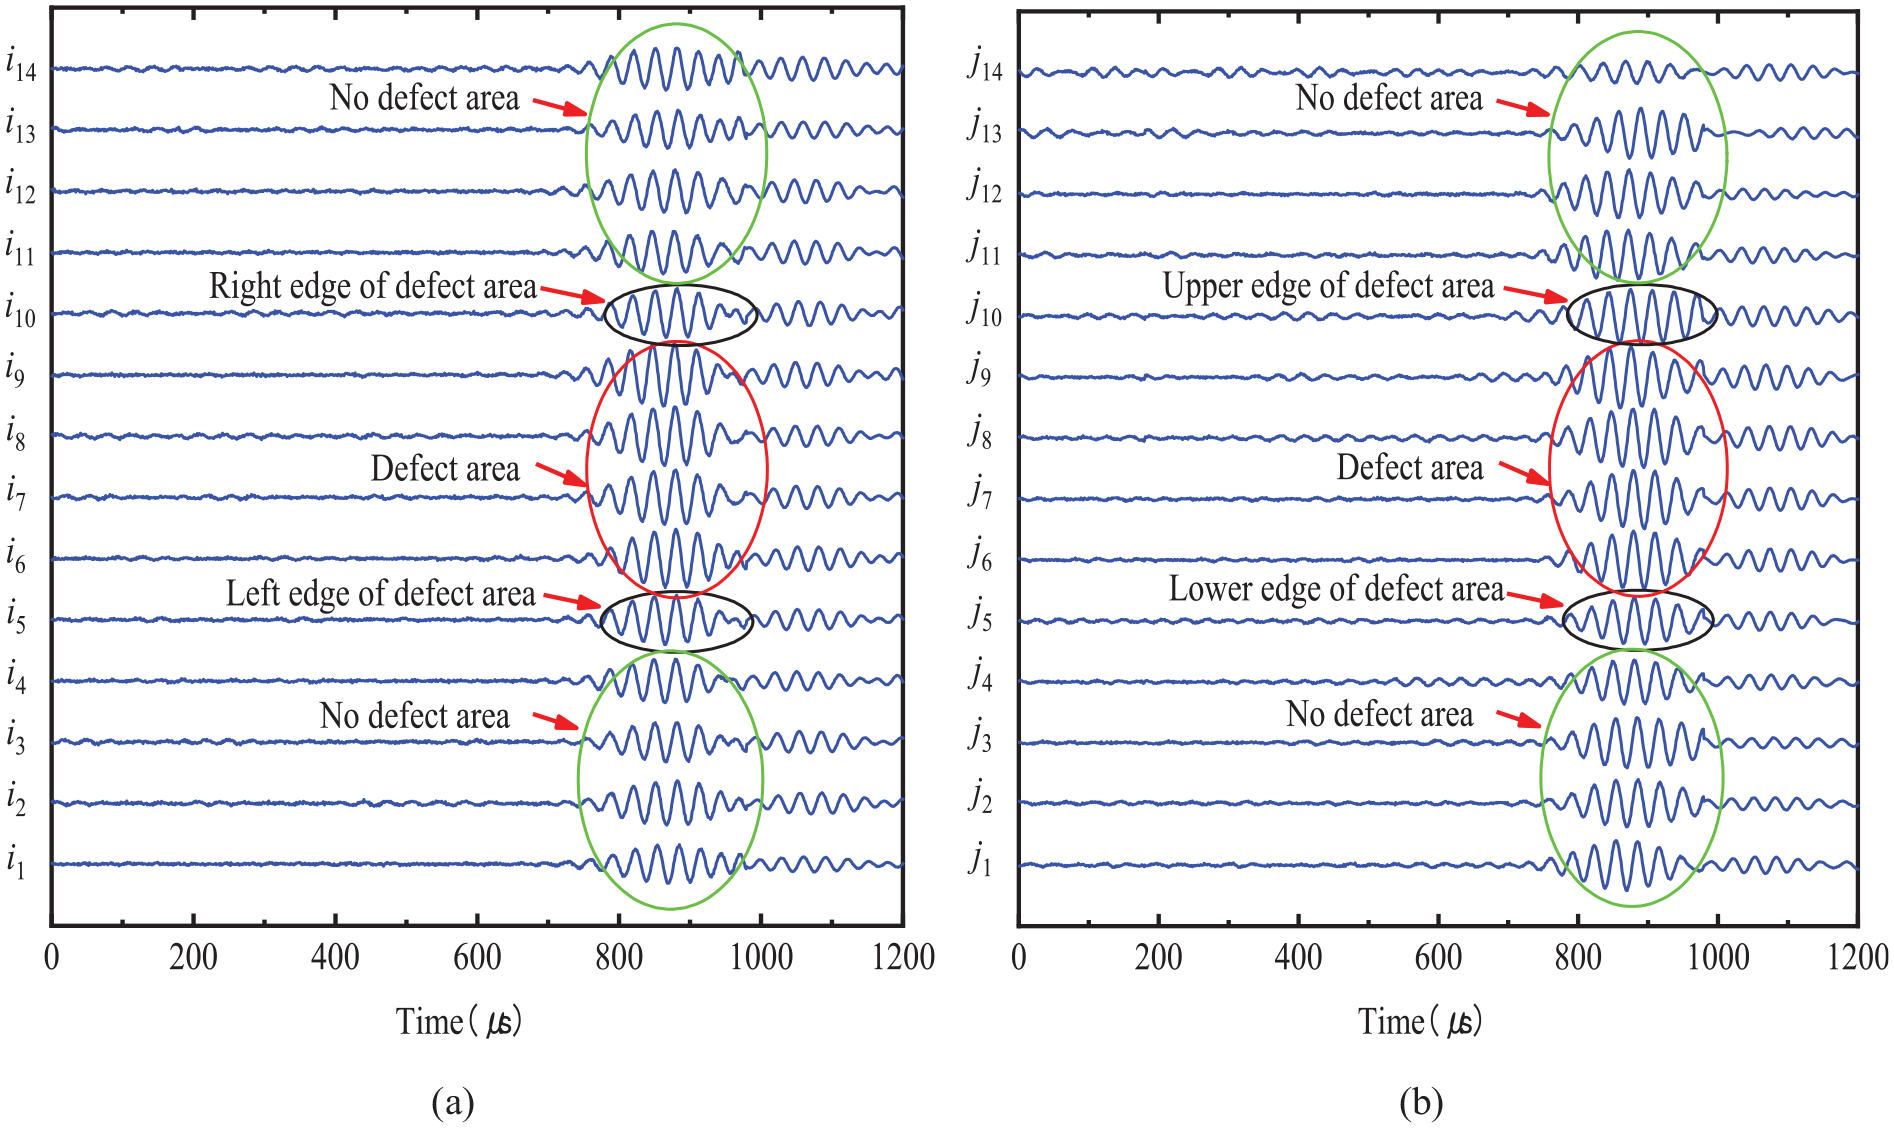
Guided wave signals received at different scanning positions scanning results along the (a) x-axis and (b) y-axis directions.
The sensitivity of a guided wave to void defects was analyzed by taking the sampling points i1 and j2, i5 and j5 of the void defect edge, and i9 and j9 of void defect area in the scanning results along x- and y-axis directions. The relative amplitudes of the six points were 0.65 and 0.60, 0.80 and 0.74, and 1 and 1, respectively, as shown in Table 2. The rate of change of the guided wave signal amplitude obtained by scanning along x- and y-axis directions is shown in Table 2, ranging from 0% to 54% and from 0% to 67%, respectively. This shows that guided wave signals in both directions are sensitive to void defects.
Sensitivity of guided wave signal amplitude.

Quantitative analysis of testing results
The 14 groups of signals scanning along the x- and y-axis directions were plotted as a position-amplitude curve, and the amplitude was normalized as shown in Figure 15. The position-magnitude curve has the following characteristics
The curve is a convex curve; the signal amplitude is higher in the area of the void defect and lower in the area without the void defect.
In Figure 15(a), the convex interval of the curve is about [−140 mm, 136 mm], and the length of the convex interval is 276 mm. We calculated that the width of the void defect is 206 mm and the detection error is 6 mm.
In Figure 15(b), the convex interval of the curve is about [−130 mm, 135 mm], and the length of the convex interval is 265 mm. We concluded that the width of the void defect is 195 mm and the detection error is −5 mm.
If the void defects are evenly distributed on the corresponding scanning lines, the imaging of void defect along the x- and y-axis directions can be obtained as shown in Figures 15(c) and (d). The t2D imaging of void defect on the xoy plane was obtained by fusing the data from the two directions, as shown in Figure 16(a). Because the amplitude of the guided wave signal in the area without the void defect and the amplitude of the left and right boundaries i5 and i10 of the void defect were significantly different, the threshold of the void defect was set to Ag = (i5+i10)/2. After introducing the threshold, the void defect profile was obtained, and the size and position of the defect (200 × 200 mm) were consistent with the actual values. However, due to the non-uniform interface of the bonded layer, the energy leakage of the guided wave in the bonded area was not uniform, resulting in an inconsistent signal amplitude in the bonded area. For a thick track slab, the possibility of unevenness is high, which affects the amplitude variation of the guided wave during the entire scanning process. In addition, the thickness of the track slab is large, the guided wave modes increase, and the different modes interfere with each other, which affect the amplitude of the guided wave characteristic mode.

Linear scanning results of position-amplitude curve along (a) x-axis and (b) y-axis directions; imaging of void defect uniformly distributed along (c) x-axis and (d) y-axis directions.

(a) Two-dimensional imaging of void defect and (b) imaging after introducing the threshold.
Conclusion
Non-contact dynamic detection of void defects located under high-speed railway track slabs is a difficult problem. In this article, a new method to address this problem was proposed by combining air-coupled ultrasonic technology with ultrasonic guided waves. The effectiveness of this method was verified by experiments. The specific results are as follows:
The theoretical and experimental results show that a certain guided wave mode can be excited by an obliquely incident track slab with an air-coupled sensor, and when the excitation frequency is 30 kHz, the A2 mode guided wave mode can be excited and received by the incident track slab at the incident angle of 3.8°.
Guided wave modes excited by air-coupled ultrasonic sensors in track slabs are sensitive to void defects. The interaction of the received guided wave signals and void defects is in accordance with the guided wave energy leakage principle. The amplitude of guided wave signals is the smallest in the area without void defects, followed by the edge of the void defect, and the largest in the void defect area.
The position-amplitude curve obtained by linear scanning can localize the position of the void defect, and 2D imaging of the void defect in the xoy plane can be quickly obtained using data fusion of x, y 2D line scanning. However, the detection results and imaging quality are considerably affected by the thickness of the track slab, the uneven interface of the bonded layer, and the interference of different modes.
In summary, non-contact detection and quantitative characterization of void defects under track slabs can be achieved using an air-coupled ultrasonic sensor to excite and receive ultrasonic guided waves in track slabs and based on the guided wave energy leakage principle.
Footnotes
Handling Editor: Kenneth Loh
Declaration of conflicting interests
The author(s) declared no potential conflicts of interest with respect to the research, authorship, and/or publication of this article.
Funding
The author(s) disclosed receipt of the following financial support for the research, authorship, and/or publication of this article: This research was funded by the National Natural Science Foundation of China (No.: 12004240, 11871255 and 51907117), China Postdoctoral Science Foundation (No. 2020M671022), and Huaian Natural Science Research Project (No. HABZ201919). The authors also thank the Key Science and Technology Support Project of Shanghai Science and Technology Commission (No.: 18030501300).