
Abstract
With rapid industrialization, the construction of high-rise buildings is a good and effective solution to the rational and effective use of land resources and alleviation of existing land resource tensions. Especially in the construction process, if there is a problem with the pile foundation, the building will inevitably be tilted, which will directly affect the personal safety of the construction workers and resident users. The experiments in this article use the concept of big data to divide the system into modules such as data collection, data preprocessing, feature extraction, prediction model building, and model application in order to provide massive data storage and parallel computing services to form a security test system. The experimental data show that wireless sensor technology is applied to the inclination monitoring of buildings, and a monitoring system based on wireless inclination sensors is designed to enable real-time dynamic monitoring of buildings to ensure human safety. When the experimental model frame is stable under normal environmental conditions, a nonstationary vibration is artificially produced for a period of time from the outside world, which is about 60 s higher than the traditional method, and the efficiency is also increased by about 80%, a situation where a building has a reversible tilt change.
Keywords
Introduction
At present, the safety inspection of high-rise buildings in China is mainly a manual method, that is, the work is completed by visual inspection and with the help of professional equipment. However, the manual method is not efficient and requires strong professionalism and experience. To solve this problem, this article proposes a method based on artificial intelligence and big data to solve the high-rise building safety detection technology. By applying wireless sensor technology to the inclination monitoring of buildings, a monitoring system based on wireless inclination sensors is designed to enable real-time dynamic monitoring of buildings to ensure people’s safety.
With the continuous acceleration of the modern city construction process, high-rise structures have become an inevitable development idea between the current population pressure of modern city development and the growing shortage of high-rise construction land. However, in the course of operation to ensure the normal construction of high-rise buildings on the site, major safety accidents such as fall, collapse of stairs at high altitudes, and injury to machinery during construction may often occur. Among them, there are relatively many fall incidents at high altitudes, and they are often more dangerous. Therefore, it is necessary to strengthen the construction safety of high-rise building safety projects, as well as production quality management and risk control, in order to effectively reduce the probability of the direct occurrence of construction safety accidents and the severity of damage caused by them. During the construction of high-rise buildings, the deformation of the building is complex and the risks are extremely high. 1 A variety of new measurement and control instruments and testing methods are required to carry out joint testing at the same time in order to carry out building deformation risk monitoring, morphological risk detection and construction quality risk control. 2 Multi-source and massive automatic monitoring and intelligent detection and analysis data have been generated. Data collection management and intelligent comprehensive data analysis are difficult, in addition to the optimized and safe storage of monitoring data, rapid data processing, intelligent comprehensive analysis, and comprehensive data display. Higher technical requirements have also been put forward from various aspects. 3 The traditional monitoring and processing system of high-rise buildings in China is not suitable for application to the overall construction structure characteristics and intelligent monitoring and processing requirements of high-rise buildings in China, and it is impossible to perform timely intelligent building monitoring and processing of the overall structural deformation of the building. 4 Therefore, the intelligent analysis method of structural change monitoring of high-rise residential buildings has been developed. This monitoring method relies mainly on “big data” and “artificial intelligence” technology to realize the comprehensive management, intelligent data analysis and intelligent risk prediction of big data such as high-rise building structural deformation quality monitoring and shape detection, which provides effective technical guidance for high-rise building structural deformation quality monitoring, shape change detection and building quality and safety control.
At present, some foreign experts and scholars have achieved important results in the automated management of building deformation information. Ceriotti et al. 5 and others have conducted a 4-month vibration test on a medieval tower building in Trento, Italy through a variety of wireless sensors. The self-developed software is used for real-time data processing, and the test results prove the stability of the software system. Makantasis et al. 6 developed a steel building structural health monitoring system in 2013, which realized wireless remote and real-time transmission of monitoring data, and achieved good monitoring results. At present, the verticality monitoring method for high-rise buildings depends mainly on periodically sending personnel to the site for monitoring. However, this traditional method has the following two problems: First, the basic condition for traditional building verticality monitoring is human. 7 Whether it is a building under construction or a building that has already been put into use, whether there is a tilt or not, you need to send someone to monitor it regularly, collect data for a period of time, and then calculate and analyze them to get the results. Such an actual situation keeps security monitoring personnel in a passive state and makes monitoring early warning useless. 8 Second, the work plan and working hours of the monitoring staff are fixed, which means that if there is no problem with the building being monitored, the building that has not been monitored has already had problems.
Bridge safety monitoring and a close connection with actual engineering are urgent problems that need to be solved in the development of modern society. Bridge safety monitoring is a multi-disciplinary and comprehensive problem. It requires not only mechanical and structural knowledge as support, but also the results of a wide range of related disciplines as tools, such as signal processing, artificial intelligence, materials science, sensing, and data transmission processing. Thus, this article aims to study the intelligent analysis system for deformation monitoring and morphological detection of high-rise buildings from the perspective of big data, artificial intelligence technology and simulation experiments. The periodic automatic monitoring of the sensors has changed the existing building monitoring methods and achieved more results with less effort, providing a more modern and feasible solution for people’s housing safety now.9–11 In this article, we choose a close-to-actual building simulation experiment framework and the corresponding way to cause the verticality to change, then select the front-end hardware and wireless network construction to provide a data basis for the subsequent data processing work, and design a wireless tilt-based sensor monitoring system. The experimental data show that, through the periodic automatic monitoring of sensors, traditional building monitoring methods can be changed. Intelligent monitoring modes have been developed to improve the operational efficiency of deformation monitoring and morphological detection of super-high-rise buildings and large heterogeneous buildings, and to obtain information on measurement and control, full element resource management, intelligent analysis, and hazard location.
Methods and programs
Big data characteristics
Big data represent a very large and complex data set. It is a kind of massive, high-intensity, high-speed, high-efficiency, diversified information comprehensive assets.12–14 Big data stream has four basic characteristics of “V”: large data volume and usually continuous and rapid increase; large I/O (input/output) data with a high transmission speed; diverse data types and information sources; and a great value for big data applications.15,16 In general, big data refers to various mass statistical data that we use to accurately describe data that are so large that it is almost impossible to use brain or artificial calculations, but they can be analyzed and processed using various simple computer processing software. With the continuous development of mobile computers and other modern data detection and processing technologies, data collection has become increasingly easier.
In the era of big data, artificial intelligence has promoted the content change of the computer industry and implemented artificial intelligence–assisted work systems to help workers better realize computer knowledge, and follow up and track the working status of the workers. Personalized teaching plan or improving the teaching content to make a good foundation, all feedback results leaders can easily follow up in real time, to achieve the purpose of teaching according to their aptitude, and completely promote the reform of the computer industry. In addition, artificial intelligence can also create a targeted platform for workers with computer skills. Working on the platform allows people to communicate fully. This platform is not just limited to offline, but the staff can also easily communicate online. A certain time can be set for communication activities. At other times, a robotic assistant can easily solve the problems in the work, which greatly reduces the workload of the workers and improves the efficiency. Artificially assisted intelligent work systems can also generate specialized computer education content through deep learning and natural language, the quality of which is almost the same as that written by humans.
Composition of the sensor
Meaning of the sensor
Sensors are the main tool for processing physical information into digital signals. The sensor system is an automatic detection device that can sense diverse information that can be automatically measured in real time and can be automatically converted by a susceptor into a radio signal or other measurement information within a certain period of time. The form of measurement information is output in order to meet the technical requirements of real-time transmission, processing, storage, display, recording, and process control of information. 17
The Internet of Things and sensors are complementary. 18 The sensor is similar to human eyes, ears, and mouth, but it is not just as simple as all human senses. The sensor can itself collect a lot of useful information at any time. It can be said that these intelligent sensor devices are an important foundation for the normal operation of the entire global Internet of Things system. It is precisely because of its existence that the Internet of Things communication system can have more content that can be transmitted to the “brain.”
Selection of the tilt sensor
Because the verticality of the building is monitored at an angle in a three-dimensional (3D) space, and the direction in which the building is offset during actual use is unknown, the inclination sensor is required to be able to measure the space at a reasonable monitoring point angle in any direction. 19 At the same time, it is necessary to understand the internal structure of the inclination sensor and the measurement mode used according to the use requirements. Finally, according to the internal structure, working mode, and measurement range of the sensor, it needs to be determined how to arrange the tilt sensor on the building to obtain the most accurate angle. The system diagram of the tilt sensor is shown in Figure 1.

System diagram of the tilt sensor.
Settlement of monitoring points
Due to the particularity of the deformation monitoring technology, it is impossible to allow interruptions to occur during the monitoring of various deformation measurements of large buildings, the technical requirements for monitoring instruments are becoming higher and higher, and the deformation monitoring data must be timely. Furthermore, reliable and accurate real-time acquisition is required. Traditional deformation measurement methods, measurement and analysis equipment, and other data analysis and processing methods were unable to fully meet the current needs of large-scale building deformation monitoring technology. 20 The monitoring technology has gradually changed from the current traditional point and line automatic monitoring and monitoring mode to a 3D spatial and stereo automatic monitoring mode that combines points, lines, and surfaces, and has changed from traditional tracking automatic monitoring to fully automatic tracking monitoring mode. 21 In terms of data analysis algorithms, the introduction of data model methods has made up for the shortcomings of the current traditional data analysis models, making it possible to show the changes in the stress coefficient of various parts of the building clearly.
According to the settlement observation specification, the sinking speed of a point can be calculated according to the formula
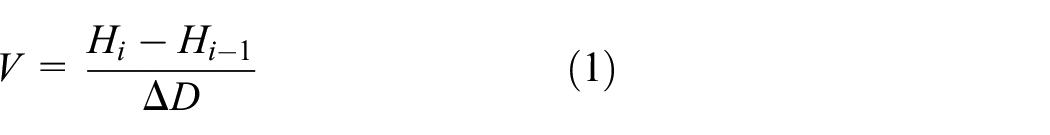
After each observation of the water body, according to the measurement error calculation theory and the water body statistical data verification error theory, the raw data of the water body after each preprocessing are comprehensively processed using the Excel software to calculate the water body sedimentation rate at each monitoring point. The measured values are accumulated and used to calculate the elevation depth. The relationship between each monitoring point and the average settlement rate measurement when the observation is first completed at this point is

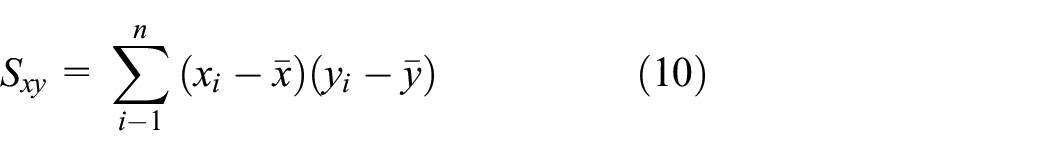
The overall model of planar structure regression takes the whole building as the main experimental research object. 22 For example, if n to n observation points called settlement points are buried in the foundation or wall of a building, the actual settlement position of the observation points may not be completely on the same observation plane. The initial observation elevation error of a point is zero, so the observation points of each point may be located on different horizontal observation planes. After observing the settlement elevation of the following n different settlement points, the settlement elevation of each point can be obtained, and the equation of the regression plane of each point is obtained and recorded as

According to the principle of least squares, the estimates of a, b, and c can be obtained such that the sum of squared errors is


Wavelet transform data
Because there are many factors that may cause settlement or deformation of these building bodies, at the same time, external environmental conditions also play a role. Therefore, the large-scale building fluid settlement model data collected through the actual noise observation may cover a lot of noise. These noises in the data may have a huge impact on the noise signals and their characteristic models obtained after the data collection. The settlement in the middle often may cause the results predicted by the noise analyzer to not fully meet the requirements, which brings a lot of trouble to the prediction of settlement and deformation. Therefore, one of the necessary conditions for noise prediction of wall settlement or deformation of a building is how to quickly remove these noises from the noise data obtained by the noise collector and extract all the required noise data. As a new type of signal processor, the wavelet transform data waver has comprehensive signal discrimination and processing functions, and has a wide range of applications in various fields.23,24 Because the high-frequency data obtained by observations are mostly discrete and harmonic, wavelet harmonic transformation has unique advantages for this discrete data processing method. By discretely processing each band of data at different signal frequencies, the effect of harmonics is reduced Noise, get authentic data. In addition, high-frequency wavelet transform denoising can not only effectively reduce the high-frequency noise existing in the original signal, but also make the noise waveband characterization of the signal better. Therefore, wavelet noise conversion noise denoising is a very important technical work for the deformation observation data processing and deformation monitoring and analysis of modern construction engineering sediments. This kind of deformation data analysis and processing method has developed as an important technical method for engineering deformation observation. 25
Data collection systems
The design of the data acquisition subsystem is based on the system software and hardware operating performance, instrument and equipment communication data port transmission protocols, data information transmission methods, and system data acquisition management strategies. 26 The software subsystem can be driven by the controller to complete massive database verification, structured file encoding and data encryption, secure data backup, automatic sampling rate and frequency control, and cloud-based management and upload of massive databases. The data center management subsystem itself is the “heart” of the management and control of the entire system. With the help of subsystems, the data center management database built in the “cloud” itself realizes operations such as system data management cloud interaction, unified data collection management and organization, and multi-user data concurrency, and supports distributed automatic processing and real-time data access, thus providing a reliable network data sharing and information storage management platform for other management subsystem users. The subsystem function of the intelligent deformation analysis trend is the “brain” of the entire system. Relying on the analysis model of the overall data processing of high-rise buildings, the data model of nonlinear intelligent measurement, and the mathematical analysis model of various intelligent prediction trends, the high-rise structure is realized. 27 The main contents of ultra-high-precision data analysis, pattern recognition, dynamic monitoring of structural deformation and damage, data mining, intelligent processing analysis, and structural deformation development trend analysis and prediction are included in the overall intelligent deformation of a building. Display system products are equipped with various types of visualization platforms to achieve a real-time, dynamic panoramic automatic display of measurement data. 28 The main function of the safety position assessment system module is to track the real-time safety of the dangerous source location in the main structure, perform precise safety positioning, and provide timely feedback through a large number of charts, documents, small reports, emails, text messages, and other methods to professional and technical personnel and security management personnel, which makes it convenient to deal with security issues in a timely manner.
The integrated data management subsystem is the core of system data visualization and management. 29 The user can view the data of all sensors through the management system and display the detection data in real time according to daily and monthly reports. For the analysis results of the big data platform, combined with the bridge expert assessment thresholds, all bridge health and safety statuses are displayed, prompt detection messages are issued for abnormal detection points, and the data alarm status returns to normal after verification by the operator. The analysis results are in the form of reports, graphics, and PDF files for download.
Experiments
Experimental settings
This experiment is based on sensor technology and uses microelectromechanical system (MEMS) inclination. Today’s MEMS-based inclinometers in different studies utilize sensors for different fields based on various measurement needs. In this study, a vertical sensor based on a MEMS accelerometer was used for building verticality monitoring. Therefore, a static MEMS acceleration sensor can measure both static acceleration and acceleration caused by gravity. In this case, a certain angle occurs between the static acceleration and the acceleration due to gravity. This angle actually corresponds to the inclination or so-called inclination of the sensor.
A wireless sensor node is not simply composed of a sensor and a radio frequency module, but is generally composed of a microcontroller unit (MCU), a radiofrequency module, a sensor, an analog-to-digital (ADC) conversion module, and an energy supply module. Generally speaking, the wireless sensor node is divided into four modules according to its functions: a processor module, a sensor module, a wireless communication module, and a power supply module. Among them, the processor module is responsible for coordinating the operation of the entire module, storing the collected data, and processing the node and the received data; the sensor module is responsible for data collection and conversion of the data needed in the area; the wireless communication module is responsible for the transmission of packaged data packets of the module between nodes; the power supply module is mainly responsible for providing the required energy for the operation of the entire node. Generally, it is powered by micro-batteries.
Experimental data and parameters
The traditional method for deformation monitoring data processing is to obtain information on the settlement and inclined deformation of the building by comparing the measurement results of each period of the settlement point. There are relatively mature methods and experience in data expression. According to the inclined deformation of the high-rise building, the whole deformation is controlled by the whole deformation, which is the settlement difference of the foundation along the longitudinal or transverse end points and the two points Distance ratio. However, the calculation deviation may be caused by performing the calculation only at the end point and ignoring the middle point. This article introduces two kinds of data processing methods about the tilt deformation: one is the linear regression model method with the participation of all observation points of the vertical or horizontal wall, wherein the slope of the regression line is the tilt of the wall; the other is the method of determining the tilt deformation of the building using the regression plane. In this method, a regression plane is determined using the settlement observation point coordinates which are arranged on the building foundation or the building wall approximately on a plane. If the elevation of the first observation data is set to zero, then the theoretical plane z = 0 is obtained; the plane equation of this period is obtained by the settlement of each point in the later period of plane regression. The angle between the plane equation and the theoretical plane of the first period is the overall inclination angle of the building. Both methods can eliminate the error of the calculation based on the feature points and reflect the whole tilt value of high-rise buildings more accurately. In this experiment, a total of 123 sensors are used. During the construction, the sensor lines are placed into the concrete, and after the later measurement, the sensors are directly placed into the building to avoid the damage of the building. In this experiment, a total of 86 observation maps and 53 real-time data generated by the software are collected, and these data are fitted to find out the general laws. Then, through the calculation and analysis of the building inclination angle in each period, the continuous deformation laws of the building inclination angle can be accurately obtained. It can provide a reliable scientific data analysis basis for the safety evaluation of buildings in each period and the disaster prevention and mitigation work of construction projects in each period. According to the quantitative statistical analysis, with the continuous increase of the building load, the cumulative amount of the main body settlement also increases. In a short period of time after the completion of the main building structure, the total cumulative amount of the main body settlement is basically stable. The total cumulative amount of the settlement at each point is shown in Table 1.
Total settlement scale of settlement observation points.

Because of the large number of floors of high-rise buildings, it is difficult to perform the measurements. And it is not easy to control the direction of the wall and the overall perpendicularity, unlike in low-rise buildings wherein it is easy to measure and observe. Because of these reasons, this system adopts many algorithms and new technologies for data storage, analysis, and display, such as data set coding and encryption; for example, unscented Kalman filter (UKF) and support vector regression (SVR) prediction models were used. First of all, because of the large span of the dynamic deformation information data set of super-high-rise buildings, it is necessary to normalize the sample data. Second, the SVR model is used to pretrain the normalized data and obtain the prior prediction estimation. Third, the prior prediction estimation is adjusted by the UKF model, and the experimental results of the two models are shown in Table 2.
Experimental results of two models.

RMSE: root mean square error; MAE: mean absolute error; MRE: mean relative error; UKF: unscented Kalman filter; SVR: support vector regression.
Principles and methods of settlement observation
Reasons for building settlement
The reasons for building settlement are as follows:
Construction error. In the construction of high-rise buildings, due to the existence of construction errors, the distribution of loads and prestresses is uneven. This phenomenon is more common.
Reasonable deformation of high-rise buildings. During the construction and operation of high-rise buildings, there is a phenomenon of uneven load distribution due to its own structure. The existence of this phenomenon will cause the deformation of high-rise buildings.
External factors. During the construction of high-rise buildings, the foundation soil is continuously compacted due to the continuous increase of the load, and the volume gradually decreases, causing settlement and deformation.
Principle of settlement observation
Settlement observation is most commonly used in deformation observation. In particular, settlement observation is the observation of continuous vertical displacement of observation points. The observation results are obtained in stages according to the specific characteristics of the project, as a basis for judging the reliability of the project implementation.
Settlement and deformation are particularly important in deformation observation, and their operations are relatively simple, but the requirements for accuracy are relatively high. Not only can it reflect the amount of settlement, but it can also be inferred to obtain the tilt angle of high-rise buildings and the angle of horizontal members. In the life cycle of a high-rise building from the beginning of construction, settlement always exists. As a kind of deformation, settlement is a normal phenomenon within certain limits, but if it exceeds the entire limit, it will affect the safety of high-rise buildings.
Settlement observation method
There are many methods of settlement observation. In the specific observation process, it is necessary to select appropriate methods according to the specific characteristics of the project. The commonly used methods mainly include leveling method, ground settlement monitoring station, GPS (Global Positioning System) technology, digital photogrammetry, and the trigonometric high-rise survey method.
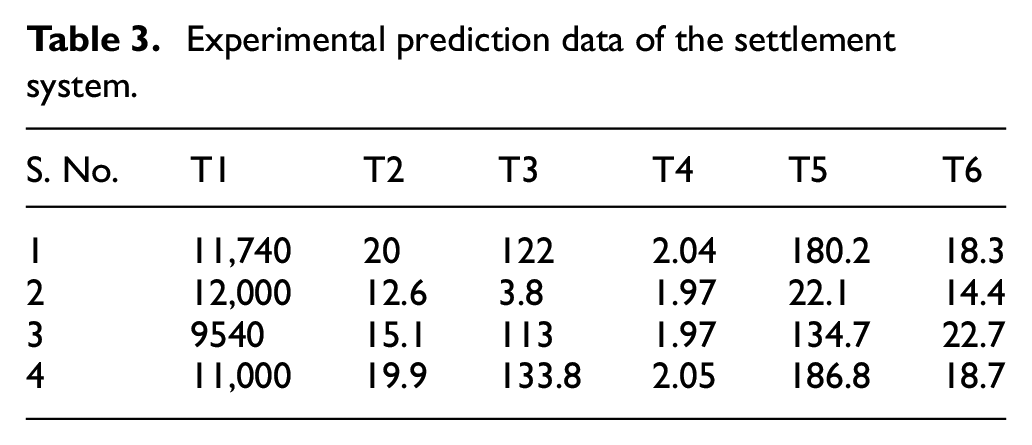
Based on the big data analysis technology, the ground settlement prediction system of high-rise buildings is observed, and the bottom of the building is enlarged by the sensor to measure the settlement of the high-rise buildings, as shown in Figure 2. The experimental data are collected through the data collection module, as shown in Table 3.
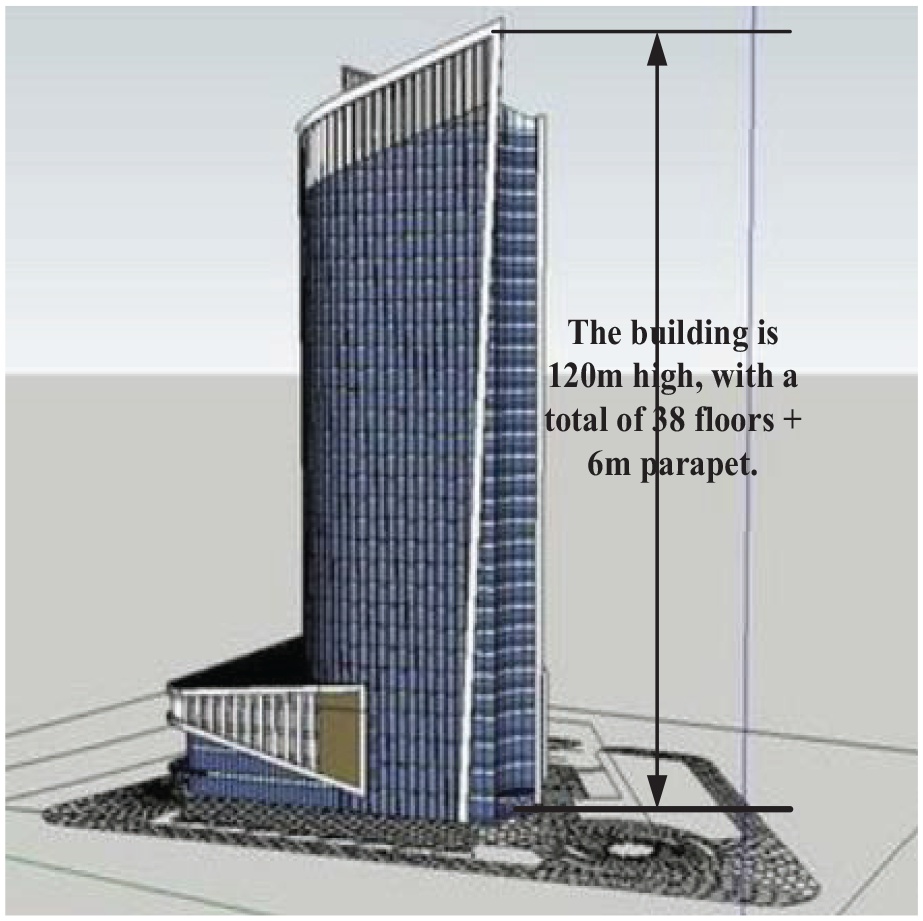
Settlement of high-rise buildings.
Experimental prediction data of the settlement system.
Discussion
High-rise building deformation monitoring technology
Real-time monitoring of high-rise buildings
Settlement and deformation of high-rise buildings may cause serious damage to the property and life safety. For high-rise buildings, settlement and deformation must have strict data indicators, and real-time monitoring, timely analysis and analysis of observation data, and prediction of future deformation and settlement dynamics, timely reinforcement and repair of hidden safety hazards, and ensure buildings Safety, guarantee the safety of people’s lives and property. Therefore, this article uses big data and artificial intelligence for high-rise building safety detection methods, presents a brief analysis of high-rise building settlement data processing and prediction, and briefly introduces several models of building settlement observation data processing and prediction method models, which will be helpful for the data processing and prediction of the settlement and deformation observation of high-rise buildings. Thus, the processing accuracy and prediction accuracy of the settlement observation data were improved. In addition to meeting the strength requirements, buildings should also meet the deformation conditions, especially the deformation conditions of buildings located on a soft ground are more important. Otherwise, the foundation will be deformed under heavy load and due to other factors, resulting in uniform or uneven settlement. Excessive deformation may endanger the safety of the building structure and affect the normal use of the building in the future. Especially when uneven settlement occurs, it may cause cracking of the main structure of the building and even cause serious consequences tending the building to fall. In order to prevent the building from cracking and destroying due to foundation deformation or uneven settlement and to ensure the normal use of the building, the deformation of the foundation, especially uneven settlement, must be monitored and controlled. Figure 3 shows the total settlement of high-rise buildings.

Total settlement scale of settlement observation points.
Feature extraction on the data set
The ultimate purpose of deformation observation is to analyze the reliable and detailed deformation data and judge the safety of buildings. Therefore, for a large number of scattered original observation data, data processing must be carried out first. Through adjustment processing, the accidental error and system error are further eliminated. Thus, the processed data are analyzed, it is judged whether the building is deformed, the relationships between the deformation and time, quality, wind speed, sunshine, and other factors are established, appropriate measures are taken to control the deformation development of the building, and 3D data maps are prepared for data prediction in several situations, as shown in Figure 4.

Building deformation prediction map.
Building model construction
Early warning information for monitoring experiments
This experiment is based on big data safety detection methods for high-rise buildings. During the simulation monitoring experiment, if the natural frequency vibration occurred under actual natural environmental conditions, the reversible tilt was man-made or abnormal. In order to ensure that the feedback signal data of the inclination sensor will not transmit wrong early warning information, this experiment uses a wavelet transform processing algorithm to reconstruct the data. After using the db3 wavelet to reconstruct the signal, the high and low frequencies of the signal are separated, and a smooth low-frequency signal curve is obtained. From the experimental data, it can be seen that the low-frequency signal curve can clearly show the angle changes of the building. The initial state and the changed state of the low-frequency signal can both allow the host computer to automatically calculate how many angle changes have occurred in the building. If the angle change value exceeds the national perpendicularity standard, an early warning message is sent to the monitoring manager, and the data of the early warning message are shown in the mathematical model established in Figure 5.

Early warning information.
Data acquisition coding and safe storage
In order to ensure the acquisition and transmission of effective data, speed up data storage and processing, and ensure data security, the data will be uniformly encoded and encrypted during the collection and transmission process. From the experimental data, it can be seen that each record occupies 64 bytes and is divided into a serial number field, a time field, a data field, and an information field. Figure 6 shows the data encryption information diagram and the data 3D model after data fitting.

Data encryption infographic.
Conclusion
The settlement and deformation observation of high-rise buildings in this article is a difficult and meticulous task. Based on the principle that can better reflect the building deformation, the proposed linear data processing method is more suitable for vertical or horizontal straight buildings. It is better to use plane regression when the structure is more complex and there are settlement observation points on the column inside the building. In the specific calculation, on one hand, it is necessary to ensure that there are sufficient observation points for settlement, especially on the lateral wall of the building. On the other hand, it is necessary to pay attention to the treatment of individual elevation anomalies, such as elevation anomalies caused by collision. The point should be deleted. Through the calculation of the inclination of each period, continuous inclination deformation can be obtained, which provides a reliable data basis for the safety evaluation of buildings, disaster prevention, and reduction of construction projects.
The wavelet transform proposed in this article can be used to detect the abnormal phenomena in the signal and display them. The wavelet transform adopts the changeable time window function; in the analysis of the unstable building inclination data signal, the long-time window function is used to separate the precise low frequency signal with the building transformation trend from it as the final early warning data judgment; through the short-time window function, the irregular high frequency mixed in the original acquisition signal is filtered out. Compared with the existing methods, the measurement accuracy of the building is improved, and the stability of the measurement is improved. With the application of wavelet transform, from the monitoring results, the change trend of the building’s perpendicularity can be directly observed, thus providing a reliable data basis for the final safety warning.
This article uses the theory of related algorithms as the support, uses big data and artificial intelligence technology for the analysis, and combines the building simulation framework for system experiments. In the monitoring system of wireless sensor networks, signal data processing algorithms are introduced. The data fed back by the sensor are analyzed and processed. On one hand, it gives the manager a more direct view of the actual tilt change curve; on the other hand, it eliminates the impact of noise signals generated in the environment on the early warning system. In the research reported in this article, the development status of the existing building verticality monitoring technology is analyzed first, and the shortcomings and deficiencies of the existing measuring methods are mentioned. Subsequently, in order to overcome these shortcomings, the most important wireless sensor network technology in the Internet of Things technology was applied to the verticality monitoring of buildings. The periodic automatic monitoring of the sensors has changed the existing building monitoring methods, thereby achieving better results with less effort.
Footnotes
Handling Editor: Yun-Lai Zhou
Declaration of conflicting interests
The author(s) declared no potential conflicts of interest with respect to the research, authorship, and/or publication of this article.
Funding
The author(s) disclosed receipt of the following financial support for the research, authorship, and/or publication of this article: This work was supported through the “Systematic Study of Prefabricated Buildings” grant of Sichuan Provincial Department of Education (No. 17ZA0371).