
Abstract
Both coverage and connectivity are important problems in wireless sensor networks. As more and more non-orientation sensors are continuously added into the region of interest, the size of covered component and connected component increases; at some point, the network can achieve an entire coverage and full connectivity after which the network percolates. In this article, we analyze the critical density in non-orientation directional sensor network in which the orientations of the sensors are random and the sensors are deployed according to the Poisson point process. We propose an approach to compute the critical density in such a network. A collaborating path is proposed with the sum of field-of-view angles of two collaborating sensors being π. Then a correlated model of non-orientation directional sensing sectors for percolation is proposed to solve the coverage and connectivity problems together. The numerical simulations confirm that percolation occurs on the estimated critical densities. It is worth mentioning that the theoretical analysis and simulation results give insights into the design of directional sensor network in practice.
Keywords
Introduction
Past decades have witnessed the rapid development of sensor technology, a large number of tiny, low-powered sensors consist of wireless sensor networks (WSNs), in which sensors communicate with each other over multi-hop wireless links for monitoring the region of interest.
Many applications of WSNs need the surveillance, location and positioning being executed by directional sensor nodes, for example, camera sensors, multimedia sensors, infrared sensors, ultrasonic sensors, and radar sensors in the interested region. Different from traditional omnidirectional sensors, directional sensors can capture more accurate information under a specific field-of-view angle. To sense a region of interest by selecting an optimal field-of-view angle and achieve the sensed data from sink, it is necessary that both sensing coverage and network connectivity be maintained in directional sensor networks.
Generally, sensing coverage represents the quality of surveillance of the monitored region; on the other hand, network connectivity is a graph-theoretic concept which guarantees the sensing data transmitting to sink. To get the monitored data of the region, both sensing coverage and network connectivity need to be maintained. Some recent reviews on different issues of coverage and connectivity in a general sensor network are found in previous studies1–4 and in directional sensor networks are found in Khanjary et al.5,6
Due to the rapid needs in surveillance provided by video sensors, more and more directional sensors are deployed in the monitored area. The size of covered area increases with the deployment of directional sensors, at some moment, a single large covered area spans the entire network from small fragmented covered areas, which is called the sensing coverage phase transition (SCPT). Likewise, the number of connected components increases as more and more directional sensors are deployed in the network; at some moment, a single large connected component spans the entire network from small fragmented connected components, which is called the network connectivity phase transition (NCPT). The phase transitions in sensing coverage and network connectivity appear at a given density which is called critical density. One of the main challenges of the coverage and connectivity in directional sensor networks is to find a certain density of sensors above which an infinite covered component and an infinite connected component span the entire network. Percolation-based approaches have been considered as a rigorous mathematical method to solve the issue in recent years.
Furthermore, with the explosive growth in the number of mobile devices (e.g. smartphones, smartwatches, smartglasses), a large quantity of sensors (e.g. gyroscope, camera, global positioning system (GPS), compass, accelerometer) mounted on mobile devices are available for information sensing, which gives rise to a newly emerged sensing paradigm, mobile crowdsensing (MCS). 7 MCS outsources the collection of sensing data to a crowd of mobile device users. The coverage and connectivity provided by traditional static WSNs can be enhanced greatly by the introduction of MCS. In this article, we focus on non-orientation directional sensor network in which the orientations of the sensors are random and propose an approach to compute the critical density for sensing coverage and network connectivity in such directional sensor networks for the sum of field-of-view angles of two collaborating sensors being π through continuum percolation. We introduce a model on percolation in such networks solving sensing coverage and network connectivity problems together.
The remainder of this article is organized as follows: section “Related work” presents related work and details the contributions of the article. Section “System model” describes the related model and some preliminaries. Critical density in non-orientation directional sensor networks is computed in section “Critical density in non-orientation directional sensor networks.” Section “Simulation and results” presents the simulation results. Finally, section “Conclusion” concludes the article.
Related work
When continuum percolation was put forward by Gilbert in 1961, 8 Gilbert’s model for calculating for critical density of the Poisson point process (PPP) at which an unbounded connected component almost surely spanned among the network has been adopted to study continuum percolation in wireless networks. Researchers have adopted percolation theory to examine coverage and connectivity in sensor networks too.
Ammari and Das 1 proposed a percolation-based model integrating coverage and connectivity together to consider the critical density in omnidirectional homogeneous sensor networks where sensors had communication radius R and sensing radius of r. They analytically proved that the value of critical density for both SCPT and NCPT was 0.575. Then, they extended their contribution to 3D sensor networks under sphere sensing model. 9 Researchers have adopted percolation models in Ammari and Das1,9 to achieve energy-efficient topology controlling in terms of coverage and connectivity in homogeneous omnidirectional two-dimensional (2D) and three-dimensional (3D) sensor networks. Khanjary et al. 5 calculated the estimated critical density in aligned-orientation directional sensor networks. They were interested in finding the excluded area to compute the critical density. They confirmed that the percolation occurred at the estimated critical density. Li et al. 2 proposed a percolation-based coverage and connectivity combined (PCCC) model to obtain the critical density through a more accurate calculation of excluded area in directional sensor networks where sensors were assigned to determined field-of-view angles altering between 0 and 2π. Li et al. 10 extended our contribution to random channels; moreover, we analyzed the relationship between critical density and transmit power which gave insights into the design of directional sensor networks in practice.
Khanjary et al. 6 considered intrusion detection applications in a randomly deployed homogeneous directional sensor network consist of sensors with field-of-view angles between 0 and π. They designed a cellular automata-based algorithm to achieve percolation in the network. Then they 11 extended their contributions to adjustable-orientation directional sensor networks with field-of-view angles between 0 and 2π and got the critical density to prepare barrier coverage.
Sadhukhan and Rao 12 studied the connected coverage problems in a rare-event detection homogeneous WSNs where the sensors were distributed in a circular-shaped field and calculated the critical density satisfying given e-delay constraint. Wang et al. 13 proposed an information-based coverage model combining collaboration of sensors with spatial correlation of physical phenomena to consider the critical density in randomly deployed sensor networks. Xing and Wang 14 studied the proper time of redeploying sensors to replace the failed nodes to maintain connected coverage in a large WSNs. They gave the theoretical upper bound of the latest time for node redeployment. Rai and Daruwala 15 proposed algorithms to estimate the optimum density of sensors for desired coverage under deterministic and probabilistic sensing models in randomly deployed practical WSNs which could be used to design and implement in any practical WSNs. Tomar and Singh 16 proposed a coverage and connectivity aware protocol in WSNs to get the expected coverage rate by periodically rebuilding a backbone of relay nodes.
Some researchers studied connected coverage problems in 3D WSNs. Gupta et al. 17 derived k-coverage and m-connectivity probabilistic expressions in 3D heterogeneous WSNs where the sensors were randomly deployed with directional sensing capacity. Sangwan and Singh 18 detected coverage holes under different kinds of packing in 3D WSNs and healed the coverage holes by choosing an appropriate pattern from topological structure, or accurate radii ratio at the initial deployment for sensors. They proved that cheaper heterogeneous sensors were useful to heal the coverage holes when costs were limited. Al-Karaki and Gawanmeh 19 proposed a convolution-based queuing model and a heuristics algorithm to solve the connected coverage problems in a virtual grid architecture 3D WSNs. They scheduled the minimum active sensors maintaining k-connectedness in the network to enhance network lifetime. Kang et al. 20 mapped the exposure-path prevention problems in 3D omnidirectional sensor networks into a 3D uniform lattice. They computed the lower and upper bounds of critical density by the proposed bond percolation model and got the tighter bounds of critical density in 3D WSNs.
However, from the above literatures, we conclude that most existing percolation-based schemes and algorithms for solving connected coverage problems cannot be applied to non-orientation directional sensor network where the orientations of the sensors are random.
The main contributions of this article are as follows: we consider the critical density in non-orientation directional sensor network where the sensors have directional sensing ability and are deployed in the region of interest according to PPP. We propose collaboration path based on the initial sensing sector and the collaborated sensing sector with the sum of field-of-view angles of two collaborated sensors being π. We calculate the critical density for sensing coverage and network connectivity in non-orientation directional sensor network. Also, we present a correlated model of non-orientation directional sensing sectors for percolation in non-orientation directional sensor network to solve the SCPT and NCPT problems together.
System model
System model
The network model considered in this article consists of multiple stationary non-orientation directional sensors coexisting in the
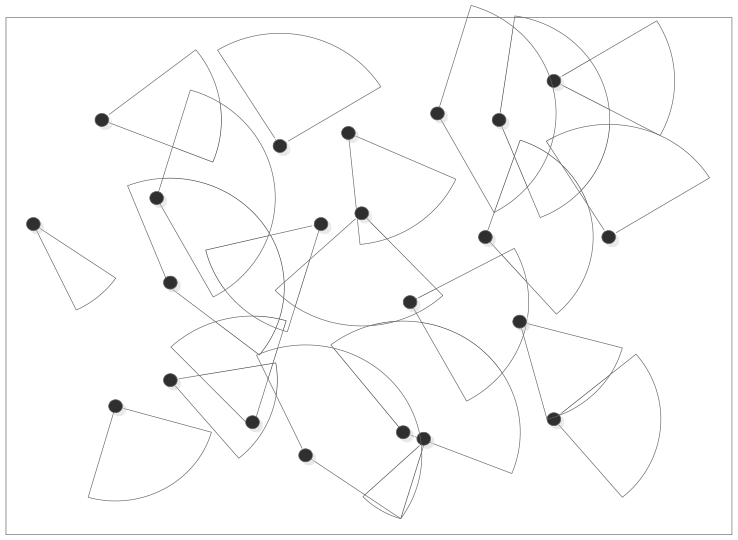
Directional sensors with different sensing orientations.
Definition 1 (spatial PPP)
Assuming xλ be a random variable representing the number of points in region A, then the probability that there are K(K ≥ 0) points inside A can be computed as

where λ is the sensor density distributed in per unit area and |A| is the area of region A.
Definition 2 (sensing model of directional sensor)
The sensing range (Figure 2) of a directional sensor i is defined by a tuple Si(ξi,
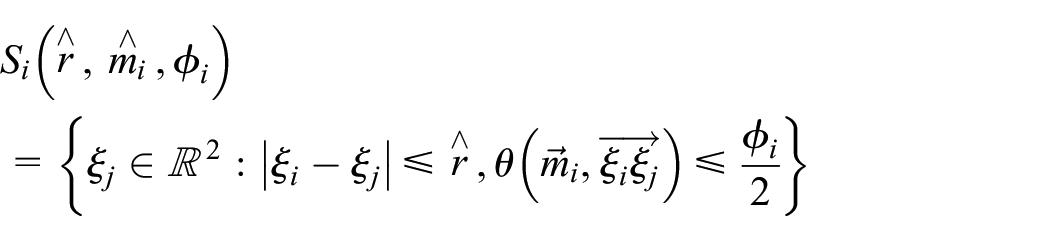
where ξi is the center of the directional sensor Si, the sensing radius is represented by

Sensing model of directional sensor.
Definition 3 (communication model of directional sensor)
The communication model (Figure 3) of the directional sensor is defined by

where R is the communication range of the directional sensing sectors.

Communication model of directional sensor.
Definition 4 (collaborating and communicating sensors)
Sensors Si and Sj collaborate on the condition that if and only if the Euclidean distance between the centers of the two-directional sensing sectors satisfies |ξi – ξj| ≤ 2r, that is, the two-directional sensing sectors are tangent or overlapping (as shown in Figure 4(a)). A set of sensors that are collaborated is denoted by Col(si)

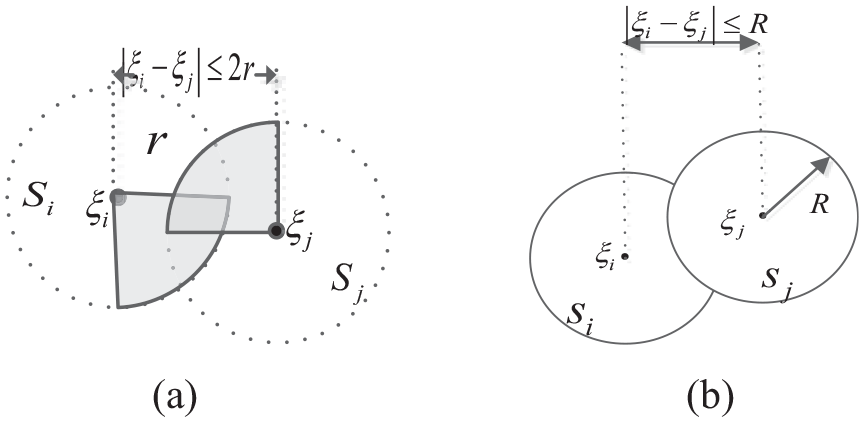
(a) Collaborating sensors and (b) communicating sensors.
The condition in which the two sensing sectors Si and Sj communicate is that the Euclidean distance between the centers of the two-directional sensing sectors satisfies |ξi – ξj| ≤ R (as shown in Figure 4(b)). A set of directional sensing sectors for communicating is denoted by Com(si)

Definition 5 (collaboration and transmission path)
The collaboration path between two-directional sensing sectors Si and Sj is a sensor sequence,

(a) Collaboration path between non-orientation directional sensing sectors and (b) transmission path between non-orientation directional sensing sectors.
Definition 6 (filling factor). 21
If an object has an area of a, the filling factor of a PPP with density equal to λ is denoted by

where
Percolation model
When Broadbent and Hammersley introduced percolation model to the disordered mediums, discrete percolation model and continuum percolation model have been used to describe the phase transitions in network. In discrete percolation, the sites of the model may have different tessellations, such as square, triangle, honeycomb, and so on. However, in continuum percolation, the positions of sites are randomly distributed then there is no need to have a different analysis for each of the lattices. In continuum percolation, the value of critical density λc at which an infinite or large clump of overlapping objects first appears spanning the entire network is very important in the network. When λ < λc, there exist no such clump of overlapping objects in the network, when λ > λc, the percolation appears in the network. In this article, we consider a continuum percolation model consists of non-orientation directional sensors whose centers are randomly distributed in
Critical density in non-orientation directional sensor networks
Critical density for sensing coverage in non-orientation directional sensor networks
1. The longest side of the base circle
When the sum of the initial sensing sector and the following collaborating sensing sector is π, the collaboration path between non-orientation directional sensors is constructed. Figure 6 gives examples for collaboration path under the field-of-view angles of initial sensors being π/6, π/3, and π/2, respectively.

Examples for collaboration path in non-orientation directional sensor networks.
When the non-orientation directional sensors collaborate, a set of sensing sectors is said to be a covered component, if there are k sensing sectors in the collaboration path, the covered component is said to be a covered k-component. 1 When continuum percolation occurs, the covered k-component becomes to be a base circle, of which if more than one objects completely put inside the objects overlap each other.
Figure 7 shows an example of the base circle. The longest side of the base circle, denoted by l(ϕ, r), can be computed using the law of cosine as


Base circle with field-of-view angles being π/6 and 5π/6.
Without loss of generality, we can form the base circle in non-orientation directional sensor networks using two sensing sectors under different field-of-view angles of initial sensing sector. When the base circle appears, due to the sensing sector with a bigger field-of-view angle has a bigger length of gap filled by other sensing sectors, we can get the longest side of the base circle using formula (1) under the bigger field-of-view angle in the two collaborating sensing sectors. Thus, the longest side of the base circle l(ϕ, r) can be denoted by

By dividing equation (3) to r, the coefficient α(ϕ) is computed by

2. Characterization of critical percolation
The equation characterizing a set of covered k-components at critical percolation is given as follows 6

where μ is denoted by

where φ is the filling factor of the sensing sector in Definition 6.
Then the function g(φ, φ, α, k) in non-orientation directional sensor networks can be computed as follows
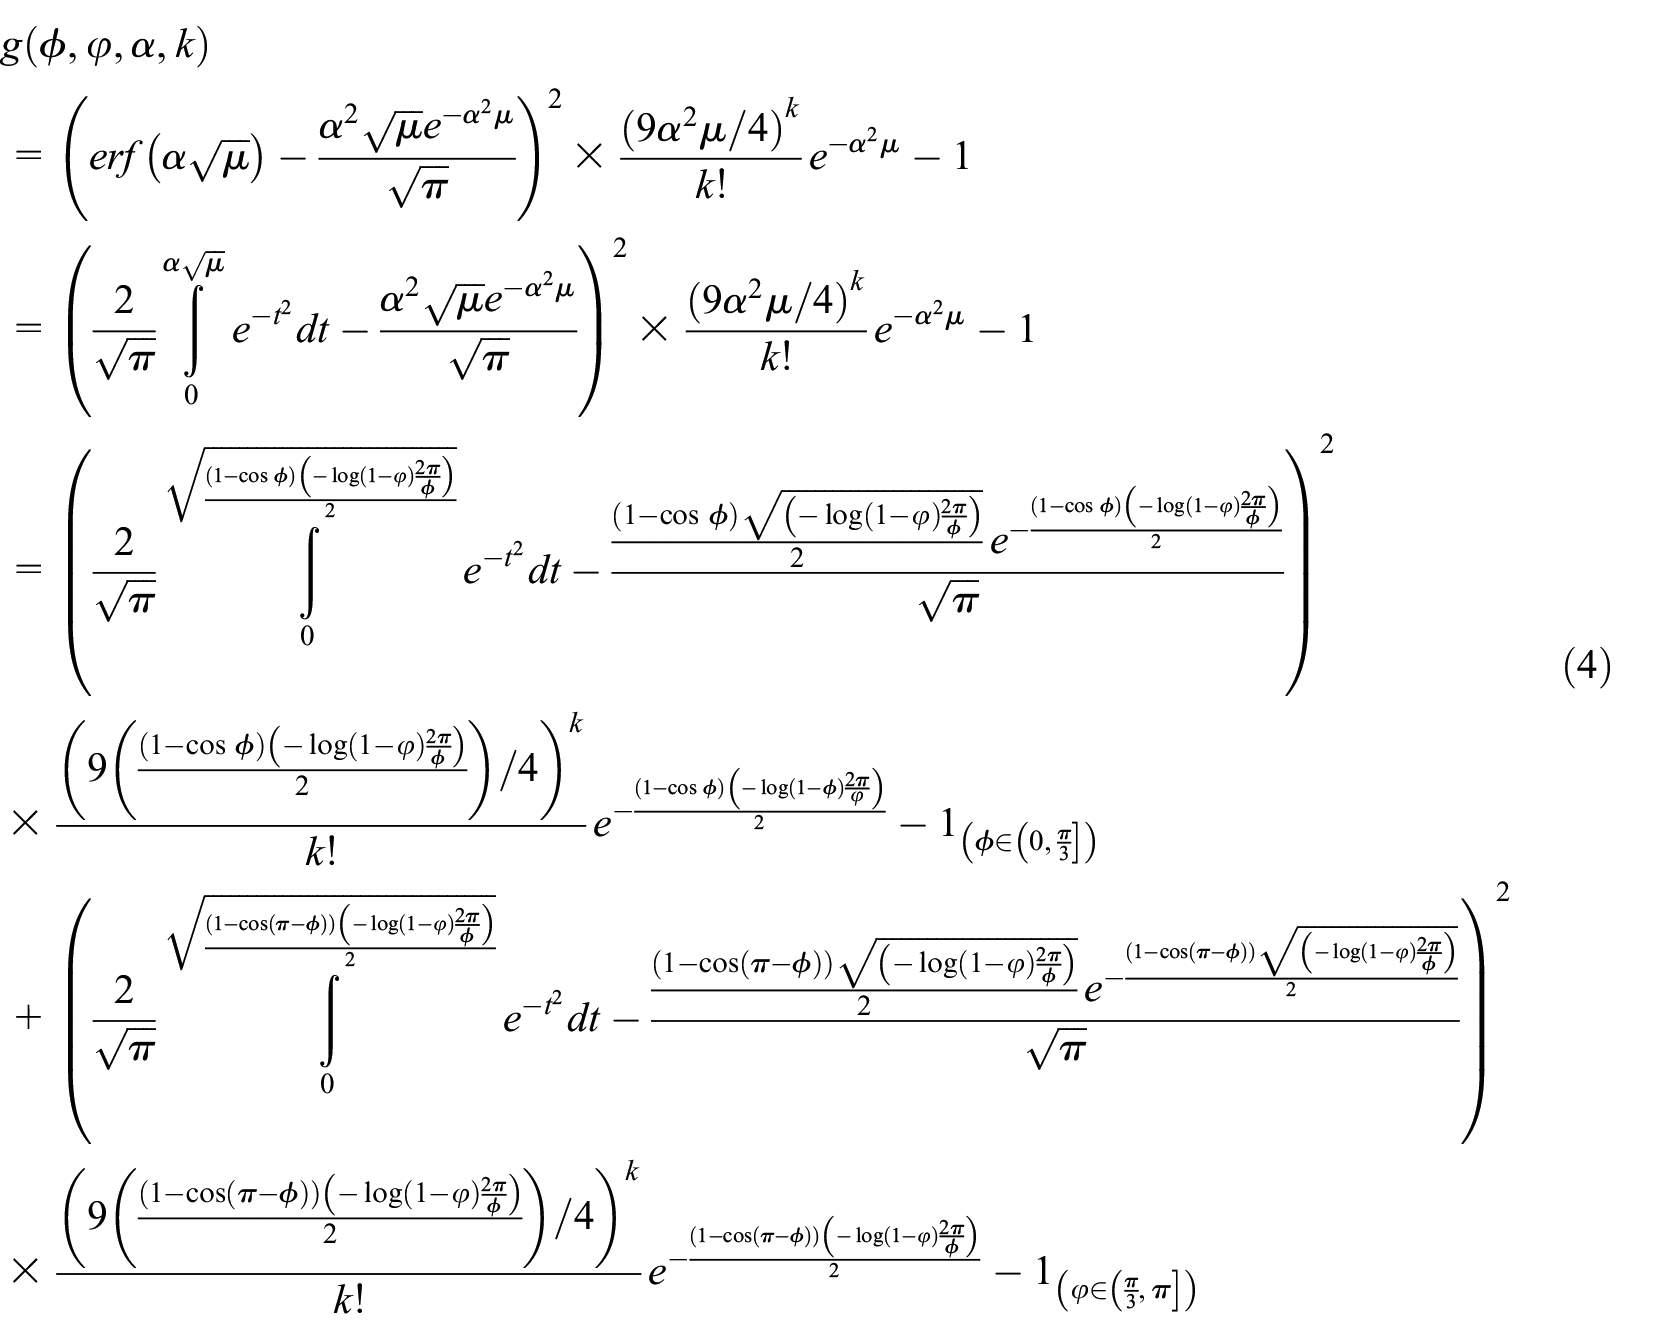
When the function g(φ, φ, α, k) equals to 0, continuum percolation appears in the non-orientation directional sensor networks, then the network can achieve an entire coverage in the network from small fragmented covered components.
3. Numerical results
Let xλ be a 2D PPP of density λ, where λ is the number of non-orientation sensors per unit area. In non-orientation directional sensor networks, assuming a set of initial sensing sectors with field-of-view angles being ϕ = π/12, ϕ = π/6, ϕ = π/4, ϕ = π/3, ϕ = π/2, ϕ = 2π/3, ϕ = 3π/4, we can get the numerical plots for k = 1, 2, and 3 for g(φ, φ, α, k) in Figures 8–14.

Results of function g(ϕ, φ, α, k) with initial sensing sectors under field-of-view angles being ϕ = π/12.

Results of function g(ϕ, φ, α, k) with initial sensing sectors under field-of-view angles being ϕ = π/6.

Results of function g(ϕ, φ, α, k) with initial sensing sectors under field-of-view angles being ϕ = π/4.

Results of function g(ϕ, φ, α, k) with initial sensing sectors under field-of-view angles being ϕ = π/3.
Results of function g(ϕ, φ, α, k) with initial sensing sectors under field-of-view angles being ϕ = π/2.

Results of function g(ϕ, φ, α, k) with initial sensing sectors under field-of-view angles being ϕ = 2π/3.
Results of function g(ϕ, φ, α, k) with initial sensing sectors under field-of-view angles being ϕ = 3π/4.
Figure 8 shows that when the field-of-view angle for initial sensing sector is π/12, for k ≥ 2, the function g(ϕ, φ, α, k) reaches 0 and the filling factor approximately equals to 0.1. Figure 9 shows that when the field-of-view angle for initial sensing sector is π/6, for k ≥ 2, the function g(ϕ, φ, α, k) reaches 0 and the filling factor approximately equals to 0.2. Figure 10 shows that when the field-of-view angle for initial sensing sector is π/4, for k ≥ 2, the function g(φ, φ, α, k) reaches 0 and the filling factor approximately equals to 0.2. Figure 11 shows that when the field-of-view angle for initial sensing sector is π/3, for k ≥ 2, the function g(φ, φ, α, k) reaches 0 and the filling factor approximately equals to 0.3. Figure 12 shows that when the field-of-view angle for initial sensing sector is π/2, for k ≥ 2, the function g(ϕ, φ, α, k) reaches 0 and the filling factor approximately equals to 0.5. Figure 13 shows that when the field-of-view angle for initial sensing sector is 2π/3, for k ≥ 2, the function g(ϕ, φ, α, k) reaches 0 and the filling factor approximately equals to 0.6. Figure 14 shows that when the field-of-view angle for initial sensing sector is 3π/4, for k ≥ 2, the function g(ϕ, φ, α, k) reaches 0 and the filling factor approximately equals to 0.6. We can find that in Figures 8–14, when the number of collaborating sensors in a covered k-components is larger than 2(k ≥ 2), almost surely an infinite covered component spanning the entire network will appear, and then at least an initial sensing sector and a collaborating sector exist in base circles.
4. Critical density of directional sensing sectors at percolation
In this section, we discuss how to obtain the critical density of directional sensing sectors at percolation. When the collaboration path is constructed, there exists a minimum area, which is defined as the excluded area 〈aex〉, round the initial sensing sectors, where the center of collaborating sensing sector cannot enter in order to avoid the overlapping of the two sensing sectors. The excluded area of a shape can be achieved by moving one around the other and registering the center of the moving shape. 22 The total excluded area 〈Aex〉 is the excluded area multiplied by critical density λc, which is denoted by

Next, we calculate the excluded area 〈aex〉, taking initial sensing sectors under field-of-view angles being ϕ = π/6 for example.
As shown in Figure 15, the excluded area 〈aex〉 has approximated a hexagon; the area of 〈aex〉 can be computed as

The excluded area 〈aex〉with initial sensing sectors under field-of-view angles being ϕ = π/6.
At the moment of percolation, the total excluded area is must be 4.5; 23 then the density of directional sensing sectors at percolation can be computed as

Then we can get the critical density under different field-of-view angles of initial sensing sectors according to the formula in Table 1.
Filling factors and critical density under different field-of-view angles.

Critical density for sensing coverage in non-orientation directional sensor networks
Multiple stationary non-orientation directional sensors coexist in the
Integrated sensing coverage and network connectivity for network connectivity in non-orientation directional sensor networks
In this part, a correlated model of non-orientation directional sensing sectors is considered to analyze the critical density at percolation. In this model, each sensing sector with the field-of-view angles ϕ is associated with a communicating disk of radius R and a collaborating sector of radius r which are concentric. Figures 16–18 show the correlated model with initial sensing sectors under field-of-view angles being ϕ = π/6, ϕ = π/3, and ϕ = π/2 for example.

Maximum distance of two collaborating sensing sectors with initial sensing sectors under field-of-view angles being ϕ = π/6.

Maximum distance of two collaborating sensing sectors with initial sensing sectors under field-of-view angles being ϕ = π/3.

Maximum distance of two collaborating sensing sectors with initial sensing sectors under field-of-view angles being ϕ = π/2.
As it is shown in Figures 16–18, when two-directional sensing sectors collaborate, there are communicating path between them, the maximum distance between two sensing sectors is 2r regardless of the field-of-view angles of initial sensing sectors. In other words, when sensing coverage percolates, a single large connected component is established too. Then we can get the radius of communicating disk R = 2r, when R ≥ 2r, the network is guaranteed to be connected. 23
Simulation and results
Simulation assumptions
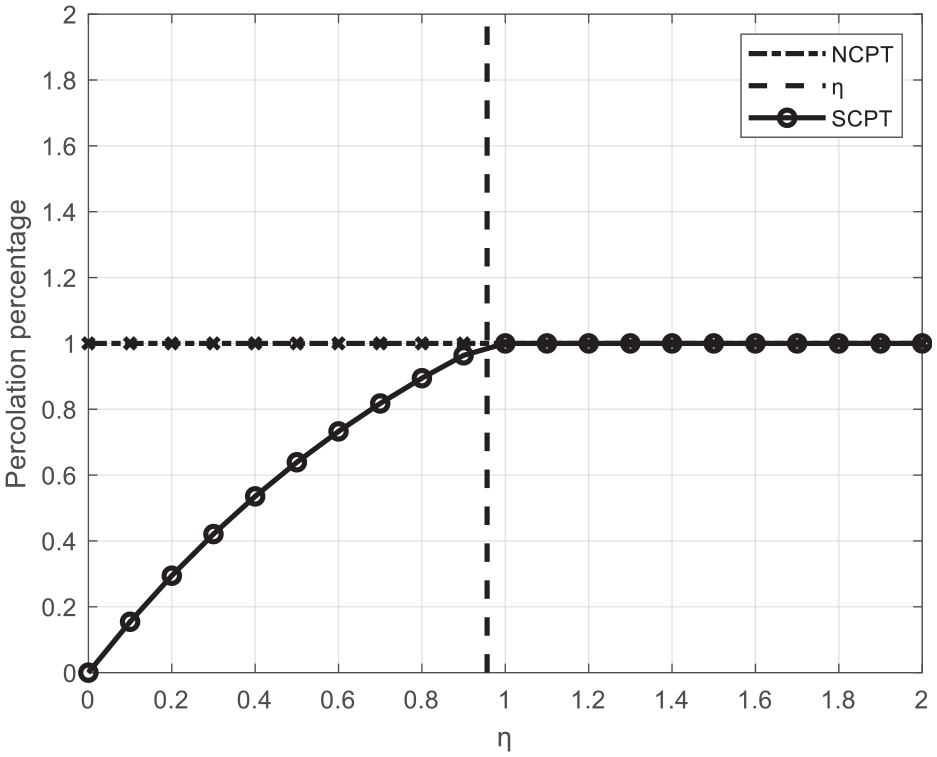
The percolation transition is simulated in this part under different field-of-view angles for initial sensing sectors under the condition of ϕ = π/12, ϕ= π/6, ϕ= π/4, ϕ= π/3, ϕ= π/2, ϕ= 2π/3, ϕ= 3π/4. The size of the region of interest is set to be 100 × 100, the radius of sensing sectors is set to be 1, the radius for communicating sensors is set to be R = 2r, λ is set to be 0.1 and the simulation is repeated 500 times for every step, the results for SCPT and NCPT are shown in Figures 19–25, in all results, the dotted vertical line shows the calculated critical densities under different field-of-view angles by equation (7).

Simulation results for non-orientation directional sensor networks with initial sensing sectors under field-of-view angles being ϕ = π/12.

Simulation results for non-orientation directional sensor networks with initial sensing sectors under field-of-view angles being ϕ = π/6.

Simulation results for non-orientation directional sensor networks with initial sensing sectors under field-of-view angles being ϕ = π/4.
Simulation results for non-orientation directional sensor networks with initial sensing sectors under field-of-view angles being ϕ = π/3.

Simulation results for non-orientation directional sensor networks with initial sensing sectors under field-of-view angles being ϕ = π/2.

Simulation results for non-orientation directional sensor networks with initial sensing sectors under field-of-view angles being ϕ = 2π/3.
Simulation results for non-orientation directional sensor networks with initial sensing sectors under field-of-view angles being ϕ = 3π/4.
Results
As it is shown in Figures 19–25, the percolation for sensing coverage under different field-of-view angles of initial sensing sectors almost occurs on or close to the computed critical densities in Table 1 under different field-of-view angles of initial sensing sectors under the condition of ϕ = π/12, φ = π/6, φ = π/4, φ = π/3, φ = π/2, φ = 2π/3, φ = 3π/4, at the same time, network connectivity is maintained almost surely under arbitrary field-of-view angles of initial sensing sectors. It is worth noting that both values of critical densities for sensing coverage and network connectivity represent only lower bounds. In other words, if the actual density of directional sensing sectors is higher than ηc, almost surely there exists an infinite covered component that spans the entire network. We can find that the critical density improves with the increase of the field-of-view angles, which means that we can get a larger spanning clump in the network to achieve both coverage and connectivity when the field-of-view angle increases. The values of filling factors at critical densities in Table 1 are close to the values simulated in Figures 8–14, which proves the calculation for critical densities by equation (7) is correct.
Finally, we compare critical densities calculated by the proposed model with the work in Khanjary et al. 5 We select 5 for comparison because it considers critical density and assumes that the sensors are deployed according to a spatial PPP where the sensors have aligned orientations after deployment and the field-of-view angles are between 0 and π. Figure 26 shows that the critical density increases with the increase of field-of-view angle of sensors. The two figures intersect when the field-of-view angle of sensors equal to 2π/5. It can be concluded that when the field-of-view angle of sensors is smaller than 2π/5, heterogeneous sensors can be deployed under the guidance of the proposed model instead of deployment of homogeneous aligned-orientation sensors by a lower density. Thus, we observe that the proposed analysis in this work leads to a more practical design for sensor deployment with lower limitations in orientations for directional sensors.

Comparison of critical densities between our proposed model and aligned-orientation model.
Conclusion
In this article, the critical density for SCPT and NCPT in non-orientation directional sensors with different field-of-view angles is analyzed, where the directional sensors are distributed in the region of interest according to PPP. We propose a collaboration path based on the initial sensing sector and the collaborated sensing sector with the sum of field-of-view angles of two collaborating sensors being π. Then through the proposed correlated model for percolation in non-orientation directional sensor network, we calculate the critical density and solve the SCPT and NCPT problems together.
We first obtained the percolation conditions for coverage and then derived the percolation conditions for connectivity based on the correlated model. We calculated the critical density by approximating the excluded area as a hexagon. The simulation results verified that percolation occurs on or close to the estimated critical densities. We compared critical density computed by our model with the model in aligned-orientation homogeneous directional sensor network, the simulation result sheds light on the design of practical directional WSNs.
Our future work will extend this analysis to non-orientation directional sensor network where the sensors are deployed according to more general distribution. We also plan to extend this study to 3D directional sensor network.
Footnotes
Handling Editor: Ted Brown
Declaration of conflicting interests
The author(s) declared no potential conflicts of interest with respect to the research, authorship, and/or publication of this article.
Funding
The author(s) disclosed receipt of the following financial support for the research, authorship, and/or publication of this article: This work was supported by the Shanxi province Foundation for Excellent Returnees under grant no. 201802, Key Research and Development Projects of Shanxi Province under grant nos 201903D321012 and 201903D121139, and Natural Science Foundation of Shanxi Province under grant no. 201801D121130.