
Abstract
This article aims to provide an efficient fault diagnosis method for gearbox. A self-organizing map–based fault model is developed to provide effective diagnosis of the faults of gearboxes using the gear signals extracted from gearboxes operating with zero and three different types of faults. The gear signals are collected by vibration and acoustic sensors, and pre-denoised using wavelet denoising and wavelet packet decomposition. The characteristic values are subsequently obtained using fast Fourier transform and infinite impulse response filtering. The results showed of the self-organizing map neural network diagnosis model can effectively diagnose gear fault information with a 95% diagnostic accuracy using four input characteristic values: (1) Y-axis vibration displacement amplitude, (2) Y-axis vibration acceleration amplitude, (3) acoustic emission energy amplitude, and (4) acoustic emission signal peak value. The proposed approach provides a novel method to more accurate diagnosis of gear fault pattern and improvement of working efficiency of mechanical instruments.
Introduction
Gearboxes have been widely used in modern mechanical instruments as the key transmission components for change of speed and transmission of power. In transmission system, gearbox failure accounts for 78% of the total failures. 1 A faulty transmission system could result in heavy losses to the company or serious labor injuries. Therefore, predictive diagnosis of gearbox fault that provides effective detection of potential failure mode of the gearbox system prior to the accident is crucial for ensuring reliable operation and higher efficiency of the mechanical system.2,3
The diagnosis of gearbox fault has been studied extensively by many domestic and foreign scholars. Lei et al. 4 summarized the characteristics of faulty planetary gearbox vibration signals by collecting these signals from ordinary, solar, and planetary gear systems and comparing them with simulation results. Liu et al. 5 proposed a characteristic value extraction method of gear fault based on the envelope analysis and time–frequency image of S transformation. The method was validated against fault simulations. Yang et al. 6 proposed a method of gear fault diagnosis based on multiscale fuzzy entropy of ensemble empirical mode decomposition (EEMD). The gear faults are diagnosed by first extracting a complexity metric in different scales of the original signal, and then putting them into a least square support vector machine (LS-SVM) as characteristic values. Seokgoo and Joo-Ho 7 propose a convolutional neural network method based on the signal segmentation, which is to divide the original signal into those at each tooth of the gear. The effectiveness of the method is validated by the data made from the gearbox test rig, in which the vibration and transmission errors are measured, respectively. Zeng et al. 8 diagnosed different faulty gear signals using general singular value decomposition (SVD)-based subspace noise reduction algorithm. Yongzhi et al. 9 proposed a fully unsupervised feature extraction method for “meaningful” feature mining, named disentangled tone mining, which can effectively extract the hidden “trend” associated with machinery health state. Dennis et al. 10 introduce the combined use of the residual method and general linear chirplet transform using acoustic and vibration measurements from a single stage spur gearbox. Xihui et al. 11 proposed a fault diagnosis method for planetary gears based on the entropy feature fusion of dual-tree complex wavelet transform (DTCWT) and optimized kernel Fisher discriminant analysis (OKFDA). Liming et al. 12 proposed a new optimal demodulation subband selection method (ODSSM) for fault diagnosis of planetary gearbox, that can detect the gear fault in both simulation and experiment signals, and achieves improved demodulation performance than the other two methods. Ling et al. 13 proposed a method of incipient fault feature enhancement based on the wavelet packet and the minimum entropy deconvolution (MED), and the vibration signal of the gearbox containing the incipient fault is decomposed by the wavelet packet, and the decomposed band is reconstructed to eliminate the noise component which is the initial enhancement of the fault feature. Liu et al. 14 proposed a feature extraction and fault diagnosis method based on the variational mode decomposition, SVD, and convolutional neural network for the local weak feature information of planetary gears.
So far, some studies have explored gear fault diagnosis using a variety of signal fusion methods,15,16 but the denoising effect of the signal is not obvious, resulting in inaccurate extraction of eigenvalues. Such an approach suffers from the drawback of low accuracy of the characteristic value extraction and long operating time due to the absence of signal fusion and poor performance of denoising, so there will be inefficient diagnosis, low diagnostic rate, and other issues. This article proposed a comprehensive method for diagnosing gear fault using both vibration and acoustic signals. This article used Daubechies 5 (db5) wavelet function to denoise the collected vibration signal and acoustic emission signal, and using wavelet packet decomposition to decompose the signal. The characteristic values were obtained by using fast Fourier transform (FFT) to transform the signal in the selected area and using infinite impulse response (IIR) method to filter it. The gear faults were diagnosed using identification mapping based on the self-organizing map (SOM) neural network, which improves the recognition accuracy by 10%∼20%.
Experimental method for fault diagnosis
Signal acquisition device
The experimental setup for fault diagnosis is composed of inverter, motor, belt drive system, gearbox, and signal acquisition device. The vibration signal system comprises three vibration sensors (one for each axis X, Y, and Z), a signal modulator (SIRIUS constant current source module is used to adjust the vibration signal vibration transmitter), and a data acquisition system (DEWE software).The range of XZD-YB vibration sensor is 0∼20 mm/s, the sensitivity is 20 mV/mm/s ± 5%, and the linearity error is ±1%. The acoustic signal acquisition system consists of SR150N acoustic emission sensor, preamplifier, acoustic emission acquisition device, and PC signal analysis system. The peak sensitivity of SR150N acoustic emission sensor is more than −65 dB, and the working frequency is 22–220 kHz. The arrangement of the sensors is shown in Figure 1.
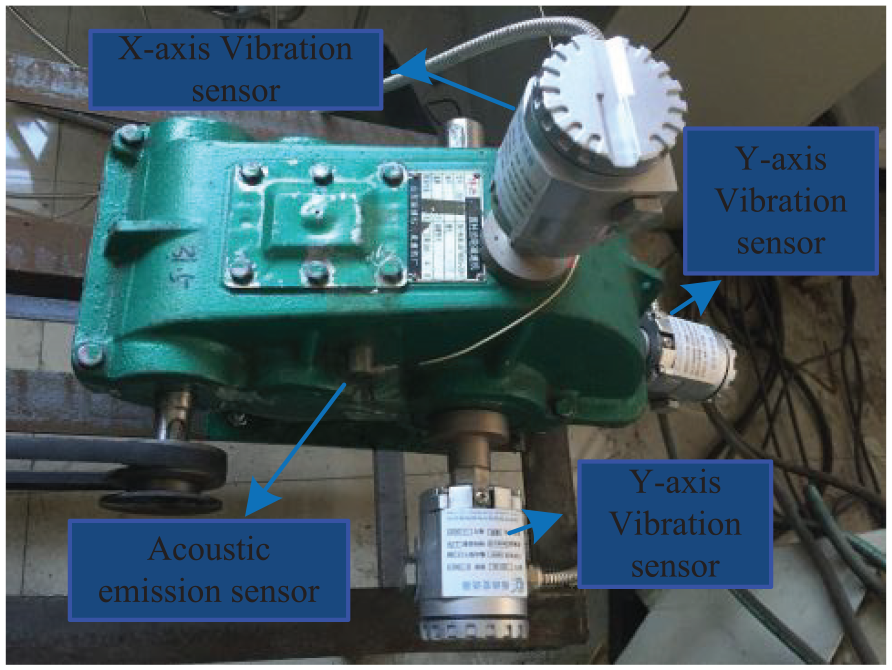
Distribution of sensor of measuring points.
Mode of the gearbox fault
The gearbox is the key component in the experiment setup. The transmission gear of JZQ250 reducer is selected in the experiment. It has a transmission ratio of 31.5:1. The pulley ratio is 1. The gear ratio of the two gear sets are 85/14 and 83/16, respectively. The motor provides power for the whole experimental device. It is the power source of gearbox drive system. Its rated power is 1.1 KW, rated frequency is 50 Hz, and rated speed is 1390 r/min. The gear mesh frequency is 61.05 Hz. The internal structure of the gearbox is shown in Figure 2.

Internal structure of gearbox.
In the process of gear operation,17,18 various kinds of failure will be mainly caused by fatigue as a consequence of a high number of operating cycles.
These gear faults were simulated by following methods:
Gear tooth root crack fault: a small groove with a depth of 3 mm and a length of 30 mm is cut at the root of a gear by numerical control wire cutting.
Gear tooth wear fault: file a 3-mm deep groove on a tooth surface of a gear by filing.
Gear tooth broken fault: file a 30-mm long inclined surface with an angle of 150° at the root of a gear.
The present research studies the gear states of the wheel from the output shaft of the gearbox, being divided into four types: gear tooth root crack fault, gear tooth wear fault, gear tooth broken fault, and normal gear, as shown in Figure 3.

Modes of the gearbox fault: (a) Gear tooth root crack fault. (b) Gear tooth wear fault. (c) Gear tooth broken fault.
Experimental procedures
The vibration and acoustic signals of the gearbox under normal operating condition and the three modes of faults were collected during the experiments. The detailed procedures are listed below:
Build experimental platform, install sensors, and label the corresponding locations of each sensor. All the sensors were fixed in place during the experiment and tested with signal testing prior to the experiment.
Install the fault-free gearbox and collect the vibration and acoustic signals from X, Y, and Z axis.
Dissemble the gearbox and replace the fault-free gear with gears that have gear tooth root crack fault, gear tooth wear fault, and gear tooth broken fault, respectively.
The experimental platform is cleaned up after the experiments are finished.
Processing and analysis of vibration signal
Signal denoising
The acquisition frequency used in the experiment is 200 Hz. The signals are continuously collected for 1 min with 12,500 sample points in total. The collected image of vibration displacement signal, vibration speed signal, and vibration acceleration signal on X, Y, and Z axis is shown in Figure 4.

Normal state of the original signal of the gear: (a) Vibration displacement signal diagram. (b) Vibration velocity signal diagram. (c) Vibration acceleration signal diagram.
The raw signals contain very dense noise signals. To obtain the characteristic value of each different fault, the original signal spectrums were preprocessed for denoising using db5 wavelet function and soft-thresholding denoising method. The signals obtained from all X, Y, and Z axes were denoised with five layers of wavelet functions. Figure 5 shows the denoised signal for gear in normal condition.

Normal state of the original signal of the gear dry diagram: (a) Vibration displacement signal diagram after denoising. (b) Vibration velocity signal diagram after denoising. (c) Vibration acceleration signal diagram after denoising.
Figure 5 shows that the all the signals were amplified after the wavelet denoising process. The attenuation of the noise resulted in higher signal-to-noise ratio, which is particularly significant for vibration acceleration signal. By comparing the denoised signal with the original signal, it was found that the most notable change in the signal diagram could be obtained from the Y-axis. The amplitude of the signal is varied significantly after denoising. However, the diagram revealed weak periodicity of the vibration velocity signal, while the displacement and acceleration signals are not ideal for extraction of characteristic value. Therefore, a wavelet packet decomposition was performed to reconstruct the vibration displacement and acceleration signals.
Wavelet packet decomposition
Wavelet packet decomposition can decompose a signal into different frequency bands. The more the layers of decomposition, the higher the resolution in the frequency domain. Wavelet packet decomposition and reconstruction technology can more accurately decompose the signal into high frequency and low frequency, which is good for signal analysis and eigenvalue extraction.
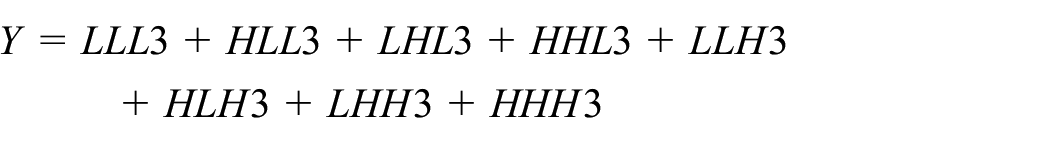
The experiment adopts three-layer wavelet packet decomposition technology, and the tree diagram of wavelet packet decomposition is shown in Figure 6. Where Y is the decomposed waveform, L is the low-frequency waveform, H is the high-frequency waveform, and the number represents the number of decomposition layers. The decomposition relationship is as follows
db12 wavelet is used to decompose the acoustic emission signal. To facilitate identification, eight frequency bands are defined as A1, A2, A3, A4, A5, A6, A7, and A8

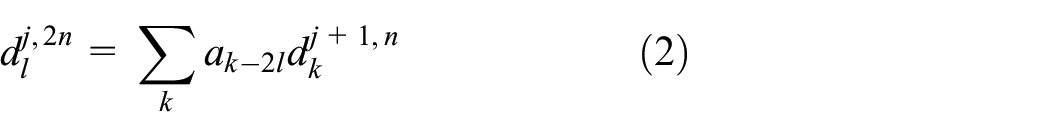

The decomposition algorithm of wavelet packet is shown in formula (1), formula (2), and formula (3).

Tree diagram of three-layer wavelet packet.
Figure 7 shows the reconstructed gear vibration signal in normal condition after wavelet packet decomposition. The frequency band of the wavelet packet decomposition is in accordance with the values listed in Table 1.
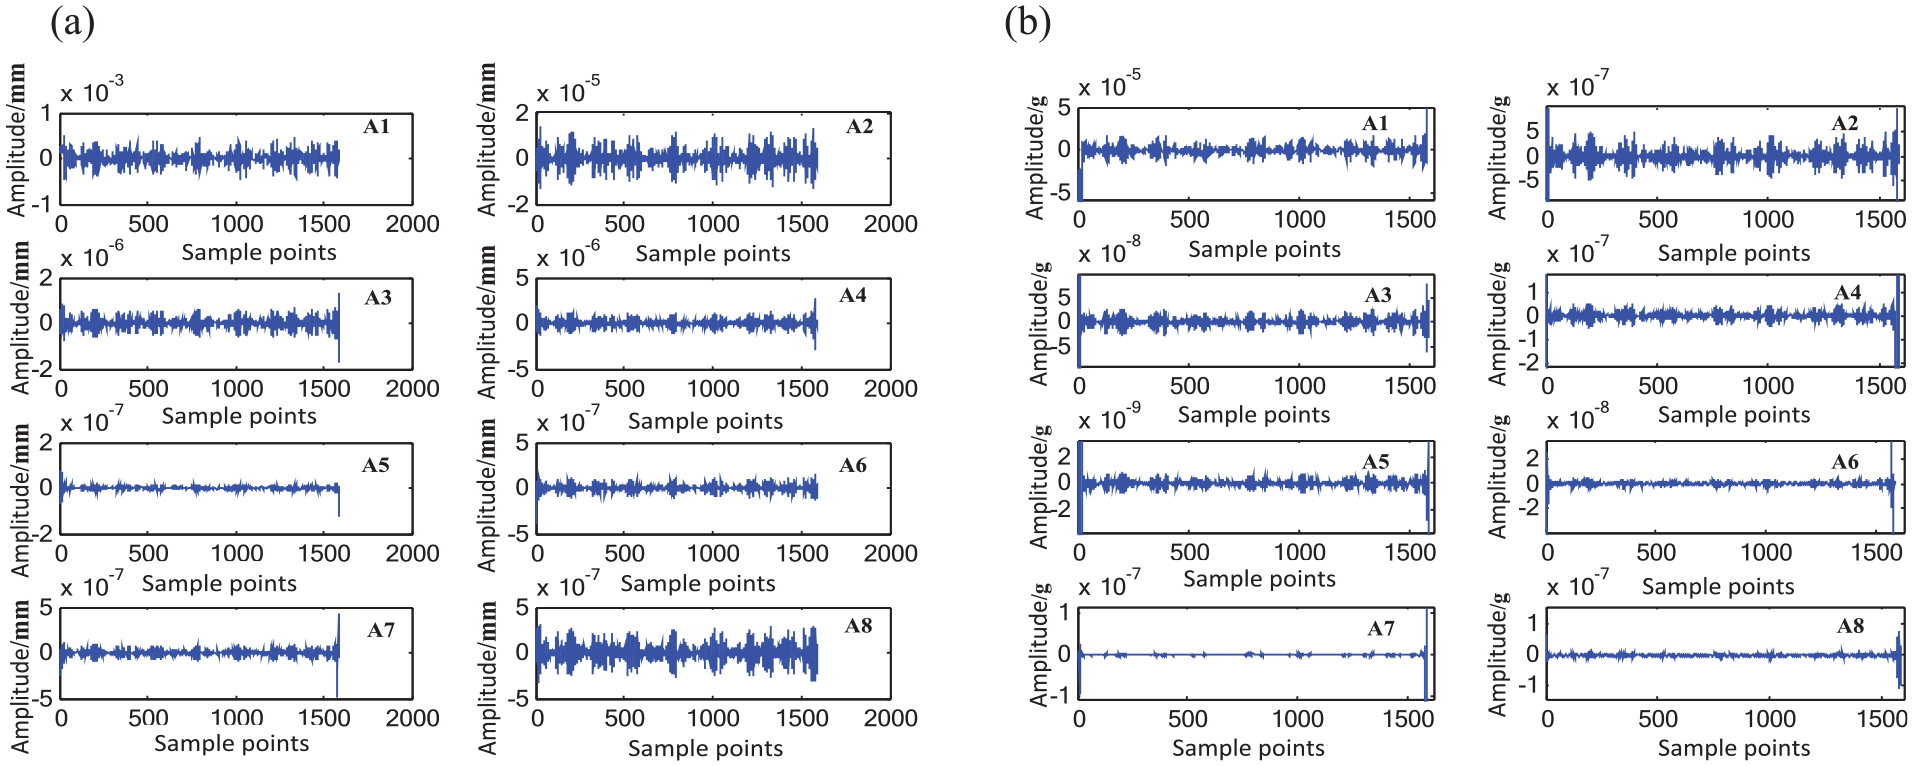
Signal reconstruction of wavelet packet decomposition of gear vibration signal in normal condition: (a) Reconstructed vibration displacement signal after wavelet packet decomposition. (b) Reconstructed vibration acceleration signal after wavelet packet decomposition.
Wavelet packet decomposition to reconstruct the corresponding frequency band.

By analyzing the vibration displacement signal and vibration acceleration signal reconstructed by wavelet packet decomposition, the energy of the vibration signal is mainly distributed in A0∼A3 (0∼50 Hz), which is in a relatively low-frequency band in the whole signal frequency domain. The ratio of A4∼A7 frequency band to total energy is low. The amplitude of the signal for different gears remains almost the same for vibration frequencies higher than 50 Hz. Therefore, the frequency higher than 50 Hz can be treated as noise band in the experimental signal spectrum. To extract the characteristic value of the vibration signal more effectively, the vibration displacement and acceleration signals are filtered using an IIR filter after FFT process, which only allows frequencies from 0∼50 Hz to pass. Figures 8 and 9 show the signal spectrum after filtration.
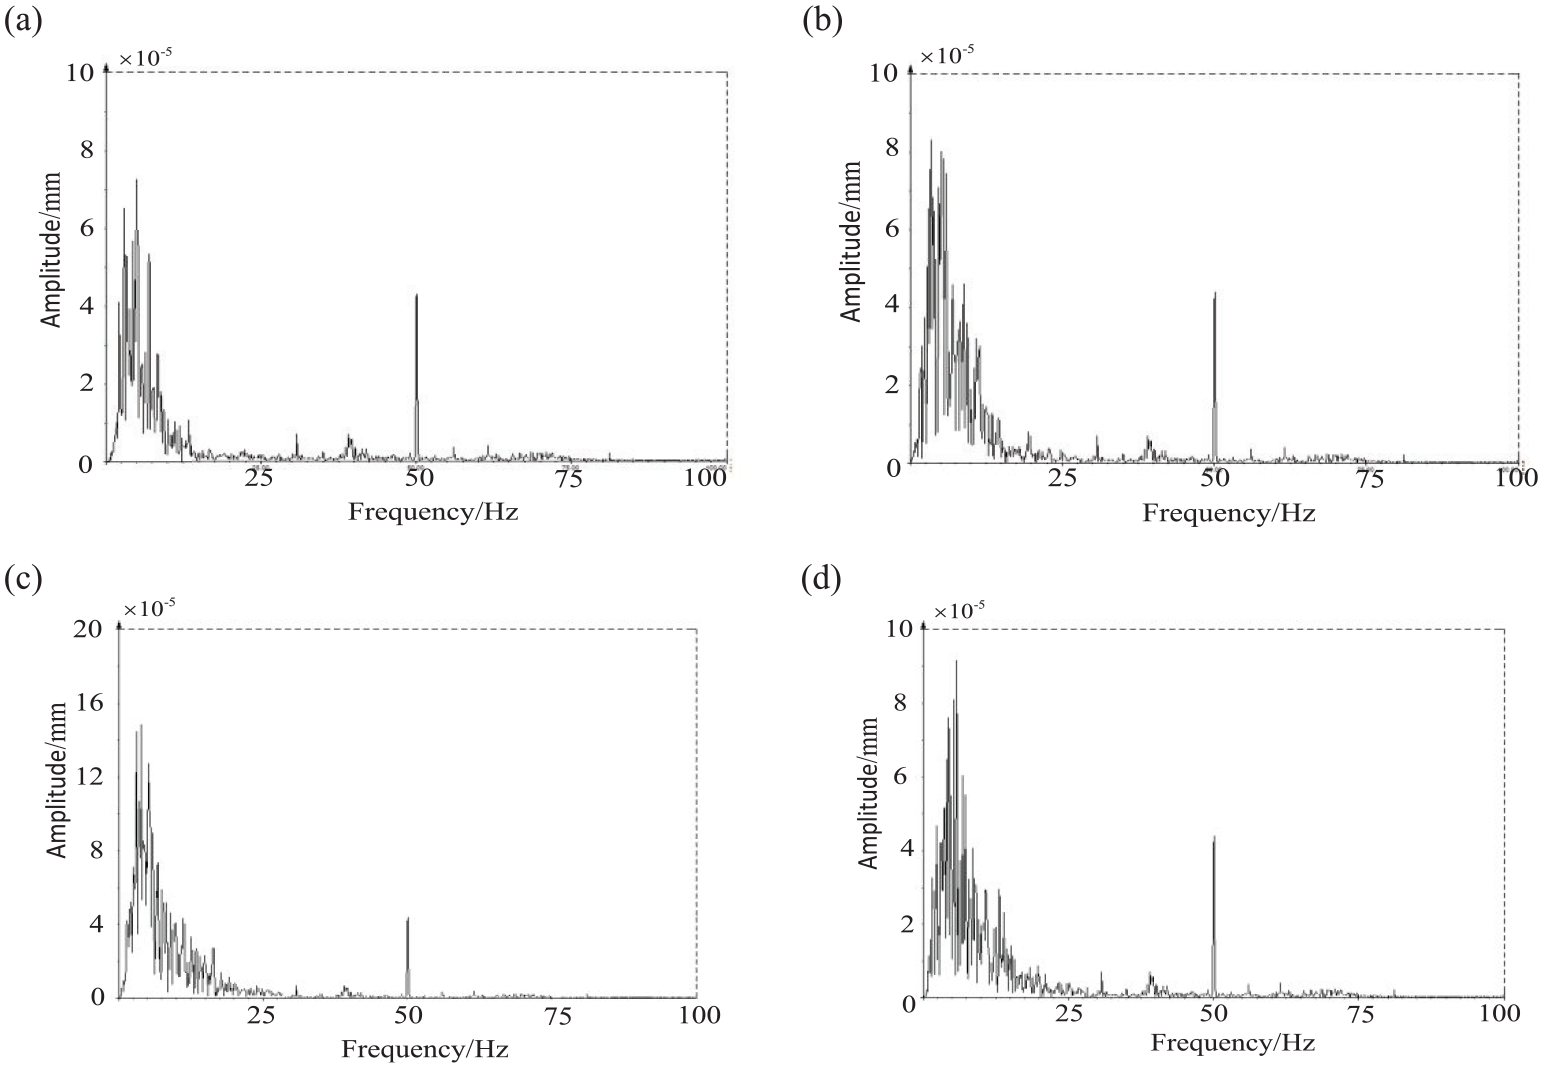
Spectrum of vibration displacement signal. (a) Signal under normal condition. (b) Signal with gear tooth root crack fault. (c) Signal with gear tooth wear fault. (d) Signal with gear tooth broken fault.
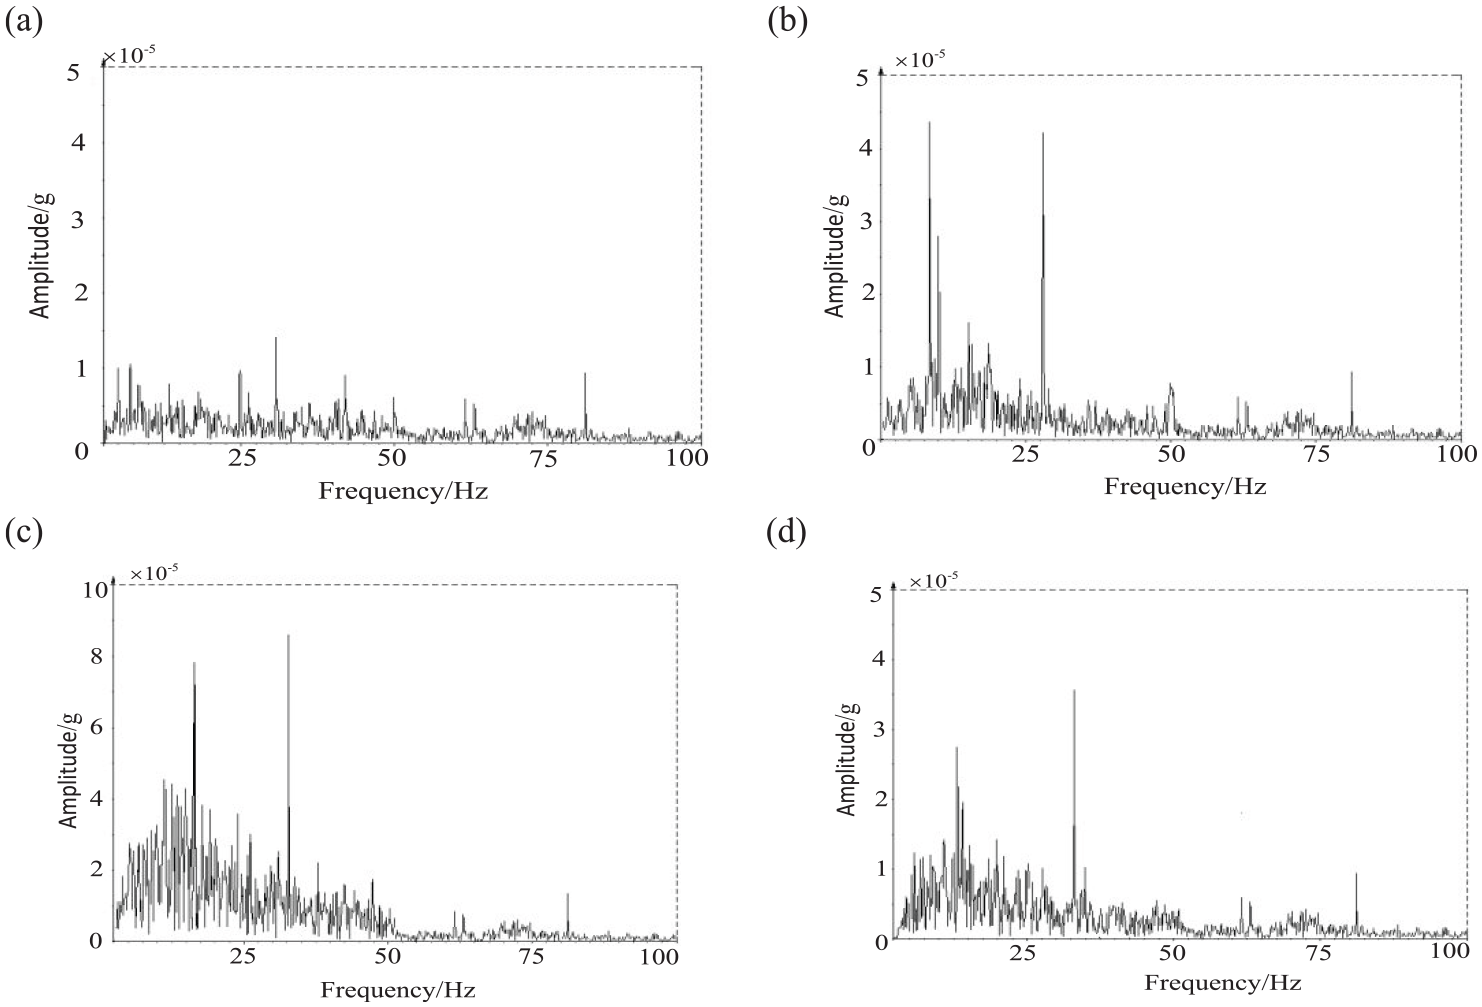
Spectrum of vibration acceleration signal: (a) Signal under normal condition. (b) Signal with gear tooth root crack fault. (c) Signal with gear tooth wear fault. (d) Signal with gear tooth broken fault.
Extraction of characteristic value
In this experiment, the signal acquisition time is 60 s, and the sample data are 10 groups, with 10 s as a time period. The characteristic values of the experiments were obtained by taking the root mean square of the 200 sample points after FFT transformation. Table 2 shows the characteristic values of the gear signal under four different conditions.
Characteristic sample value of the four gear signals.

Processing and analysis of acoustic emission signal
Signal wavelet packet decomposition and reconstruction
The acoustic signals were collected with a sampling frequency of 200 kHz, sampling time of 60 s, and total sample points of 12,800 in the experiment. The raw signal spectrum revealed significant periodic change of acoustic emission signal from gear under normal condition to gear with fault. The raw signals were processed with wavelet packet decomposition and reconstruction method for mitigating noise and enhance signal-to-noise ratio. Figure 10 shows the reconstructed acoustic emission signals, and their corresponding frequency bands are summarized in Table 3.

Signal reconstruction of acoustic emission signal by wavelet packet decomposition. (a) Gear under normal condition.(b) Gear with tooth root crack fault. (c) Gear with wear fault. (d) Gear with tooth broken fault.
The bands of wavelet packet decomposition and reconstruction corresponding to each node.
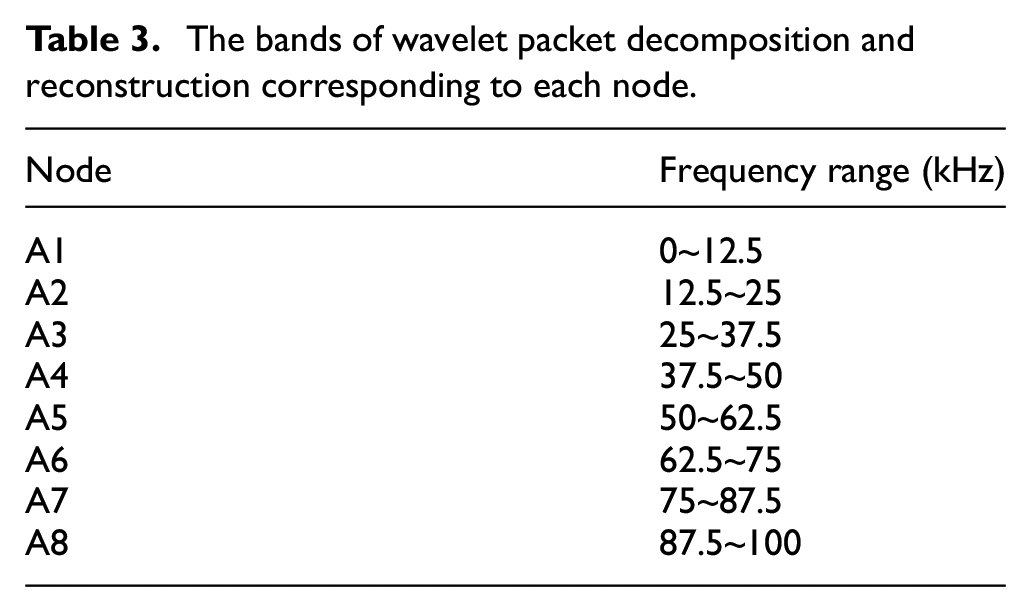
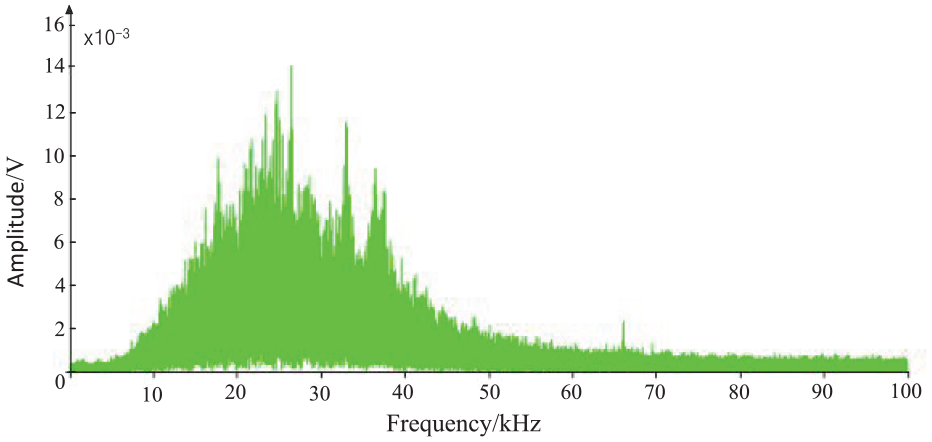
The calculation result from the reconstructed signal shows that most of the energy is concentrated in the A2, A3, and A4 frequency bands(12.5∼50 kHz). In the A1, A5∼A8 frequency bands, the proportion of the total energy is low, and the energy changes of the four gear states are not obvious, which cannot reflect the energy characteristics of a certain state. The article selected the peak value of the root mean square amplitude of the energy in A2∼A4 frequency bands as the characteristic values. Figures 11–14 show the acoustic emission signal after FFT transform.

FFT transform of acoustic emission signal in normal state.

FFT transform of acoustic emission signal in the root crack fault gear.
FFT transform of acoustic emission signal in the gear wear fault.

FFT transform of acoustic emission signal in broken gear fault.
Extraction of characteristic value
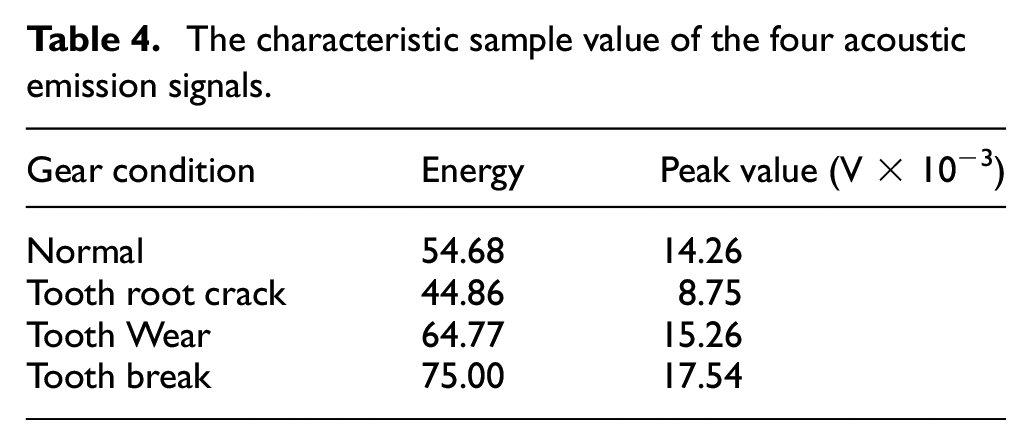
The signal spectrum from Figures 11–14 revealed that the acoustic emission energy is mainly concentrated between 15 and 40 kHz, while the energy associated with other frequency bands is insignificant. Such result is consistent with the findings obtained using wavelet packet decomposition and reconstruction method, which suggests that the characteristic value extracted using space energy associated with each node is effective. The peak value of the root mean square amplitude of the energy in A2∼A4 frequency bands was taken as the characteristic value. One set of the results is shown in Table 4.
The characteristic sample value of the four acoustic emission signals.
Discussions on recognition results
SOM network training
SOM neural network consists of an input layer and a competitive layer, where the number of input neurons is m and the competitive layer is a a × b two-dimensional (2D) planar grid. The input layer is fully connected with every single neuron, which forms a topological distribution for inputting signal characteristics. Such topology is capable for input of characteristic value of the signals as shown in Figure 15.
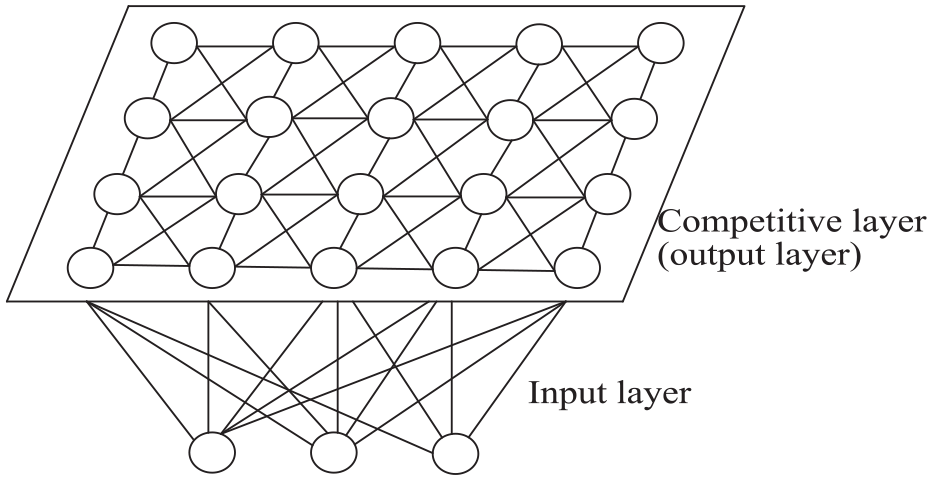
Network model of SOM.
The vibration displacement energy amplitude, vibration acceleration energy amplitude, acoustic emission signal energy, and the acoustic emission signal peak value were taken as the four characteristic values for input vectors [x1, x2, x3, x4] in the SOM neural network. The learning rate and step in the classification stage are 0.9 and 1000, respectively. The learning rate and the default value of the neighbor distance are 0.02 and 1, respectively. The competitive layer consists of 6 × 6 = 36 neurons. A hexagonal topology structure was used with a training step of 200.
Figure 16 shows that the competitive neuron for normal condition P1, tooth root crack P2, tooth wear P3, and tooth broken P4 are 31, 1, 36, and 6, respectively. Their corresponding locations in the topology structure are revealed in the same figure. By labeling the position of all the neurons in Figure 16, it was found that there exist significant differences of fault mode in the topological structure.

Clustering of result of SOM.
The blue hexagon in Figure 17 represents 36 neurons and the straight line between each neuron represents their connection. The color of each diamond indicates the distance between adjacent neurons, where a dark color is equivalent to a longer distance and larger mismatch between two different fault modes. When it is difficult to determine the mode of the fault pattern, the distance between neurons can help with judging the degree of wear.

Weighted distance between adjacent neurons.
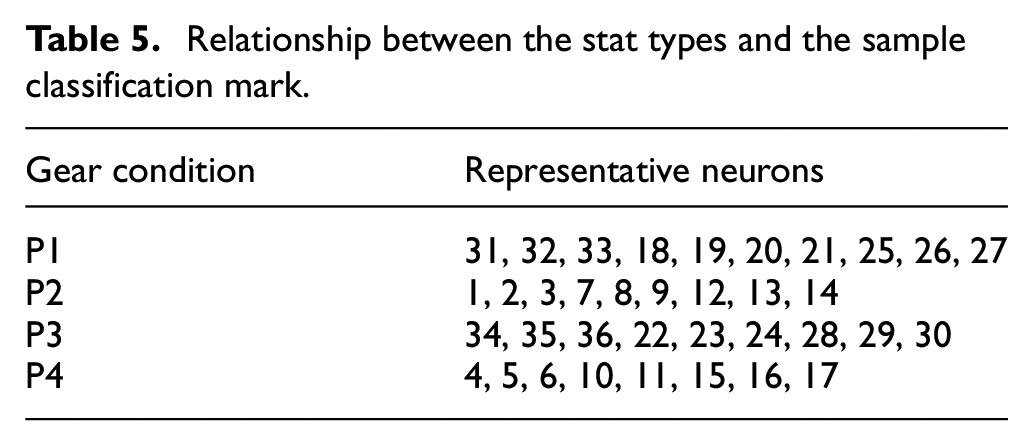
Figure 17 shows that the different modes of fault are associated with different neurons. Such mapping is summarized in Table 5.
Relationship between the stat types and the sample classification mark.
Analysis of experimental results
To test the accuracy of the SOM neural network for fault diagnosis, 100 different experiments were performed to collect the vibration and acoustic emission signal of gears under four different conditions. Twenty sets of test samples were randomly selected from the collected signals. After the vibration and acoustic emission signals were processed and analyzed using the SOM neural network model, 76 of 80 samples were identified with the correct mode of fault. The identification error may be due to noise interference during the signal collection. The accuracy of the gear fault diagnosis is around 95%.
Because the denoising method and recognition model are established accurately, the recognition accuracy increases by 10%–20% compared with the previous research results.
Conclusion
In this article, two signal fusion methods of vibration and acoustic emission are used to construct the SOM neural network to construct the gear fault diagnosis model, which greatly improves the recognition accuracy.
After preprocessing the vibration signal with wavelet denoising and wavelet packet decomposition, the characteristic of different gear fault can be represented by the Y-axis vibration displacement and acceleration signal in the frequency domain obtained using FFT transform and IIR filter.
Through wavelet packet decomposition, reconstruction, and FFT signal transformation, it was found that the energy is concentrated in the frequency bands from A2 to A4. The root mean square and the peak value of vibration amplitude of the energy extracted from A2 to A4 can be used as the characteristic values for gear fault diagnosis.
The recognition model constructed in this article has been tested by experiments, and the accuracy of fault diagnosis is about 95%, which can be potentially used as a novel technique for diagnosing gear fault and improving efficiency of mechanical instruments.
Footnotes
Handling Editor: Wei-Chiang Hong
Declaration of conflicting interests
The author(s) declared no potential conflicts of interest with respect to the research, authorship, and/or publication of this article.
Funding
The author(s) disclosed receipt of the following financial support for the research, authorship, and/or publication of this article: This study was financially supported by the National Natural Science Foundation Fund of China (Projects No. U1810119, 51774161 and 51804151), Development of National Key Laboratory of Mineral Processing Science and Technology (BGRIMM-KJSKL-2017-20), and Youth Research Projects in Colleges and Universities of Liaoning Provincial Department of Education of China (LJ2017 QL018) and Taishan Scholar Program of Shandong Province.