
Abstract
Helicopter gearboxes significantly differ from other transmission types and exhibit unique behaviours that reduce the effectiveness of traditional fault diagnostics methods. In addition, due to lack of redundancy, helicopter transmission failure can lead to catastrophic accidents. Bearing faults in helicopter gearboxes are difficult to discriminate due to the low signal-to-noise ratio in the presence of gear vibration. In addition, the vibration response from the planet gear bearings must be transmitted via a time-varying path through the ring gear to externally mounted accelerometers, which cause yet further bearing vibration signal suppression. This research programme has resulted in the successful proof of concept of a broadband wireless transmission sensor that incorporates power scavenging while operating within a helicopter gearbox. In addition, this article investigates the application of signal separation techniques in detection of bearing faults within the epicyclic module of a large helicopter (CS-29) main gearbox using vibration and acoustic emissions. It compares their effectiveness for various operating conditions. Three signal processing techniques, including an adaptive filter, spectral kurtosis and envelope analysis, were combined for this investigation. In addition, this research discusses the feasibility of using acoustic emission for helicopter gearbox monitoring.
Introduction
Helicopter transmission integrity is critical for safe operation. Approximately, 16% of mechanical failures, resulting in the loss of helicopter operation, can be attributed to the main gearbox (MGB). 1 In addition, 30% of the total maintenance cost of helicopters can be attributed to the transmission system. 1 The need to employ advanced fault warning systems for such transmission systems cannot be understated.2,3 Health and Usage Monitoring Systems (HUMS) are commonly used for fault detection of helicopter transmissions in which detection is based on the extraction of predefined features of the measured vibrations such as FM4, NA4 and so on.2,4 HUMS was developed in North Sea operations, motivated in part by the crash to a Boeing Vertol 234 in 1986 which was caused by disintegration of the forward MGB. After development in the 1990s, the UK’s Civil Aviation Authority (CAA) mandated fitment of HUMS to certain helicopters. One article suggests that HUMS ‘successes’ are found at a frequency of 22 per 100,000 flight hours. 5 A HUMS consists of two complimentary subsystems: health monitoring and usage monitoring. Health monitoring is a process of diagnosing incipient damage or degradation that could ultimately lead to a system failure. Usage monitoring is a process by which the remaining life of different gearbox components and auxiliary systems is determined by assessing operation hours, current components condition and load history.6,7 In relation to health monitoring, vibration analysis methods have been developed and applied in HUMS to detect faults in bearings, gears and shafts. Condition indicators (CIs) refer to the characteristics extracted from these vibrations and are used to reflect the health of the component. 8 Numerous CIs are calculated from vibration data to characterise component health and these indicators are often determined based on statistical measurement of the energy of the vibration signal.
The majority of helicopters utilise epicyclic gear reduction modules gears as transmission systems due to their high transmission ratio, higher torque to weight ratio and high efficiency. 9 As such, this type of gearbox is widely used in many industries such as aerospace, wind turbines, mining and heavy trucks.10–14 Different planetary gearbox configurations and designs allow for a range of gear ratios, torque transmission and shaft rotational characteristics. The planetary gearbox generally operates under severe conditions; thus, the gearbox components are subject to different kinds of fault conditions such as gear pitting, cracks.15–18 Recent investigations on applications of planetary gearboxes have shown that failures initiate at a number of specific bearing locations, which then progress into the gear teeth. In addition, bearing debris and the resultant excess clearances are known to cause gear surface wear and misalignment. 18 More recently, the accident to the helicopter registered (G-REDL), 19 resulting in the loss of 16 lives, was caused by the degradation of a planet gear bearing; interestingly, the HUMS CIs showed no failure evidence before this accident.
Planetary gearbox diagnostics
Several authors have proposed numerous diagnostic approaches for planetary gearboxes, with vibration analysis the most commonly employed monitoring technology.6,9,15,17,20,21 However, fault detection of bearings within the planetary gearbox is one of the most challenging diagnostic scenarios, as the resulting vibration signatures are influenced by the variable transmission paths from the bearing to the receiving externally mounted sensor. This leads to strong background noise which can mask the vibration signature of interest. This task is compounded by the fact that the gear mesh frequencies typically dominate the resultant vibration signal.15,20,22
Early attempts at diagnosing defective planetary gearboxes utilised time domain averaging to separate the gear components from the measured vibration signal to reduce the signal-to-noise ratio (SNR). This involved combining a delayed version of the measured vibration signal with the original signal, thereby reinforcing certain frequency components, while eliminating others. However, the SNR enhancement with this technique is not always sufficient to aid detection of bearing faults, and hence, this technique has not proved successful in identifying bearing defects within planetary gearboxes. 15 Time synchronous averaging (TSA) has also been applied to separate the bearing vibration components from the measured gearbox signature.20,23,23–26 This minimises the influence of speed variation by re-sampling the signal in the angular domain. 20 The process of re-sampling the signal requires a tachometer or phase marker and is not commonly applied for the sole purpose of separating the bearing vibration signature. 25
Recently, signal separation techniques have been applied in the diagnosis of bearing faults within gearboxes. The separation is based on decomposing the signal into deterministic and random components. The deterministic part represents the gear component and the random part represents the bearing component of the measured signal. The bearing contribution to the signal is expected to be random due to the influence of slip experienced by the rolling elements.16,25,27,28 A number of methods for signal separation are available, each having relative advantages and disadvantages.25,29–31 Techniques such as linear prediction (LP) have been employed for separation, allowing the separation of the deterministic (or predictable) part of a signal from the random background noise using the information provided by past observations.32,33 The results of such techniques depend on the number of past observations considered. Smaller values of past observation produce a poor prediction, giving a negligible improvement in the SNR, while very high values compromise computation time, over-constrain the prediction and tend to reduce even the main components of the signal (both deterministic and non-deterministic parts).34,35 Interestingly, LP is applied only to stationary vibration signatures.
To overcome the problem of separation of non-stationary vibrations, adaptive filters were proposed. This concept is based on the Wold Theorem, in which the signal can be decomposed into deterministic and non-deterministic parts. 36 It has been applied to signal processing in telecommunication 35 and electrocardiogram (ECG) signal processing. 37 The separation is based on the fact that the deterministic part has a longer correlation than the random part; therefore, the autocorrelation is used to distinguish the deterministic part from the random part. However, a reference signal is required to perform the separation. The application of this theory in condition monitoring was established by Chaturvedi et al. 38 where the adaptive noise cancellation (ANC) algorithm was applied to separate bearing vibrations corrupted by engine noise, with the bearing vibration signature used as a reference signal for the separation process. However, for practical diagnostics, the reference signal is not always readily available. As an alternative, a delayed version of the signal has been proposed as a reference signal and this method is known as self-adaptive noise cancellation (SANC) 28 which is based on delaying the signal until the noise correlation is diminished and only the deterministic part is correlated. 27
Many recursive algorithms have been developed specifically for adaptive filters.39,40 Each algorithm offers its own features; therefore, the algorithm to be employed should be selected carefully depending on the signal under consideration. Selection of the appropriate algorithm is determined by many factors, including convergence, type of signal (stationary or non-stationary) and accuracy. 41
More recently, spectral kurtosis (SK) technique has been introduced for bearing signal separation. 42 The basic principle of this method is to determine the kurtosis at different frequency bands to identify the energy distribution of the signal and determine where the high impact energy (transient events) is located in the frequency domain. Obviously, the results obtained strongly depend on the width of the frequency bands (Δf). 43 As noted earlier, in real applications, background noise often masks the signal of interest and, as a result, the traditionally obtained kurtosis value, in the time domain, is unable to capture the ‘peakiness’ of the fault signal, usually giving low kurtosis values. Therefore, in applications with strong background noise, the kurtosis as a global indicator is not useful, although it gives better results when it is applied locally in different frequency bands. 42 The SK was first introduced by Dwyer 44 as a statistical tool which can locate non-Gaussian components in the frequency domain of a signal. This method is able to indicate the presence of transients in the signal and show their locations in the frequency domain. It has been demonstrated to be effective even in the presence of strong additive noise.42,45
In addition to vibration analysis, the use of acoustic emissions (AEs) technology has emerged as a promising diagnostic approach. AE was originally developed for non-destructive testing of static structures; however, in recent times, its application has been extended to health monitoring of rotating machines and bearings.46–49 In machinery monitoring applications, AEs are defined as transient elastic waves produced by the interface of two components or more in relative motion.50,51 AE sources include impacting, cyclic fatigue, friction, turbulence, material loss, cavitation, leakage and so on. It provides the benefit of early fault detection in comparison to vibration analysis and oil analysis due to the high sensitivity to friction offered by AE. 52 Nevertheless, successful applications of AE for health monitoring of a wide range of rotating machinery have been partly limited due to the difficulty in signal processing, interpreting and manipulating the acquired data.53–55 In addition, AE signal processing is challenged by the attenuation of the signal and as such the AE sensor has to be close to its source. However, it is often only practical to place the AE sensor on the non-rotating member of the machine, such as the bearing housing and gearbox casing. Therefore, the AE signal originating from the defective component will suffer severe attenuation and reflections, before reaching the sensor. Challenges and opportunities of applying AE to machine monitoring have been discussed by Sikorska et al. and Mba et al.51,56 To date, most applications of machine health monitoring with AE have targeted single components such as a pair of meshing gears, 57 a particular bearing or valve.58,59 This targeted approach to application of AE has on the whole demonstrated success. However, the ability to monitor components that are secondary to the main component of interest such as a bearing supporting a gear, as is the case with planetary gears in an epicyclical gearbox, has not been well explored. This is the first known publication to explore the ability to identify a fault condition where the AE signature of interest is severely masked by the presence of gear meshing AE noise. Also notably, it is the first known application on a commercial helicopter MGB.
While vibration analysis of gearbox fault diagnosis is well established, the application of AE to this field is still in its early stages.52,60,61 Moreover, there are limited publications on application of AE to bearing fault diagnosis within gearboxes. 54 This article discusses the analysis of vibration and AE data collected from a CS-29 category ‘A’ helicopters industrial test facility and compares their effectiveness in diagnosing a bearing defect in the epicyclic module of helicopter MGB. This article focuses on the new AE sensing technologies available for fault detection, with a particular emphasis on increasing the signal separation of the ‘ defect signal’. The data were collected for various bearing fault conditions and processed using an adaptive filter algorithm to separate the non-deterministic part of the signal and enhance the SNR for both AE and vibration. The resultant signatures were then further processed using envelope analysis to extract the fault signature.
Gear and bearing diagnostics
The vibration signals associated with bearing defects have been extensively studied and robust detection algorithms are now available as off-the-shelf solutions. 62 Conversely, the dynamics associated with bearing diagnostics within gearboxes reduce the effectiveness of traditional techniques. Therefore, it is important to understand the nature of the faulty bearing signal.
For rolling element bearings, a fault will cause shocks which in turn excite higher resonance frequencies which will be amplitude modulated depending on two factors, the transmission path and loading condition. 26 Therefore, the vibration signal is typically demodulated to extract the frequency of these impulses. Equations for calculation of bearing faults frequencies have been reported widely in the literature.20,63,64 These equations assume no slip, however, in real world operation there is some degree of slip and this why the bearing faults frequencies vary by 1%–2% of the calculated value. It is this slip that facilitates the separation of the gear and bearing vibration components, 16 the latter known as the non-deterministic component of the measured vibration. The deterministic part of the signal is usually related to gear and shaft speeds. 21 Such periodic events are related to kinematic forces induced by the rotating parts such as meshing forces, misalignment and eccentricity. 29 In some cases, the deterministic part of the vibration signal cannot be identified due to speed variation; therefore, it is essential to re-sample the signal to the angular domain to track speed variation.29,65 The deterministic part of the signal can be used for diagnostics of gear and shaft faults.
In relation to AE, only relatively short-time series signatures are typically processed. 60 In application to diagnosis of machine faults, simple AE parameters are typically employed, such as root mean square (RMS), kurtosis, AE counts 51 and demodulation. 46 More recently, the use of SK and adaptive filters has been employed to facilitate the diagnosis of machine faults with AE.47–49
Signal processing and data analysis
Bearing and gear fault identification involves the use of various signal processing algorithms to extract useful diagnostic information from measured vibration or AE signals. Traditionally, analysis has been grouped into three classes: time domain, frequency domain and time–frequency domain. The statistical analysis techniques are commonly applied for time domain signal analysis, in which descriptive statistics such as RMS, skewness and kurtosis are used to detect the faults.66,67 A fast Fourier transform (FFT) is commonly used to obtain the frequency spectra of the signals. The detection of faults in the frequency domain is based on the identification of certain frequencies which are known to be typical symptoms associated with bearing or gear faults. The time–frequency domain methods are composed of the short-time Fourier transform (STFT), 68 Wigner-Ville 66 and wavelet analysis.69,70 The use of these detection techniques is feasible for applications where a single component is being monitored; however, for applications that include several components, such as gearboxes, it is essential to employ separation algorithms. For this study, the vibration and AE signals acquired were processed by first employing an adaptive filter algorithm to estimate the deterministic component of the signal. Second, SK was used to estimate the filter characteristics of the deterministic signal for envelope analysis. Finally, a frequency spectrum of the enveloped signal was determined. The signal processing procedures are summarised in Figure 1, with descriptions detailed in the following section.
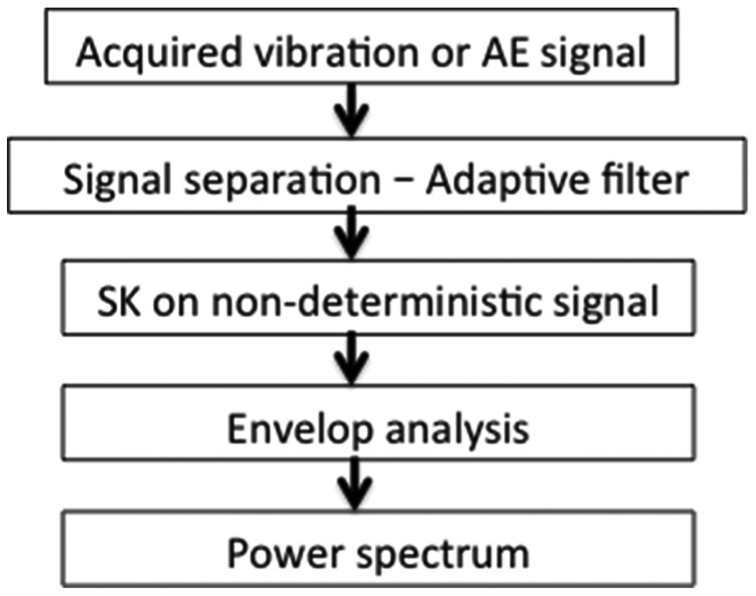
Signal processing algorithms flow chart.
An adaptive filter 41,45,71 is used to model the relationship between two signals in an iterative manner; the adaption refers to the method used to iterate the filter coefficient. The adaptive filter solution is not unique; however, the best solution is that which is closest to the desirable response signal. 72 Finite impulse response (FIR) filters are more commonly used as adaptive filters in comparison to infinite impulse response (IRR) filters. 73 The adaptive filter principle is based on Wold theorem which proposes that the vibration signal can be decomposed into two parts, deterministic and random.40,72–74 The random signal then processed using envelope analysis, envelope analysis is applied extensively in vibration analysis for the diagnosis of bearings and gearboxes.17,22,26 As impacts due to the defects excite resonance at higher frequencies, it is possible to identify the frequency of the impacts with the use of envelope analysis. In application, the vibration signal is filtered at high frequencies (structural resonance frequencies) and then the signal is passed through an envelope detector and a low-pass filter. The enveloped signal is either presented in the time domain or transformed into the frequency domain to identify fault frequency components. 75 To detect fault signatures, it is important to select filter parameters carefully. In addition, SK has been applied to select such filter parameters.42,76 The basic principle of the SK method is to determine the kurtosis at different frequency bands to identify the energy distribution of the signal and to determine where the high impact (transient) energy is located in the frequency domain. The results obtained are strongly dependent on the width of the frequency bands Δf. 43 The kurtogram 32 is a representation of the calculated values of the SK as a function of f and Δf. However, exploration of the entire plane (f, Δf) is a complicated computational task, although Antoni 43 suggested a methodology for the fast computation of the SK.
Experimental setup
Experimental data were obtained from tests performed on CS-29 Category ‘A’ helicopter gearbox which was seeded with defects in one of the planetary gears bearing of the second epicyclic stage. The test rig was of back-to-back rig configured and powered by two motors simulating dual power input.
CS-29 ‘Category A’ helicopter MGB
The transmission system of a CS-29 ‘Category A’ helicopter gearbox is connected to two shafts, one from each of the two free turbines engines, which drive the main and tail rotors through the MGB. The input speed to the MGB is typically in the order of 23,000 r/min, which is reduced to the nominal main rotor speed of 265 r/min, see Figure 2.
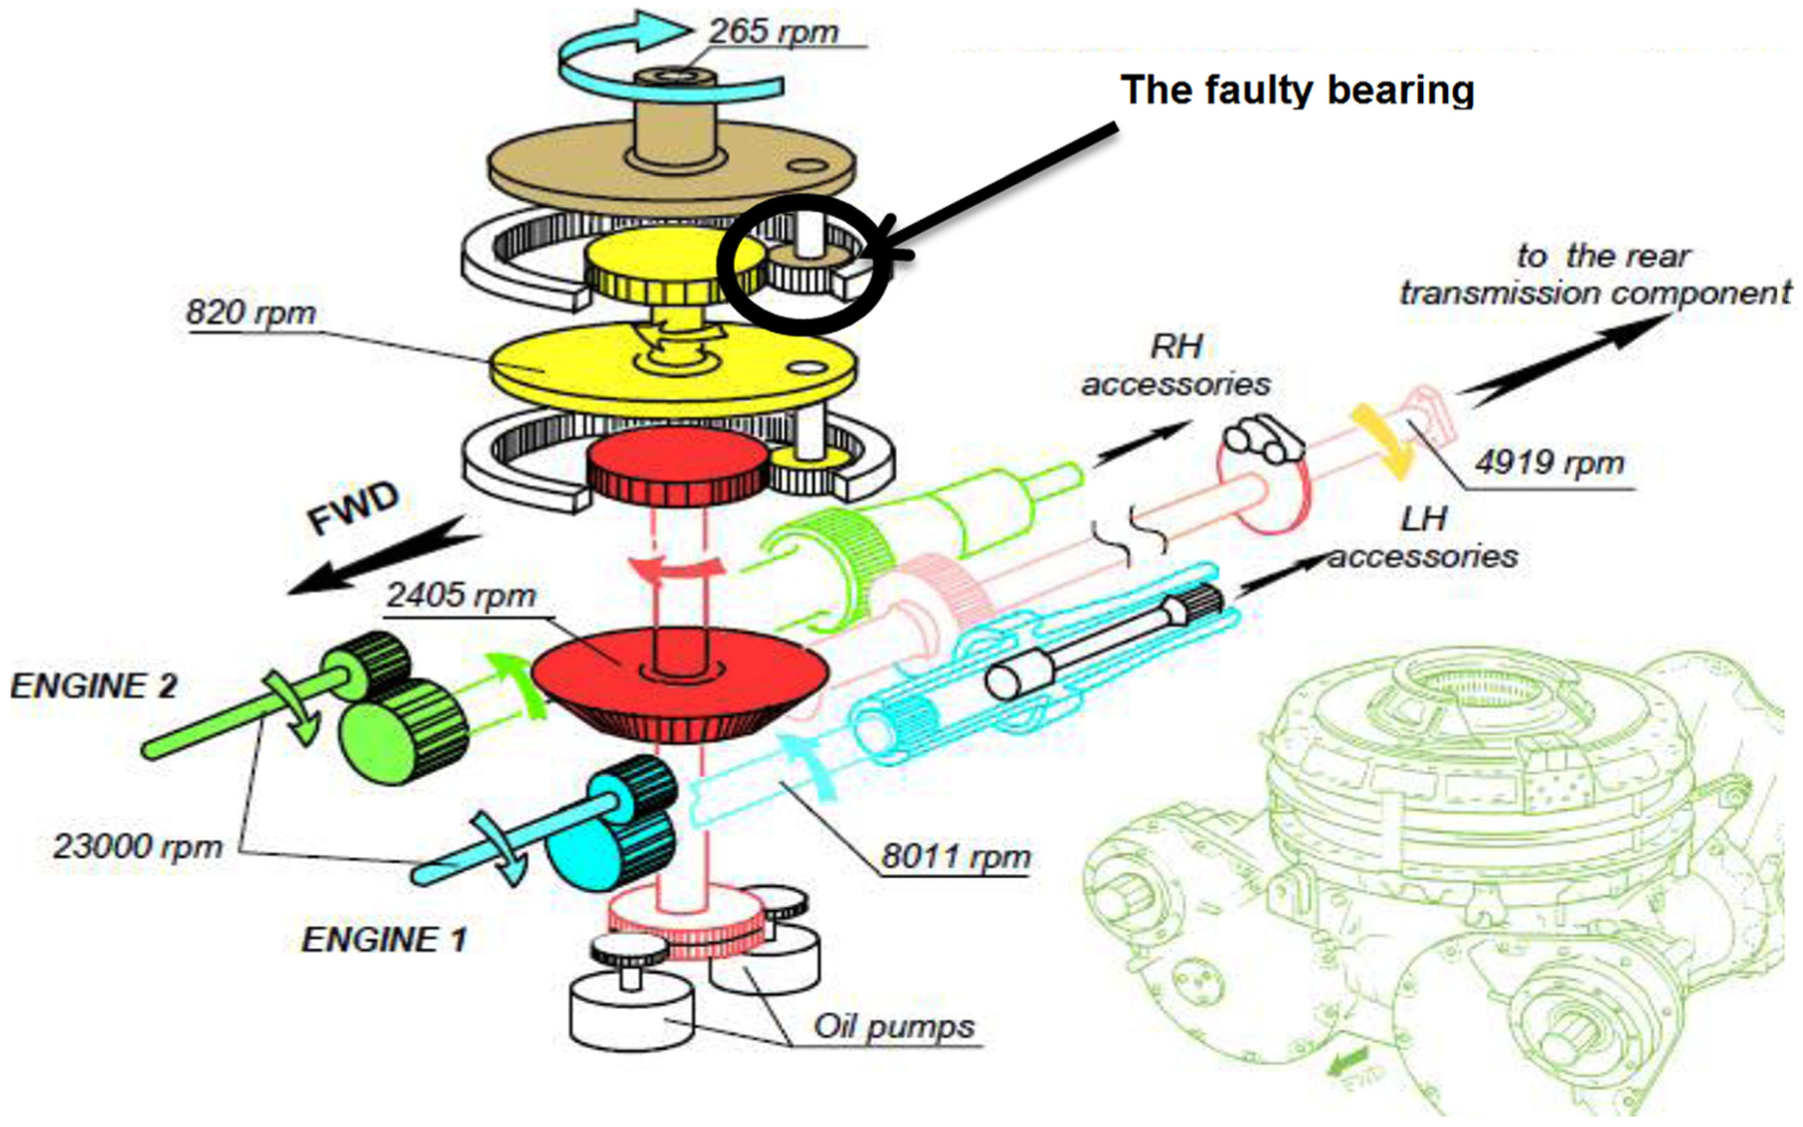
Gearbox internal parts. 19
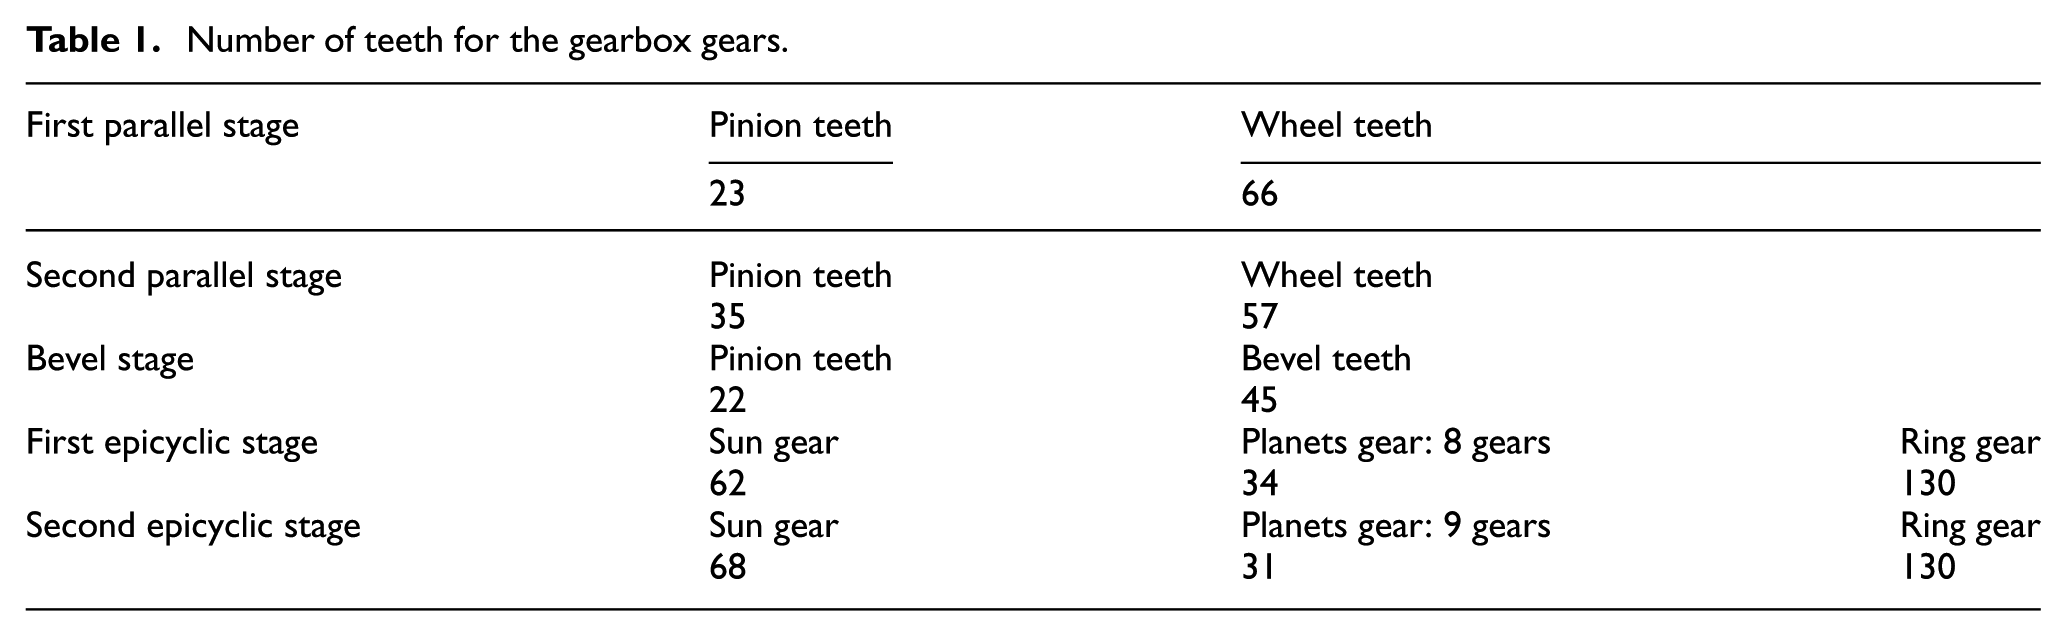
The main rotor gearbox consists of two sections, the main module, which reduces the input shaft speed from 23,000 to around 2400 r/min. This section includes two parallel gear stages. This combined drive provides power to the tail rotor drive shaft and the bevel gear. The bevel gear reduces the rotational speed of the input drive to 2405 r/min and changes the direction of the transmission to drive the epicyclic reduction gearbox module. The second section is the epicyclic reduction gearbox module which is located on top of the main module. This reduces the rotational speed to 265 r/min which drives the main rotor. This module consists of two epicyclic gears stage; the first stage contains eight planets gears and second stage with nine planets gears, see Figure 3. The details of the gears are summarised in Table 1.
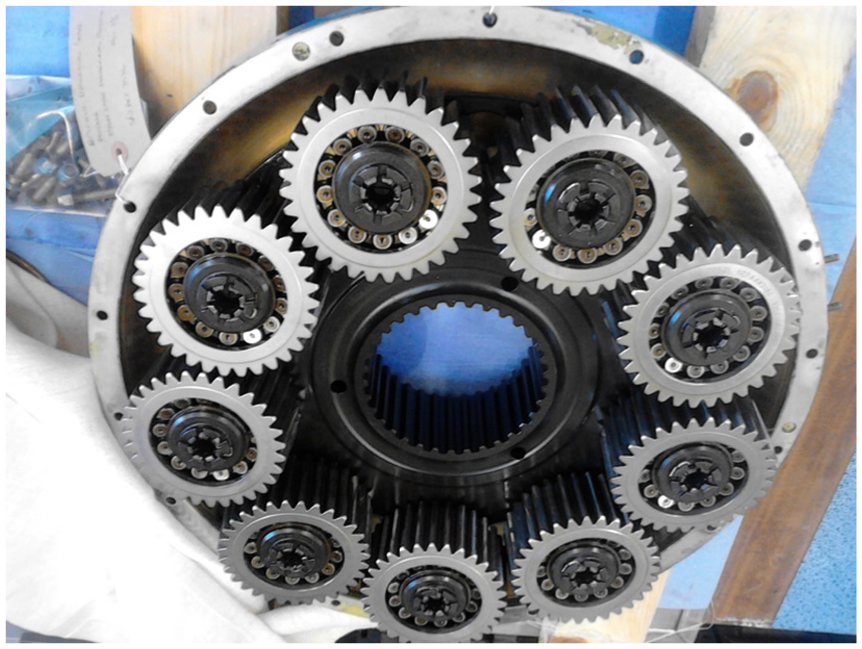
Second-stage epicyclic gears.
Number of teeth for the gearbox gears.
The epicyclic module planet gears are designed as a complete gear and bearing assembly. The outer race of the bearing and the gear wheel are a single component, with the bearing rollers running directly on the inner circumference of the gear. Each planet gear is ‘self-aligning’ by the use of spherical inner and outer races and barrel-shaped bearing rollers (Figure 3).
Experimental conditions and setup
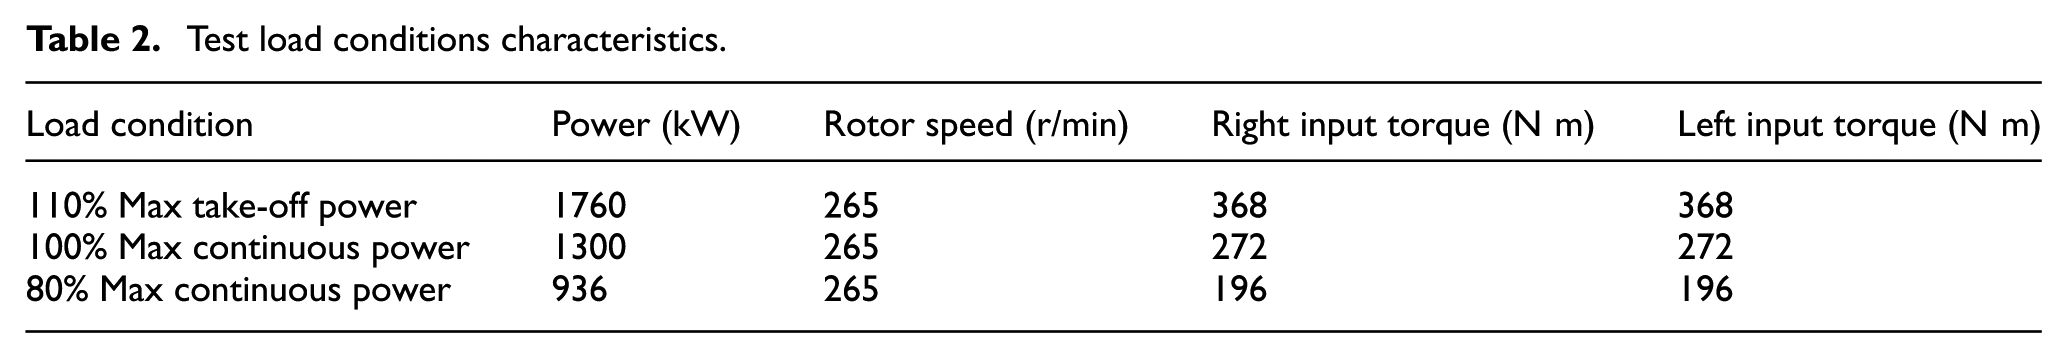
This investigation involved performing the tests for the fault-free condition, minor bearing damage and major bearing damage. The bearing faults were seeded on one of the planet gears of the second epicyclic stage. Minor damage was simulated by machining a rectangular section of fixed depth and width across the bearing outer race (10 mm wide and 0.3 mm deep), see Figure 4, and the major damage simulated as a combination of both a damaged inner race (natural spalling around half of the circumference) and an outer race (about 30 mm wide, 0.3 mm deep), see Figure 5. Three load conditions were considered for the each fault condition, 110% of maximum take-off power, 100% and 80% of maximum continuous power; the power, speed and torque characteristics of these load conditions are summarised in Table 2.
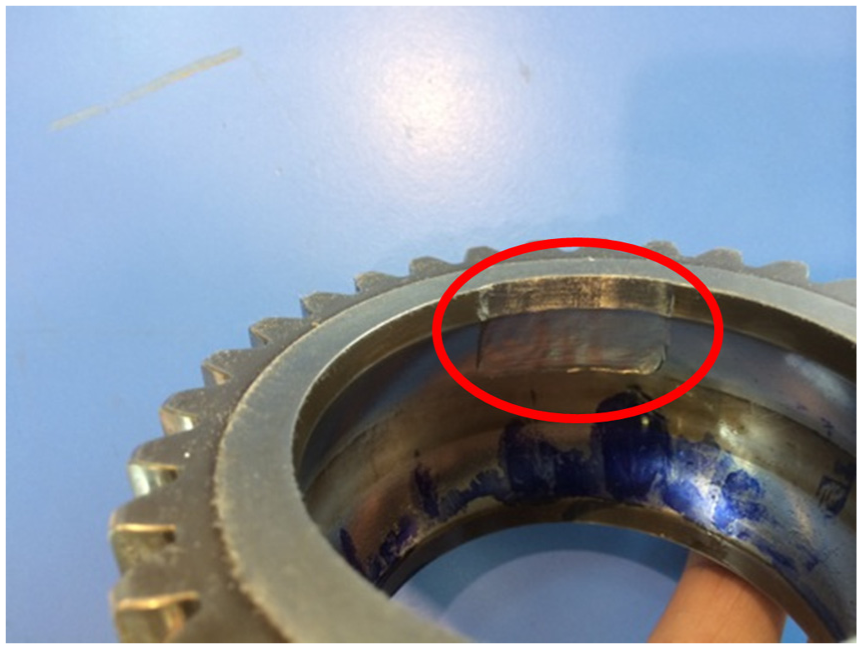
Damaged slot across the bearing outer race.
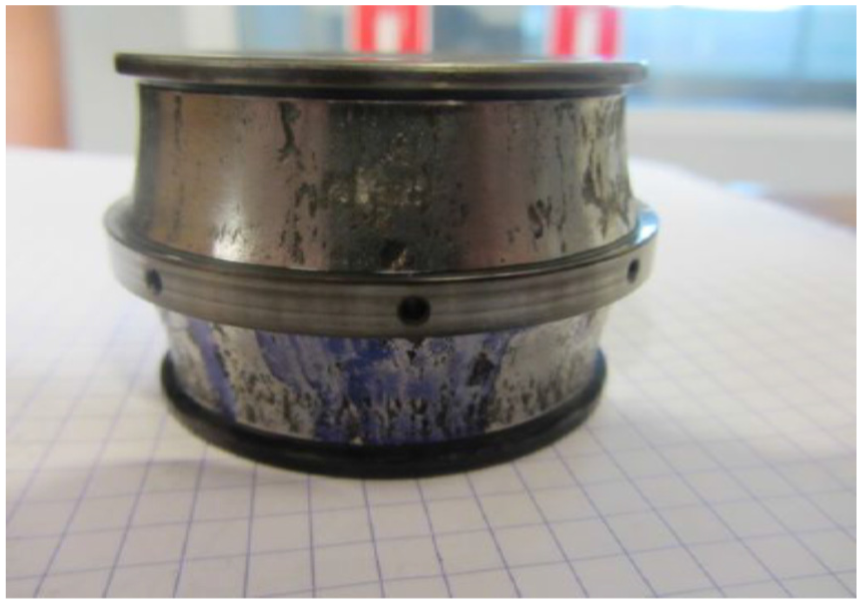
Inner race natural spalling.
Test load conditions characteristics.
Vibration fault frequencies
To aid diagnosis, all characteristic vibration frequencies were determined, see Table 3. These included gears mesh frequencies of the different stages and the bearing defect frequencies for planet bearing.
Gearbox characteristic frequencies.
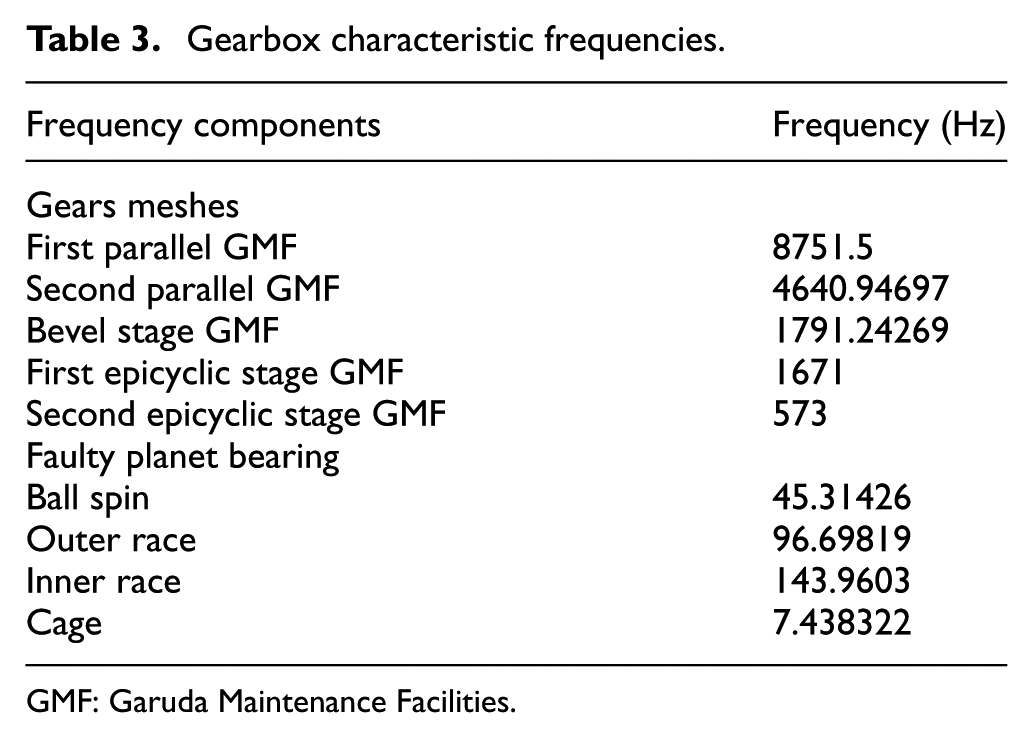
GMF: Garuda Maintenance Facilities.
Data acquisition and instrumentation
Vibration data were acquired with a tri-axial accelerometer (type PCB Piezotronics 356A03) at a sampling frequency of the 51.2 kHz. The accelerometer had an operating frequency range of 2 Hz–8 kHz and was bonded to the case of the gearbox, see Figure 6. The acquisition system employed was a National Instruments (NI) NI cDAQ-9188XT Compact DAQ Chassis. A 60-second sample was recorded for each fault case. The Y-axis of the tri-axial accelerometer arrangement was oriented parallel to the radial direction of the gearbox, the X-axis to the tangential axis and the Z-axis is the vertical axis parallel to the rotor axis, see Figure 6.
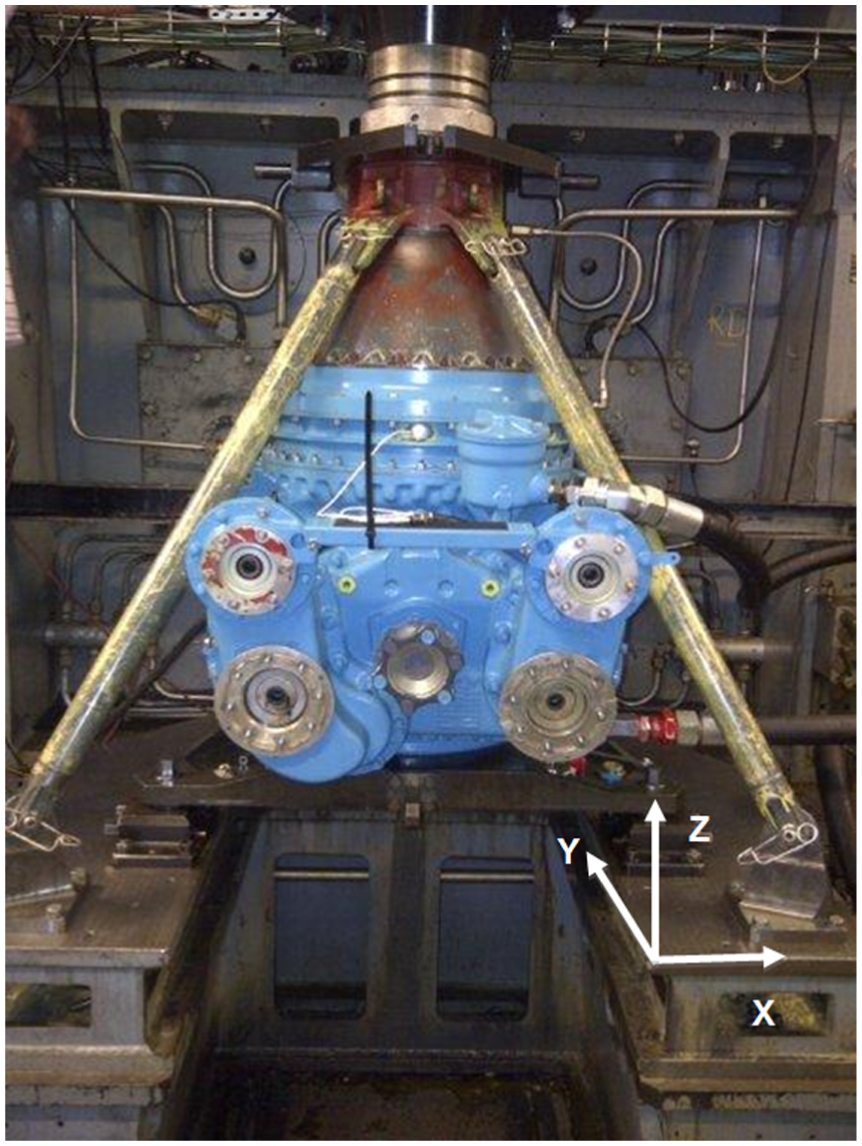
MGB installed on the test bench.
In addition, AE data were collected using a piezoelectric wafer-active sensor (PWAS), 77 7 mm diameter and approximately 0.2 mm thick, bonded to the upper face of the planet carrier, see Figure 7. The sensor was connected to a conditioning board, attached to the planetary carrier, prior to wirelessly transmission, see Figure 7. The wireless transfer was accomplished by utilising two single turn brass coils of approximately 400 mm diameter, which were cut to size using water jets for accuracy. One coil was fixed and the other rotating coil moved with the component being investigated, upon which is mounted a sensor. The sensor-side circuitry is required to be very small and must be self-powered without the use of a battery. To achieve this, the system makes use of radio frequency (RF) power scavenging. The system uses a homodyne receiver with a ‘modulated backscatter’ communications link, to pass the analogue signal across the wireless link. The stationary (upper) coil was suspended from two clamping rings that were attached to the top case of the gearbox with a spacer through the holes to retain location. The moving (lower) coil was attached to a circular mounting ring which was, in turn, mounted on top of the oil caps on the planet carrier, see Figures 8 and 9. Electrical isolation of the coils from the mounts and surrounding metallic structure was achieved through the use of nylon washers and bushes. AE data were acquired at a sampling rate of 5 MHz using an NI PCI-6115 card connected to a BNC-2110 connector block.
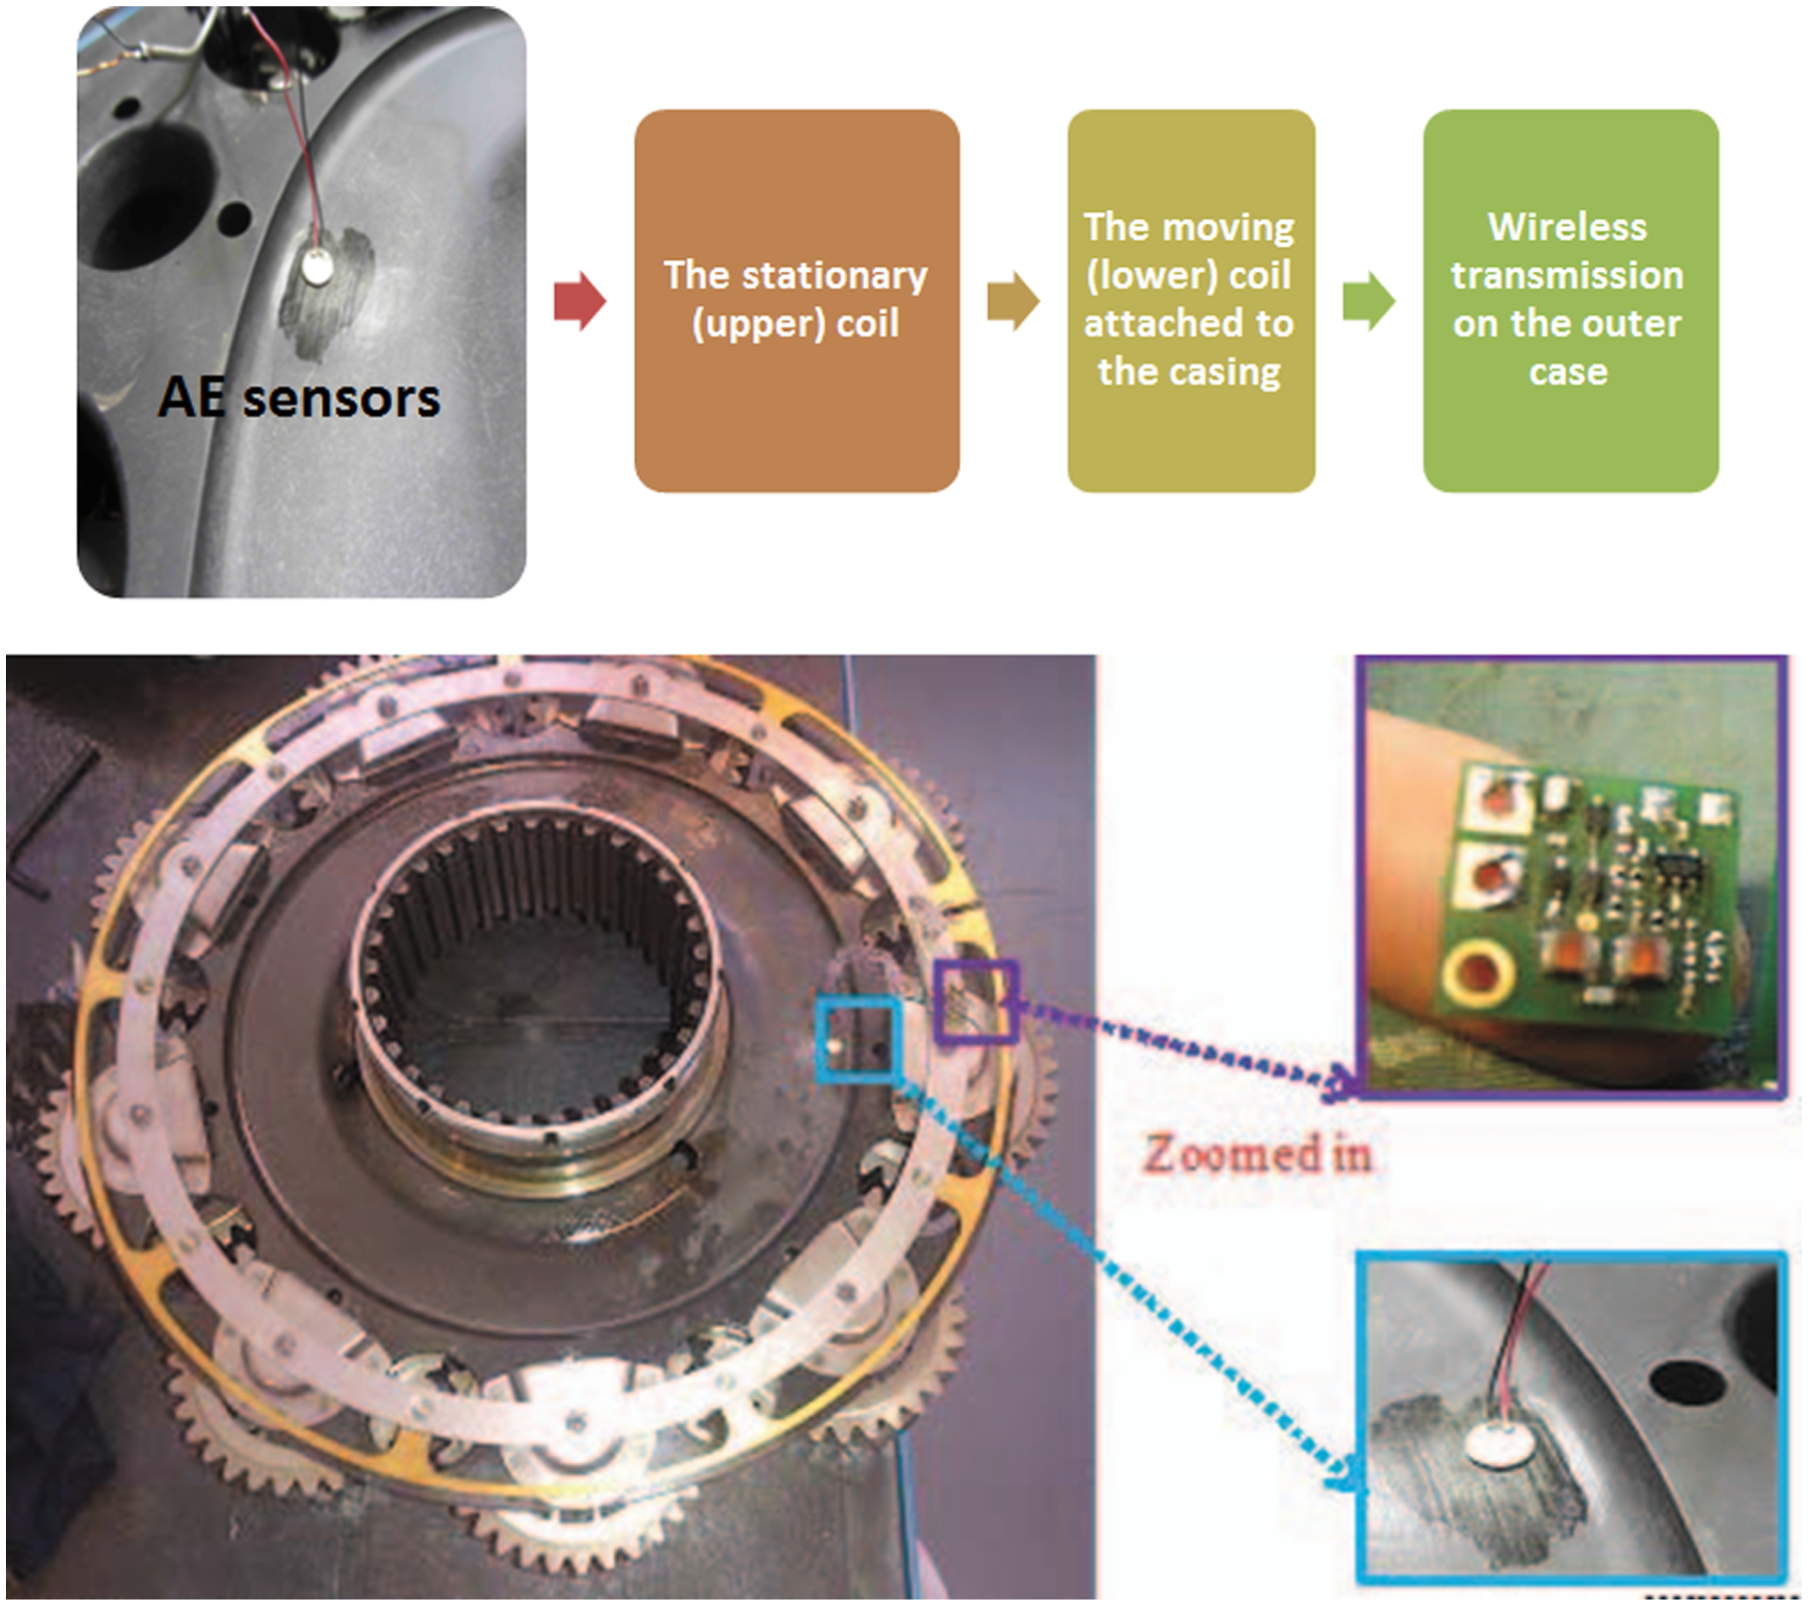
AE wireless transmission scheme.
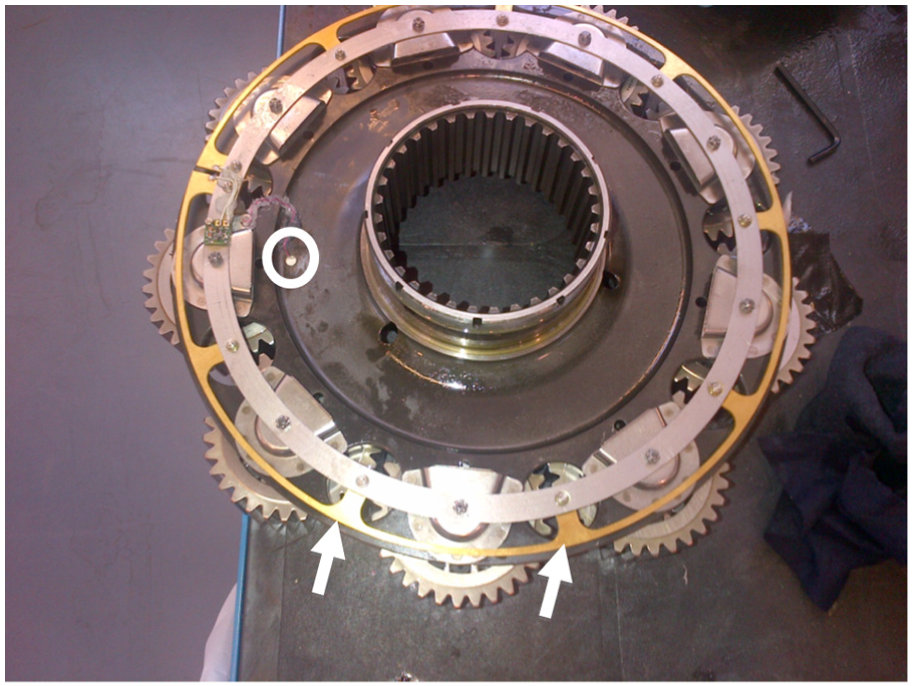
Moving coil mounted on the planetary carrier (coil arrowed, sensor circled).
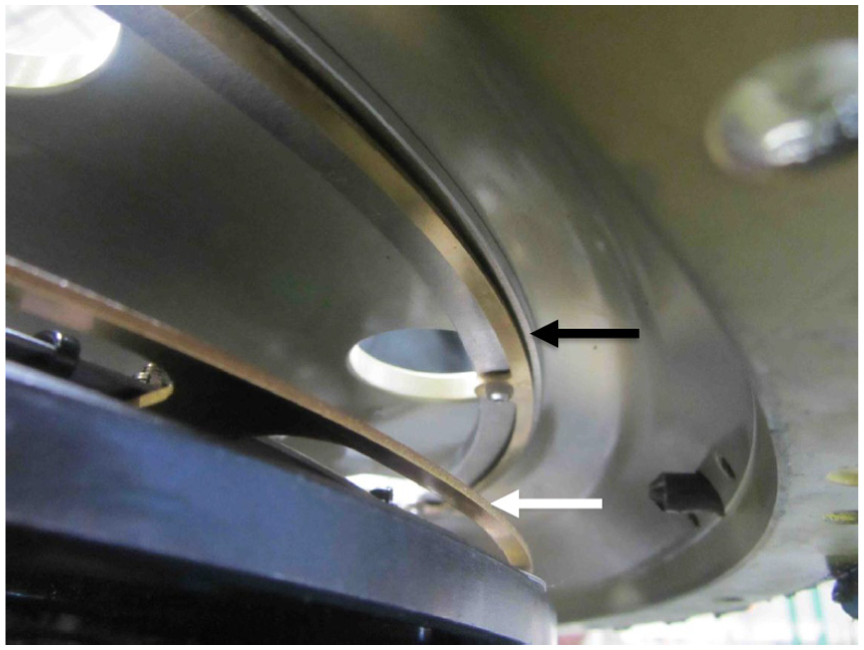
Coils in position prior to assembly (static coil black arrow, moving coil white arrow).
Observations of vibration analysis
The measured vibration data were processed to estimate the power spectrum of the vibration signal for damaged conditions, see Figure 10. This analysis was performed to assess the ability of FFT spectrum to determine the fault signature. The results show clearly that no distinctive planetary bearing fault frequency was evident in the spectrum, and it was observed that the gear mesh frequencies (GMFs) dominate the spectrum. Therefore, the data were further processed using signal separation and SK to identify the fault signature as described earlier.
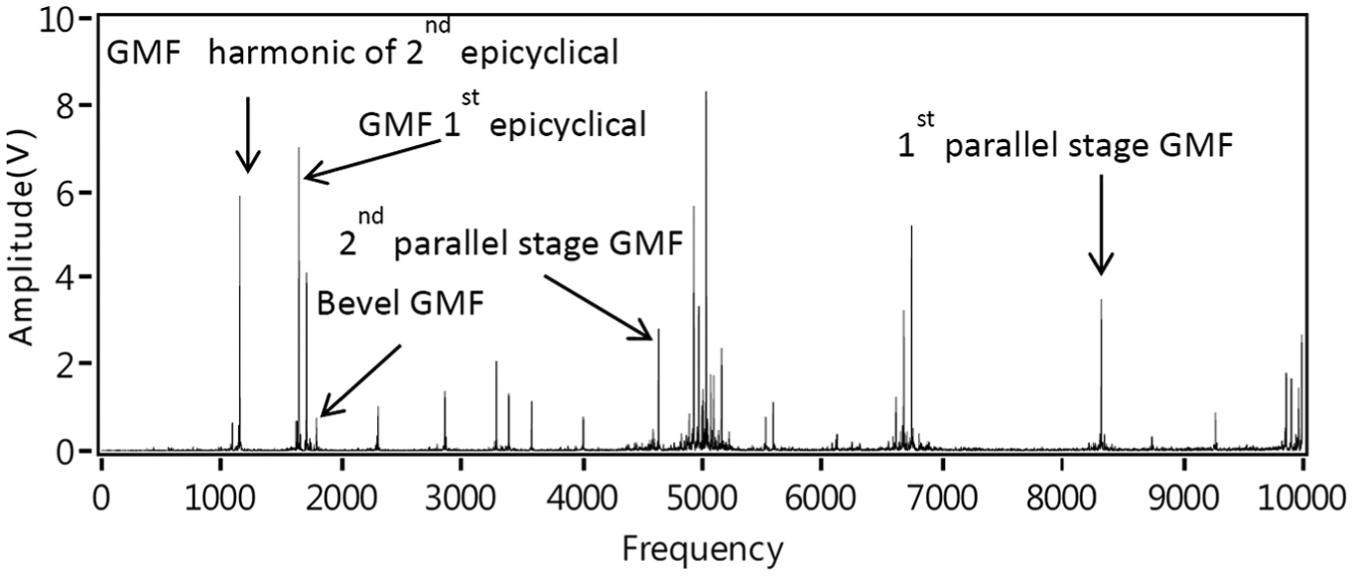
Power spectrum of original vibration signal for the major defect condition.
To ensure the optimal least mean squares (LMS) algorithm parameter estimation, the mean square error (MSE) was determined, and Figure 11 shows the MSE converge to the minimum. Figure 12(a) and (b) shows the vibration signature prior and after to signal separation of the deterministic components for the small defect test condition. This result shows the non-deterministic component of the signal following separation, highlighting the fact that no periodic impact shocks were evident for the small defect condition; this observation also applied to the large defect condition.
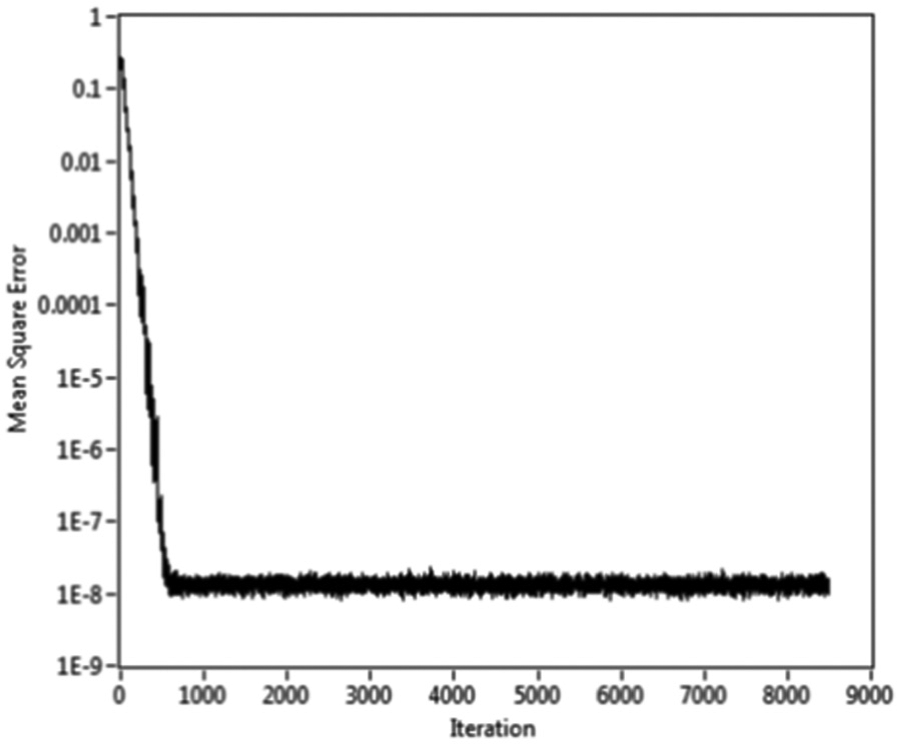
LMS convergence.
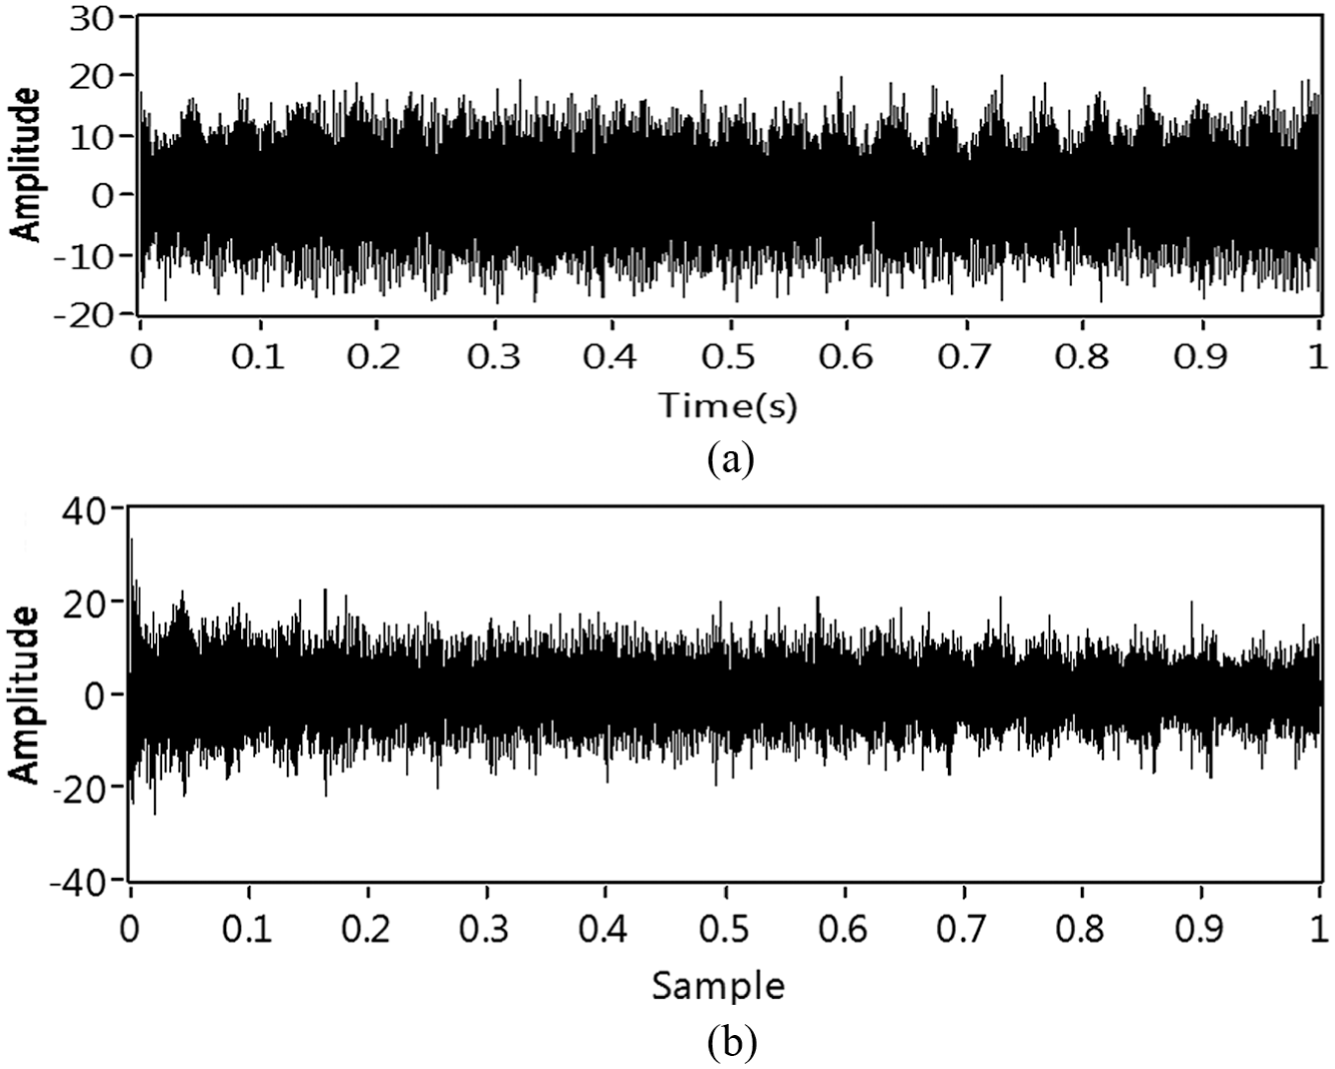
Time waveform of vibration signatures (a) before and (b) after separation for small defect.
SK analysis was undertaken on the non-deterministic part of data sets collected from the gearbox for the different fault cases and this yielded the frequency bands and centre frequencies which were then used to undertake envelope analysis. As discussed earlier, the signal separation was undertaken with an adaptive filter LMS algorithm.
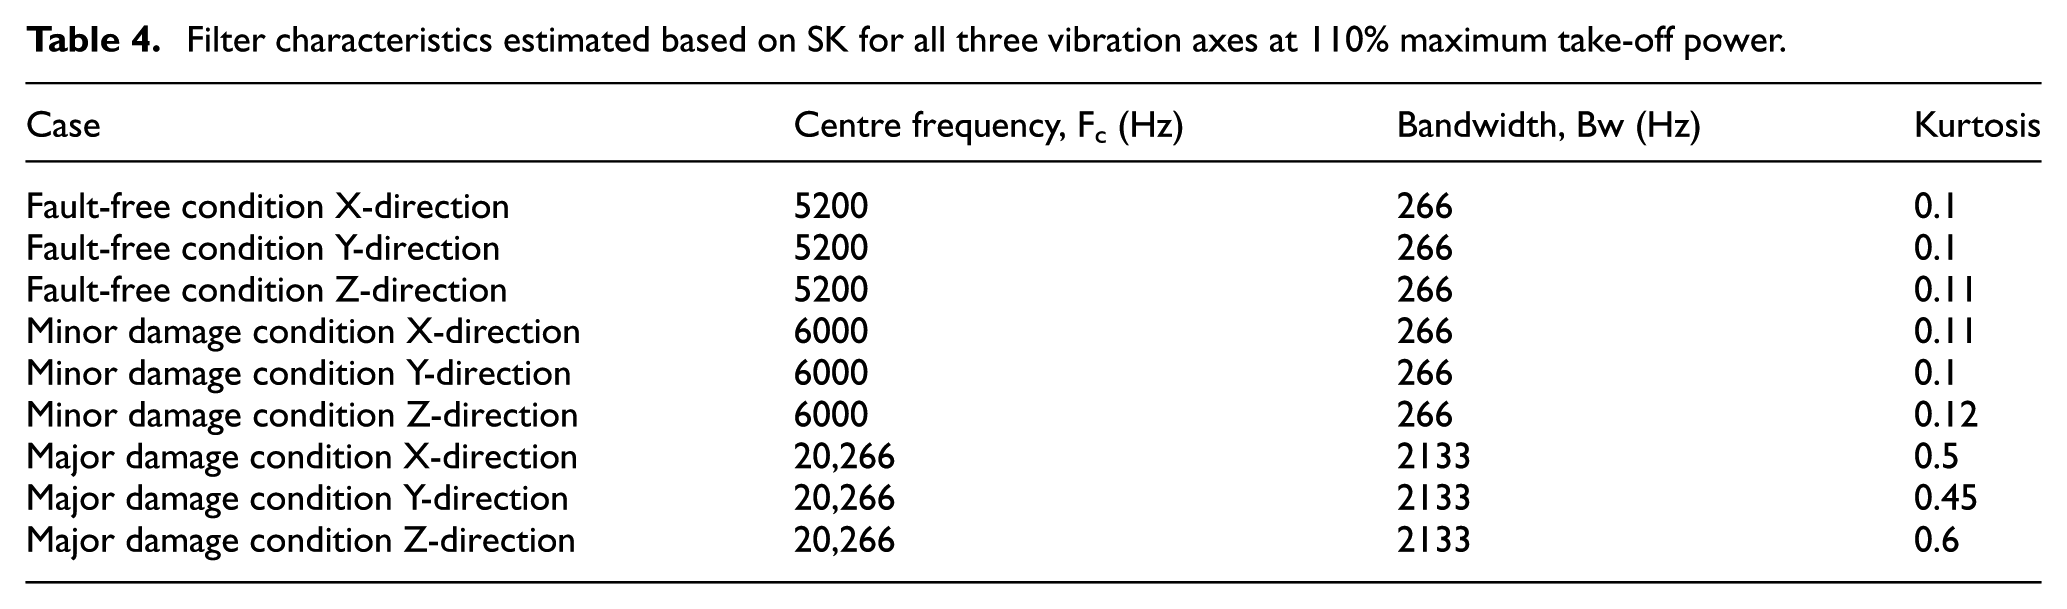
Observation from a typical kurtogram used to estimate the associated filter characteristics for different defect conditions is shown in Figure 9 with corresponding filter frequency bands at 110% maximum take-off power summarised in Table 4. The SK results show there was a significant increase in maximum kurtosis for major damaged compared to fault-free and minor damage condition, typically 500%–600% higher in all measurement directions, see Table 4. However, no significant differences were identified between minor and fault-free conditions. Spectral plots of enveloped vibration signals following filtration, whose characteristics were determined with the aid of the kurtogram, are shown in Figures 13 to 22.
Filter characteristics estimated based on SK for all three vibration axes at 110% maximum take-off power.
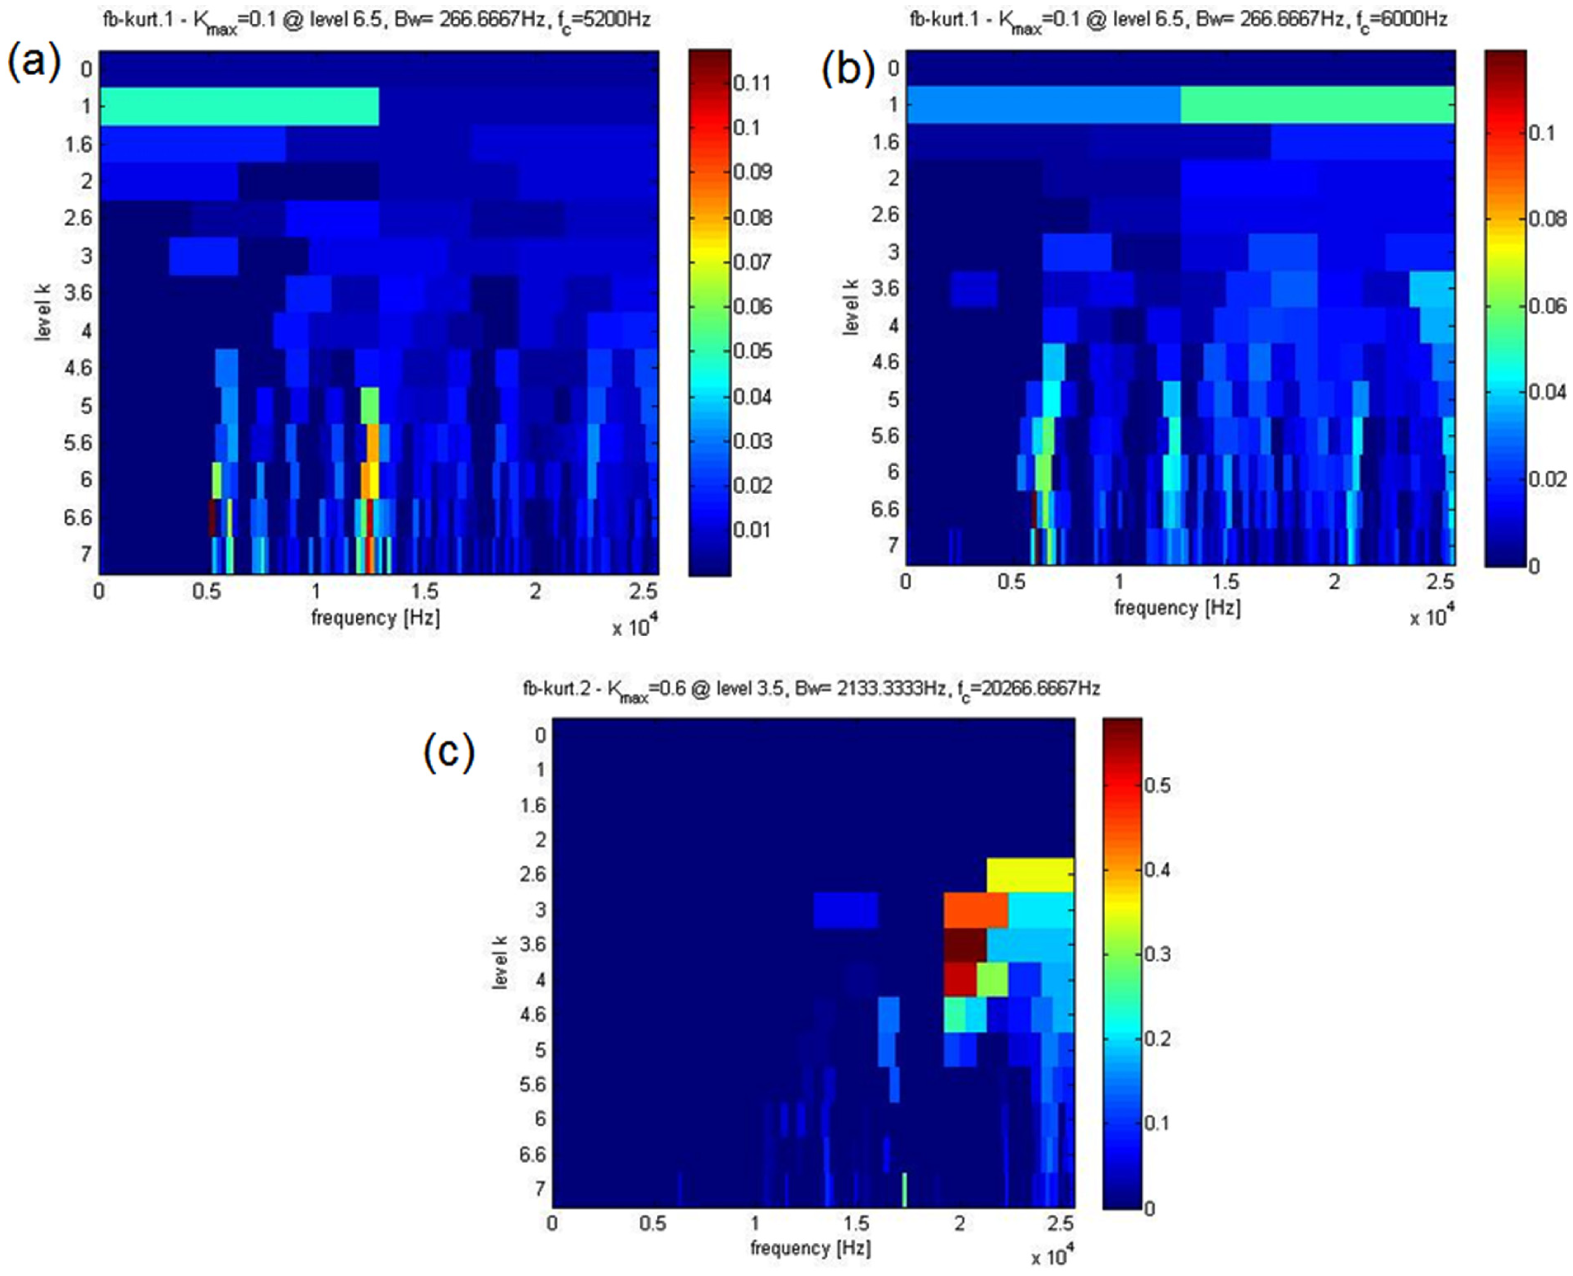
Kurtograms of non-deterministic signal for (a) fault-free, (b) minor damage and (c) major damage (110% maximum take-off power, X-direction).
Enveloped spectra of the non-deterministic signal for (a) fault-free, (b) minor and (c) major damage (100% maximum continuous power, X-direction).
Enveloped spectra of the non-deterministic signal for (a) fault-free, (b) major and (c) minor damage (80% of maximum continuous power, X-direction).
Enveloped spectra of non-deterministic signal for (a) fault-free, (b) minor and (c) major damage (110% of maximum take-off power, Y-direction).
Enveloped spectra of the non-deterministic signal for (a) fault-free, (b) minor and (c) major damage (100% of maximum continuous power, Y-direction).
Enveloped spectra of the non-deterministic signal for (a) Fault-free, (b) minor and (c) major damage (80% of maximum continuous power, Y-direction).
Enveloped spectra of the non-deterministic signal for (a) fault-free, (b) major and (c) minor damage (110% of maximum take-off power, Z-direction).
Enveloped spectra of the non-deterministic signal for (a) fault-free, (b) minor and (c) major damage (100% of maximum continuous power, Z-direction).
Enveloped spectra of the non-deterministic signal for (a) fault-free, (b) minor and (c) major damage (80% of maximum continuous power, Z-direction).
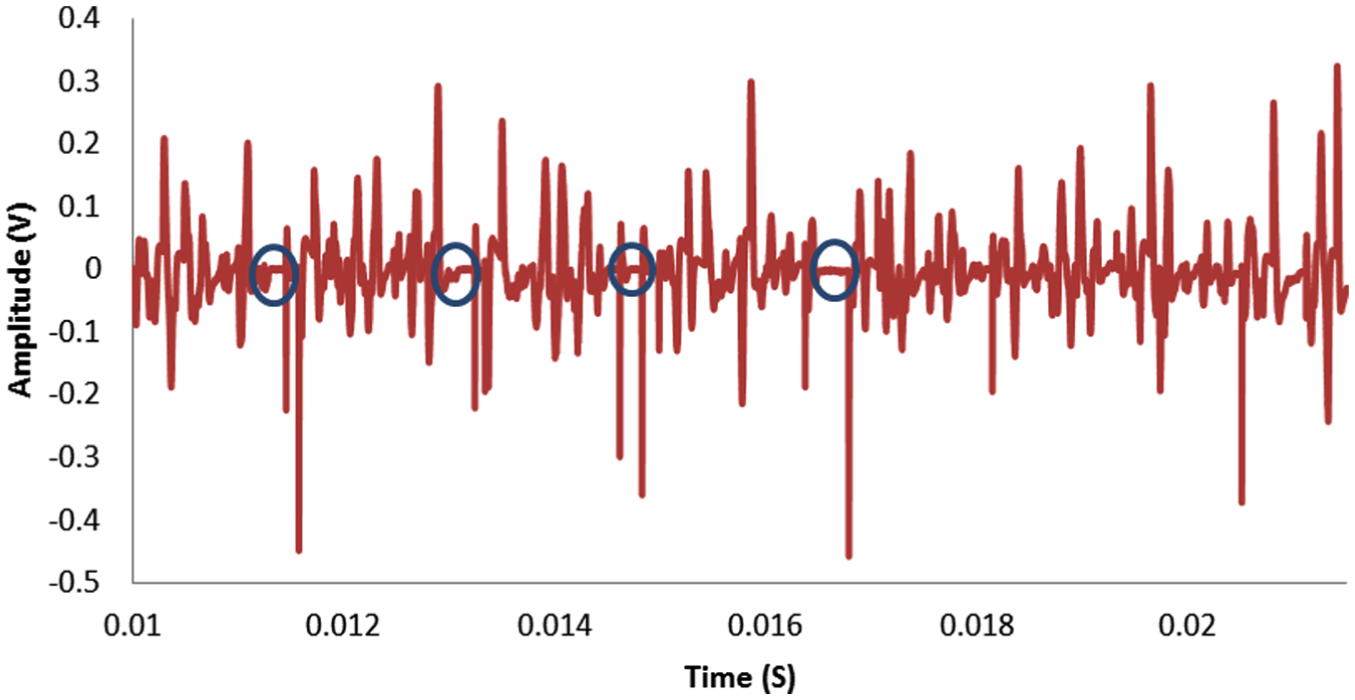
Typical AE time waveform (fault-free condition, 100% maximum continuous power).
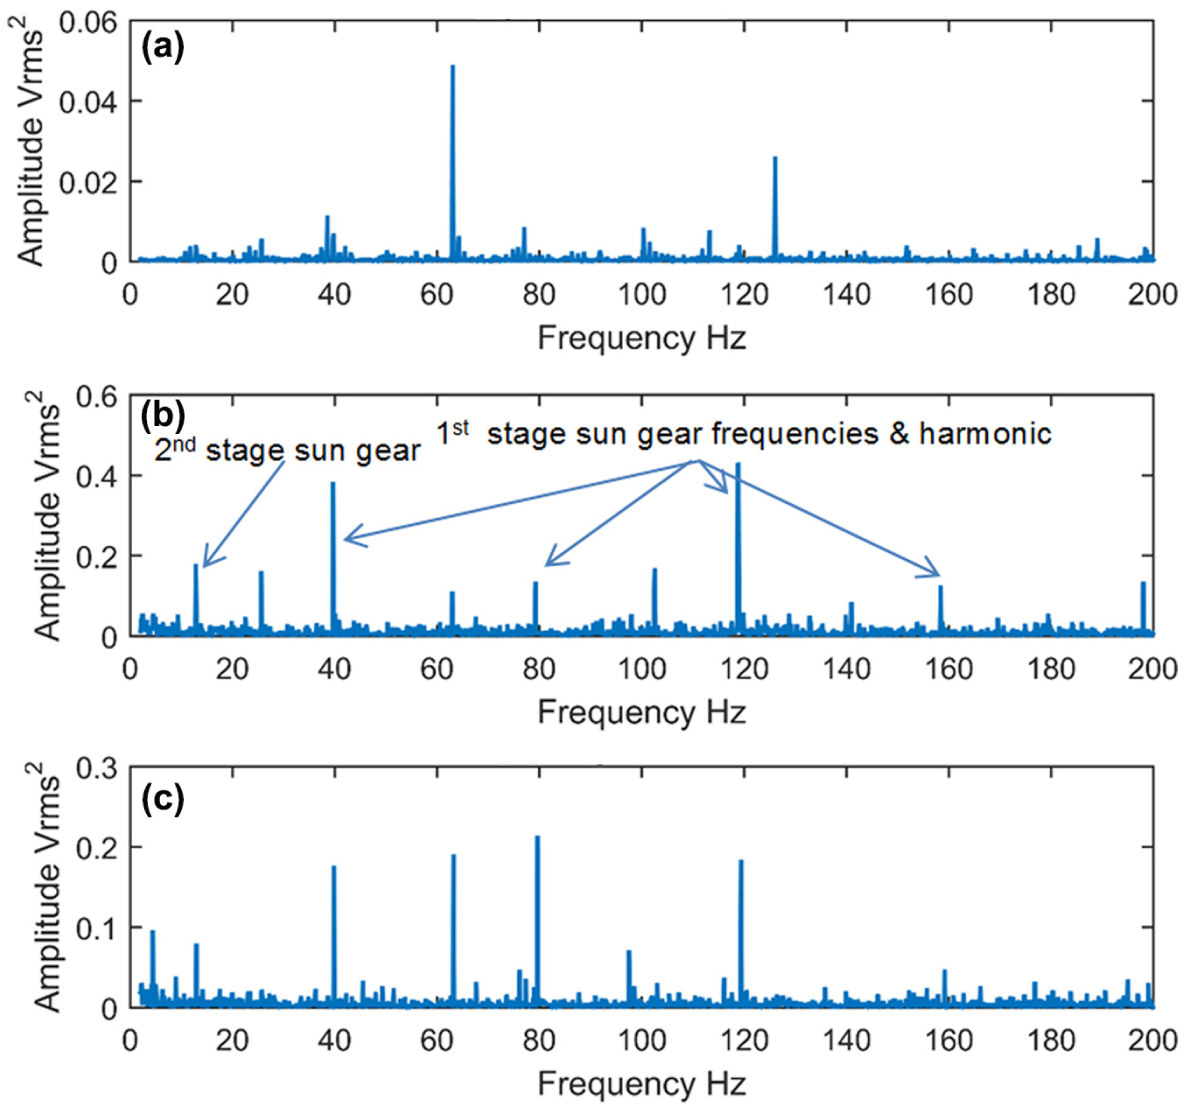
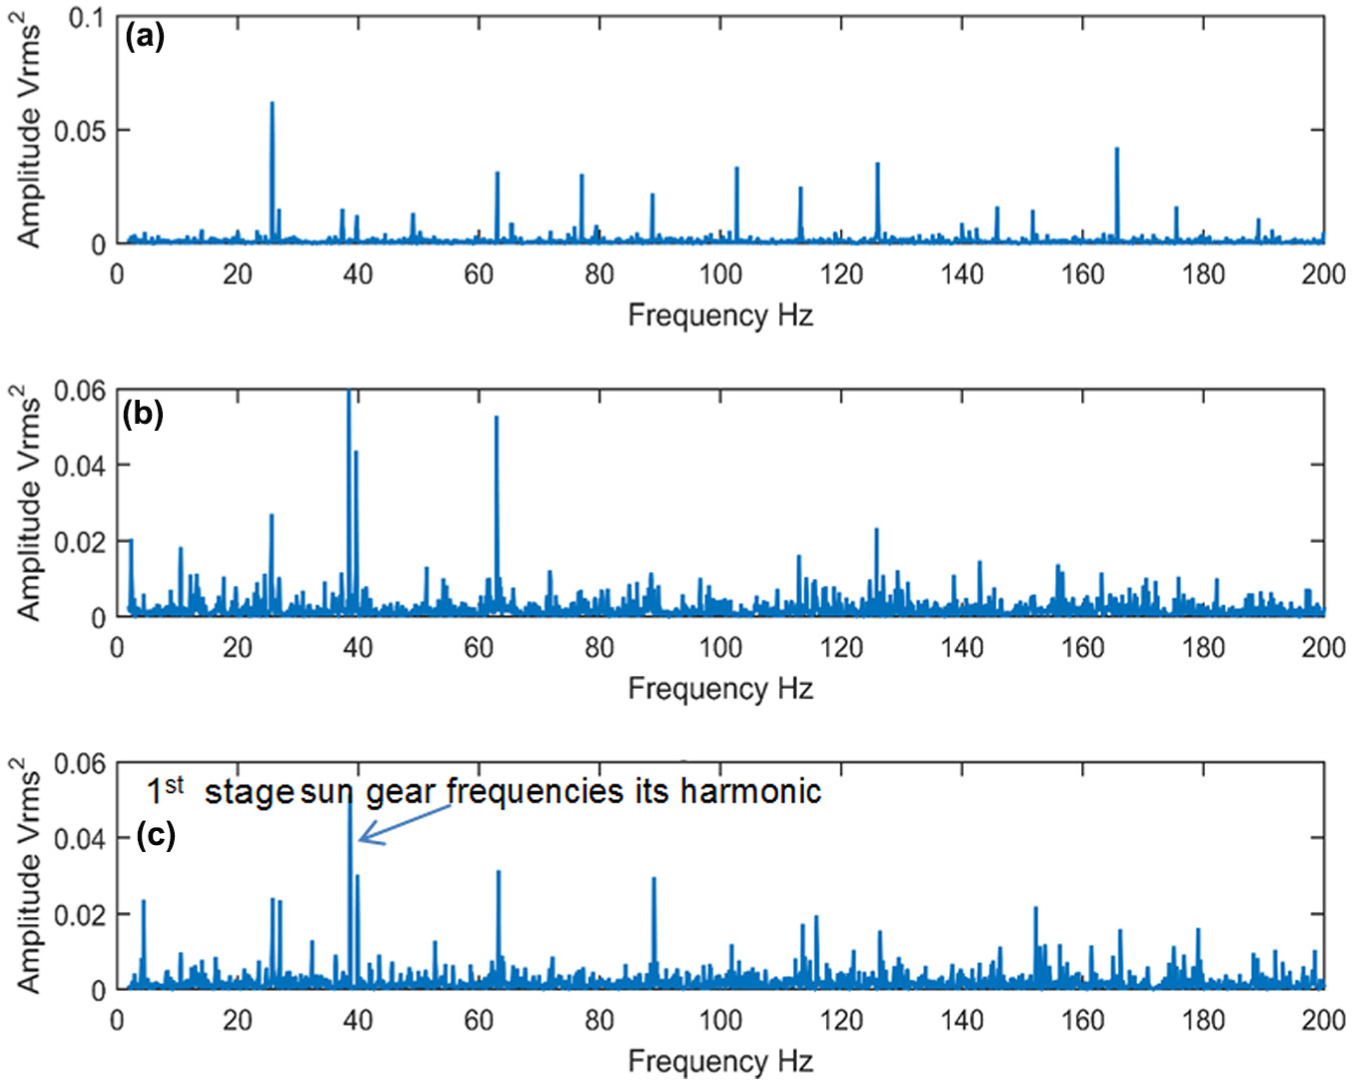
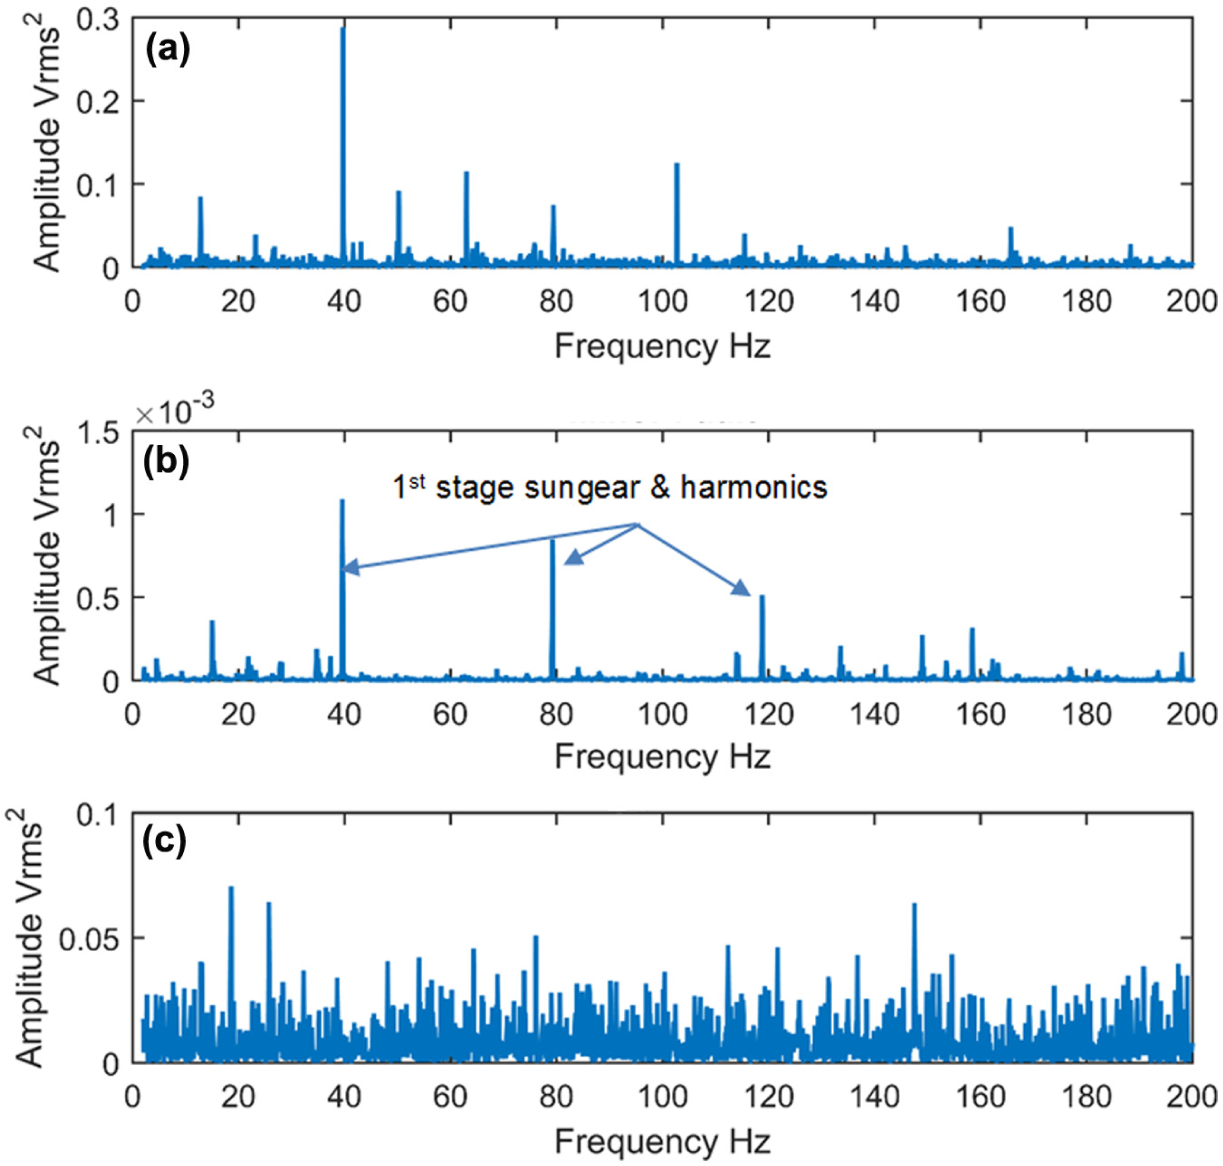
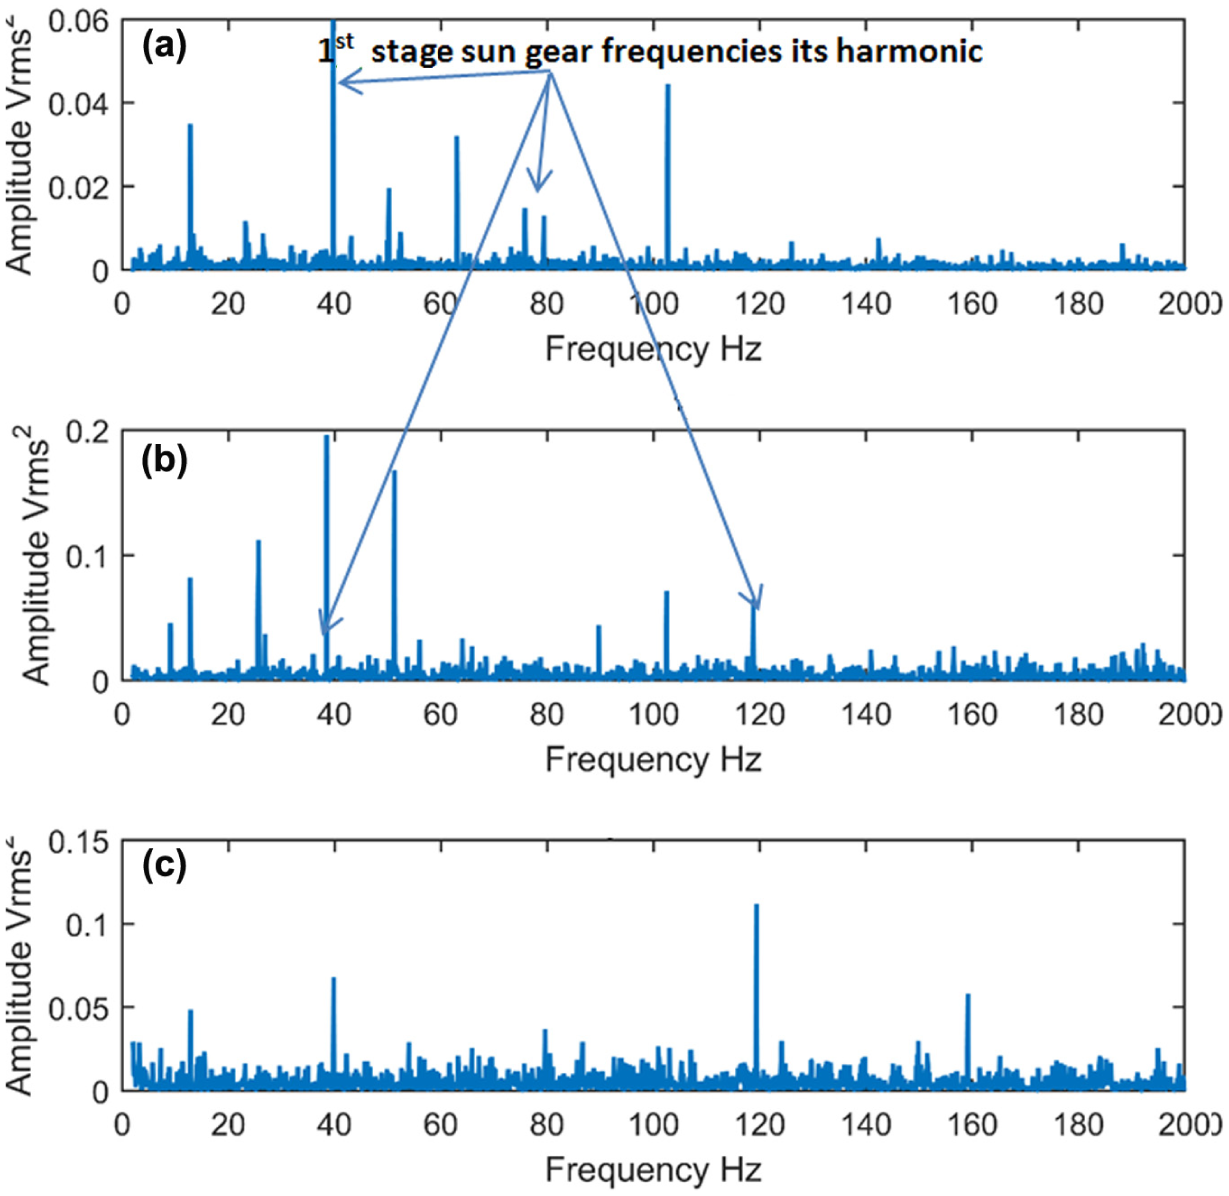
Observation from the spectra of the enveloped signal in the X-direction at 110% maximum take-off power, 100% and 80% maximum continuous power, see Figures 10 to 12, respectively, showed no presence of fault frequencies associated with the defective planetary bearing in the spectrum, except for the case of 110% maximum take-off power, see Figure 10, where the outer race defect (ORD) frequency (96 Hz) and the second harmonic of cage defect frequency (15 Hz) were detected. However, the minor fault condition was not identified. It is apparent that the signal separation had not completely removed the gear mesh and shaft frequencies, particularly the sun gears frequencies and its harmonics for first and second epicyclic stages (38.8 and 13.2 Hz, respectively), which were detected, see Figures 13 to 15. The existence of these frequencies is due to the fact that the vibration signal used in this analysis was not synchronised to any particular shaft.
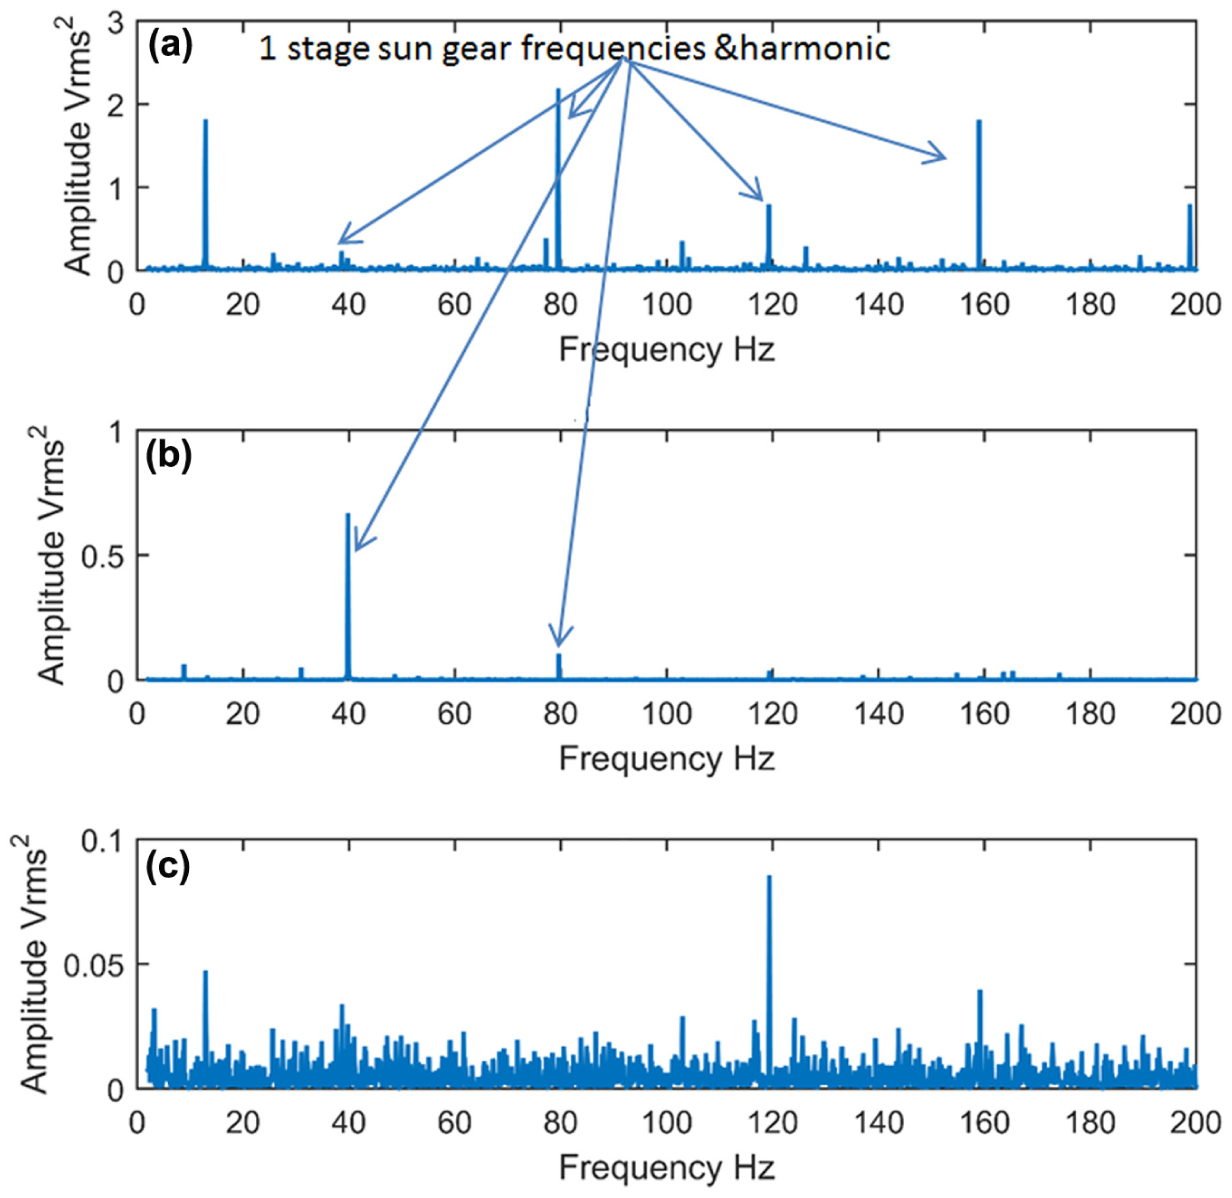
Results of Y-direction, see Figures 16 and 18, showed the presence of the ORD frequency (96 Hz) for both minor and major fault cases at 110% of maximum take-off power, while no fault frequency was identified in envelope spectra for the 100% and 80% maximum continuous power, reinforcing the observations noted from measurements taken in the X-direction. Furthermore, sun and planet gears frequencies were observed in the envelope spectrum for the measurement in this direction (Y-direction).
Observations of measurements taken in the Z-direction, see Figures 19 and 21, showed the presence of the ORD frequency (96 Hz) and its harmonic at 110% maximum take-off power for both minor and major fault cases, reinforcing the observations in the Y-direction. The cage fault frequency was identified in envelope spectra for the major defect at 100% maximum continuous power and minor defect condition at 80% maximum continuous power. Compared to X- and Y-directions, the observations in the Z-direction showed the presence of some gears frequencies in envelope spectra such as first stage sun gear frequency (38.8 Hz) and it harmonics.
AE observations
A typical AE waveform associated with 100% maximum continuous power is presented in Figure 19. Noted was the intermittent breakup of the AE signal, as highlighted in Figure 19. The frequency of the signal loss corresponded to the second epicyclic stage gear mesh frequency. Irrespective of this signal breakage, further processing was undertaken on the acquired waveform.
Figure 23(a) shows the AE signature prior to, and after signal separation of the deterministic components. Figure 23(b) clearly exhibited periodic shocks events that were masked by background noise in the original time trace.
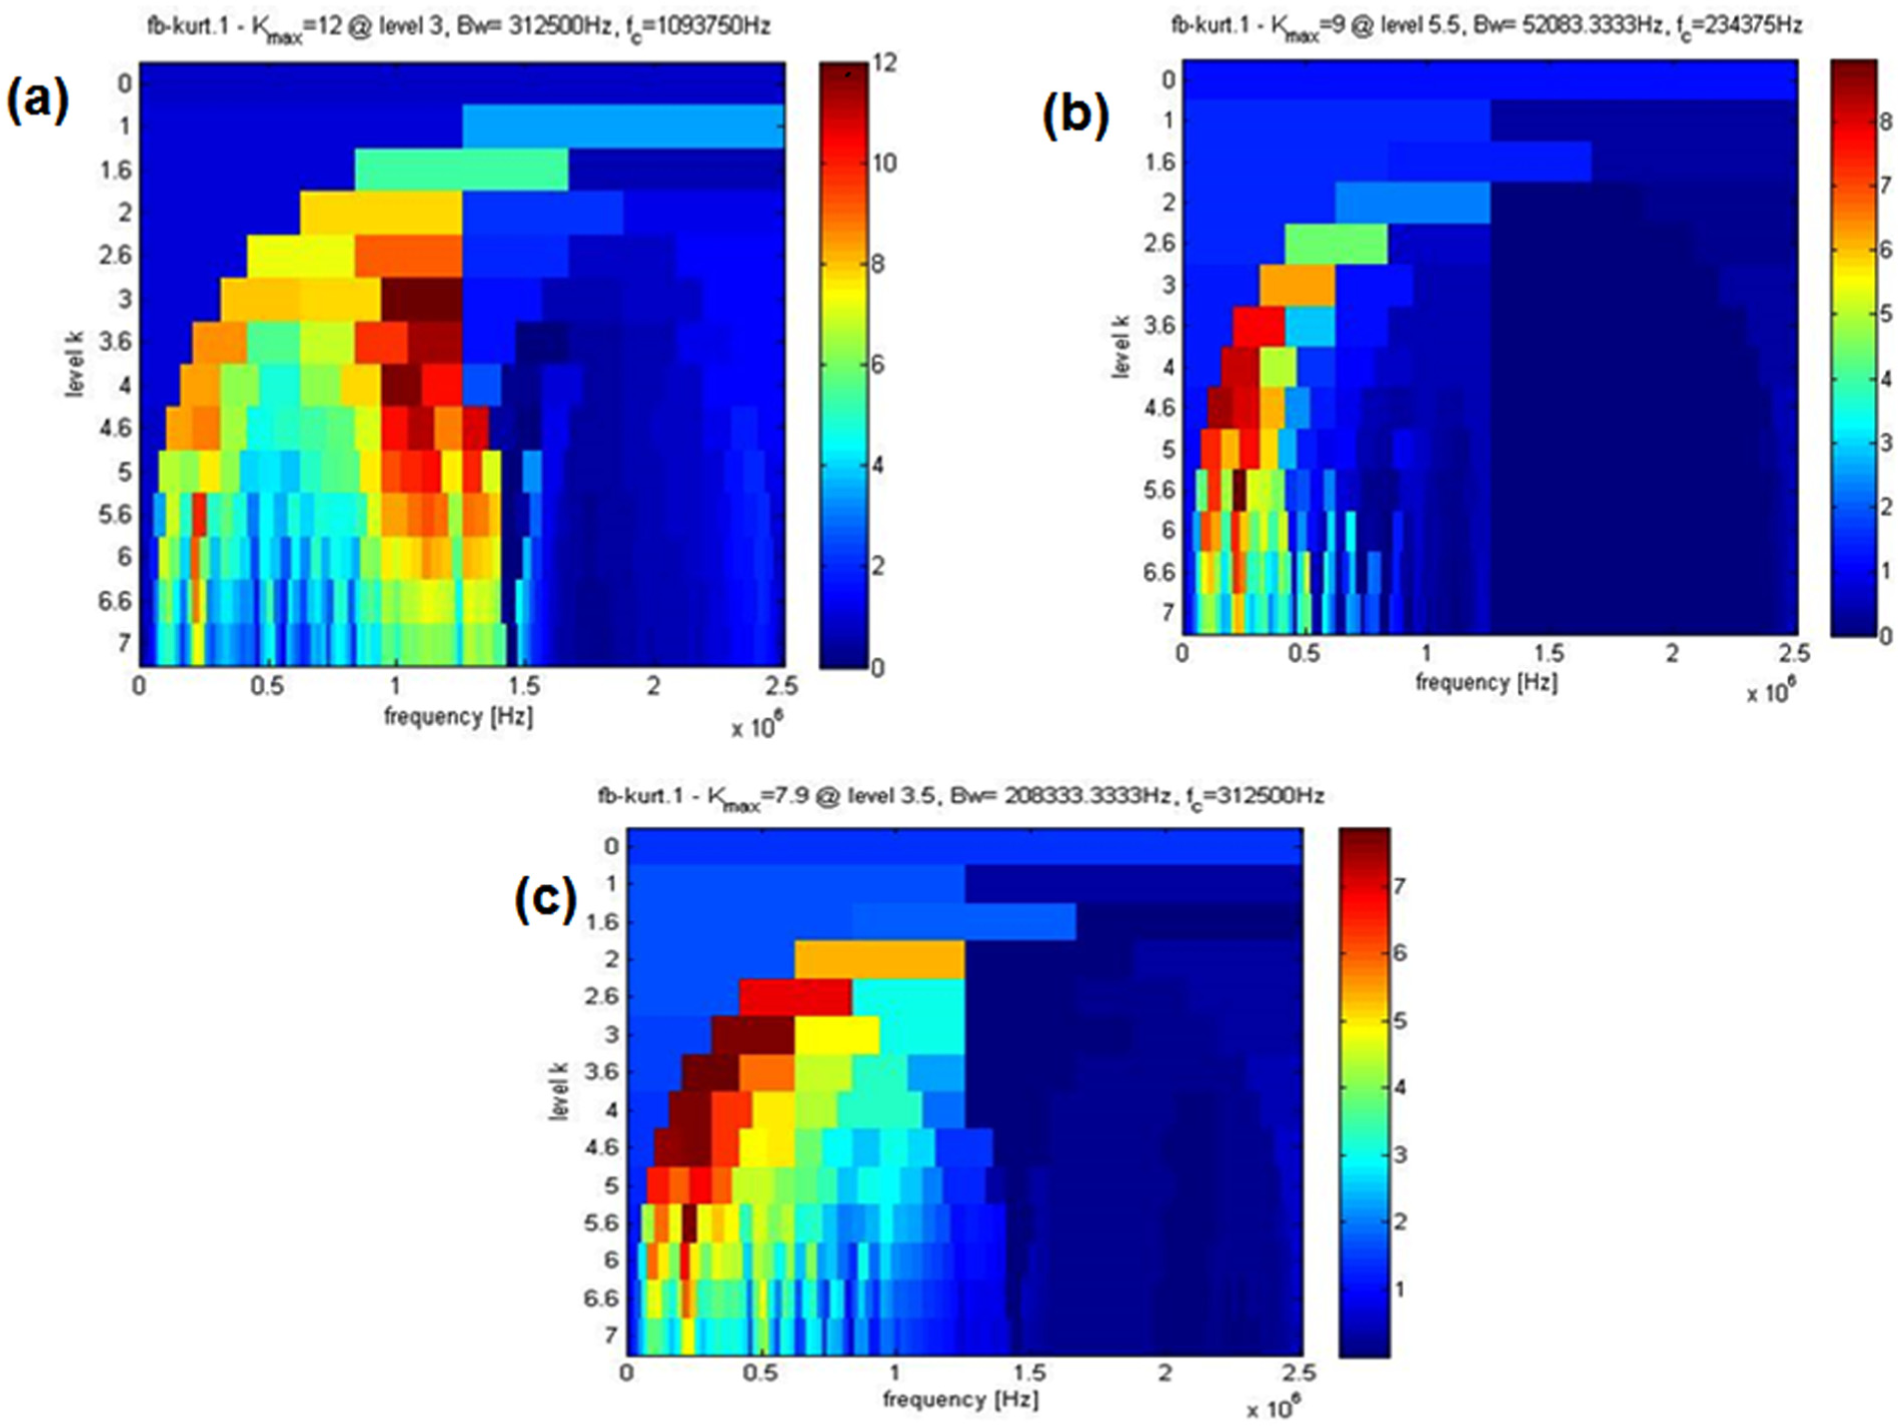
SK kurtograms: (a) fault-free, (b) minor and (c) major defects (110% maximum take-off power).
The SK was employed to extract the filter characteristics which were utilised for envelope analysis on measured AE signatures. Associated typical kurtograms of SK analysis are shown in Figure 23. The result of maximum kurtosis showed that there were no noticeable differences between healthy and faulty conditions.
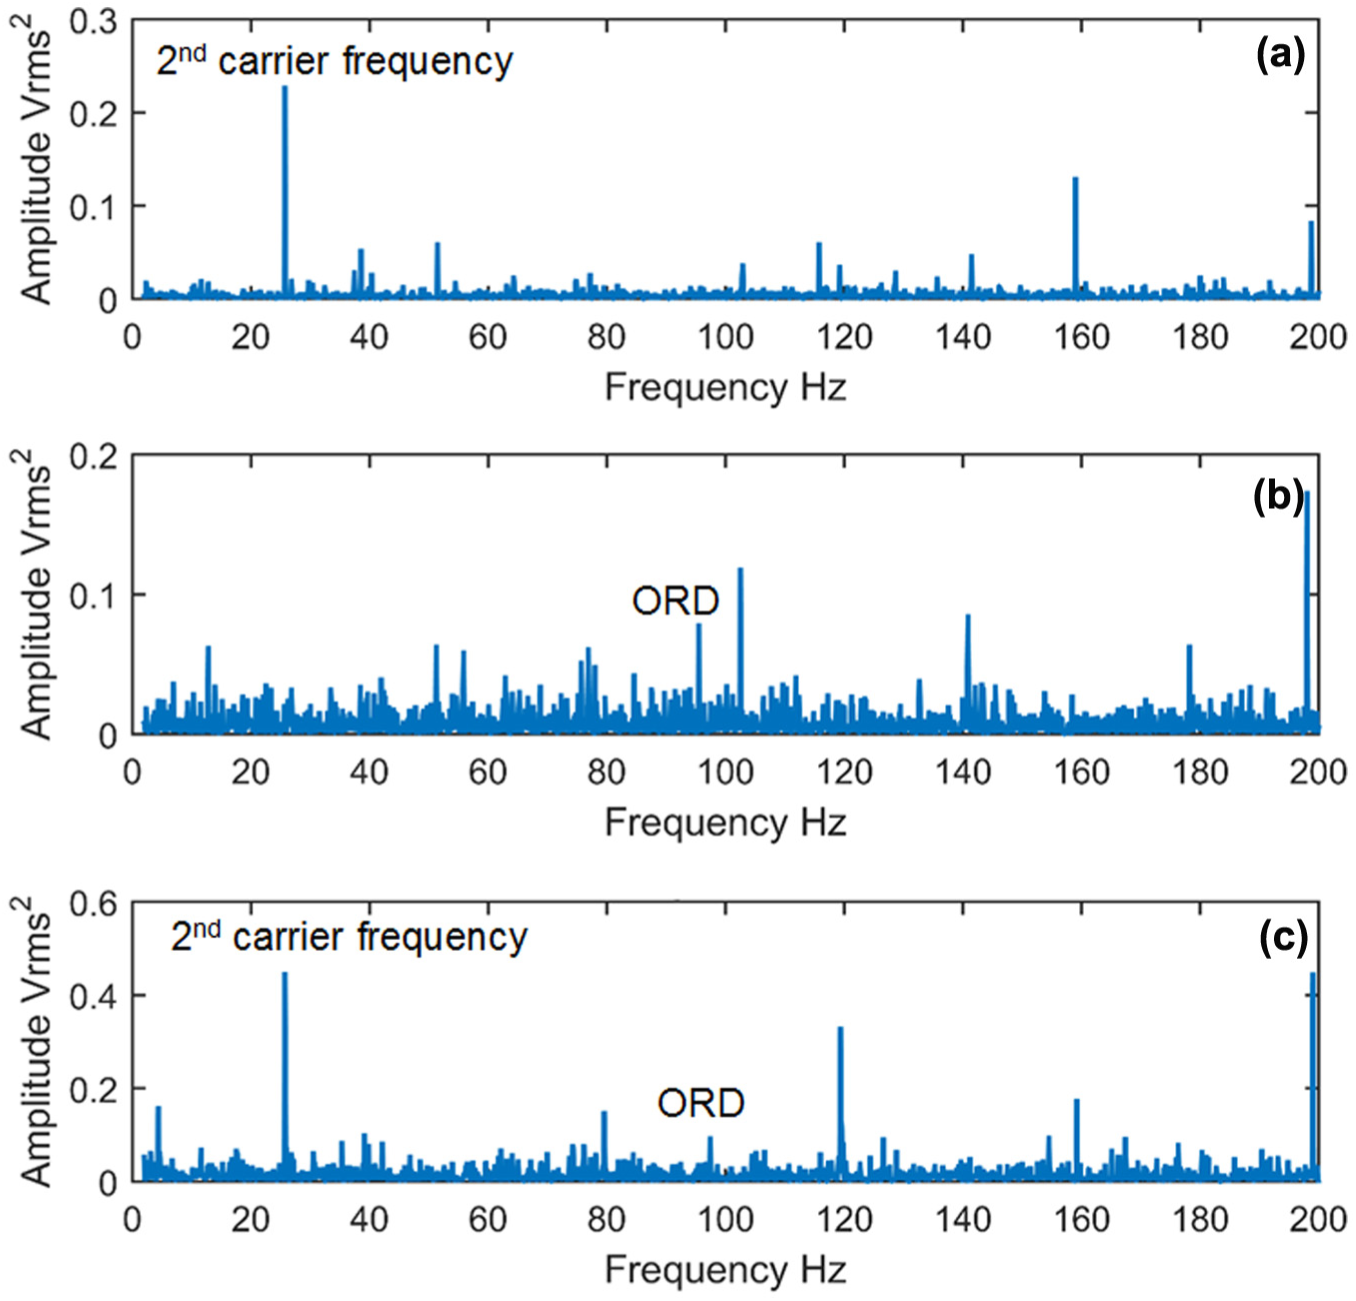
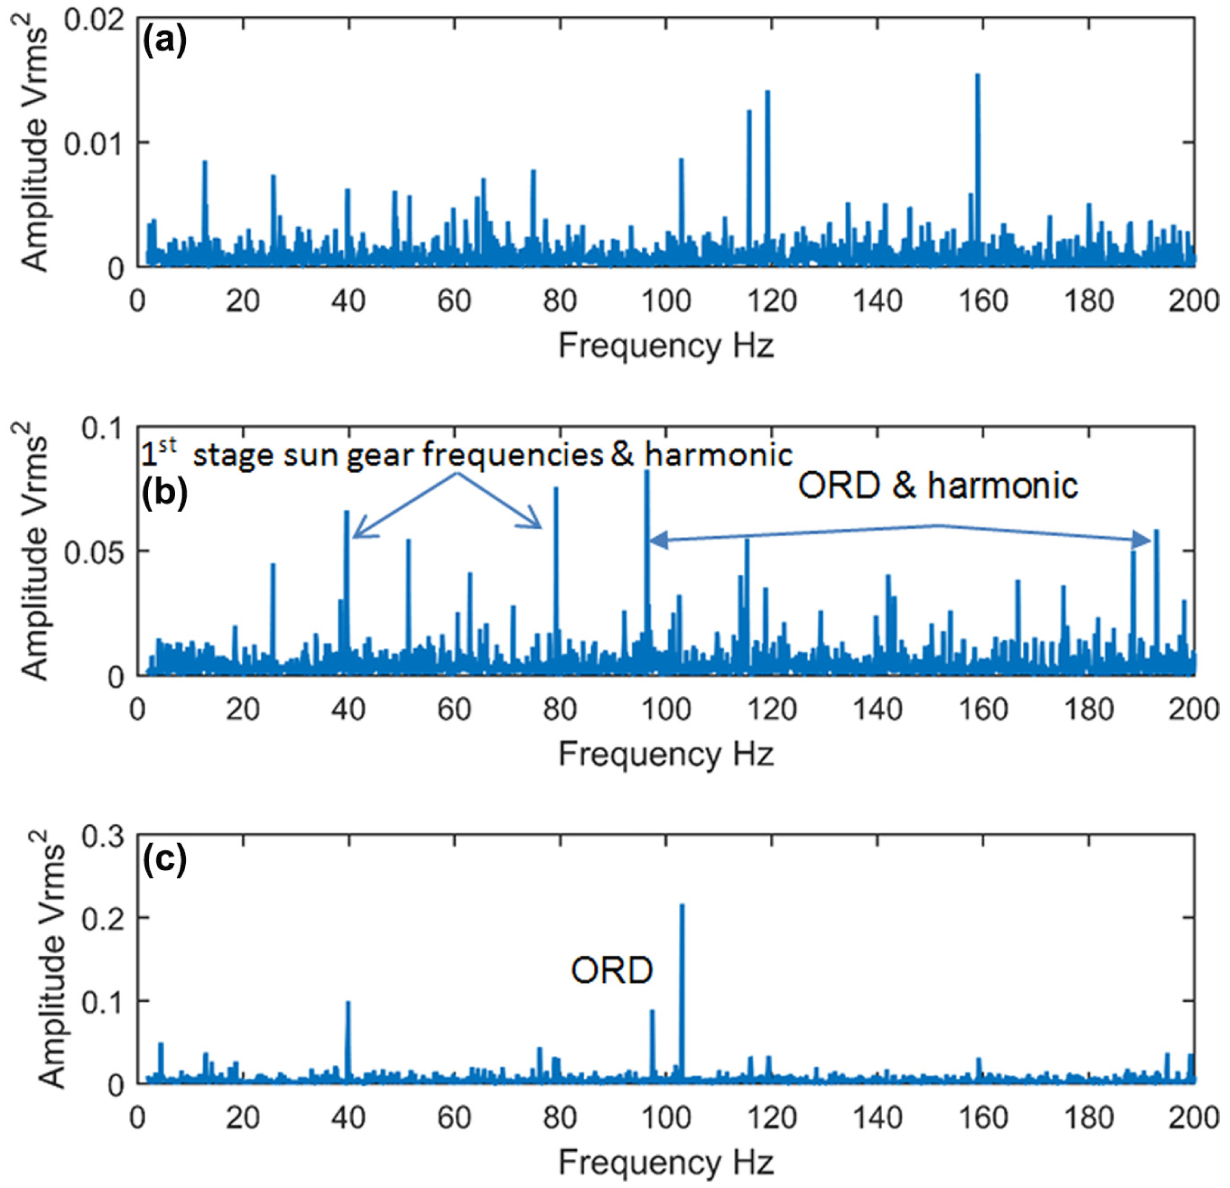
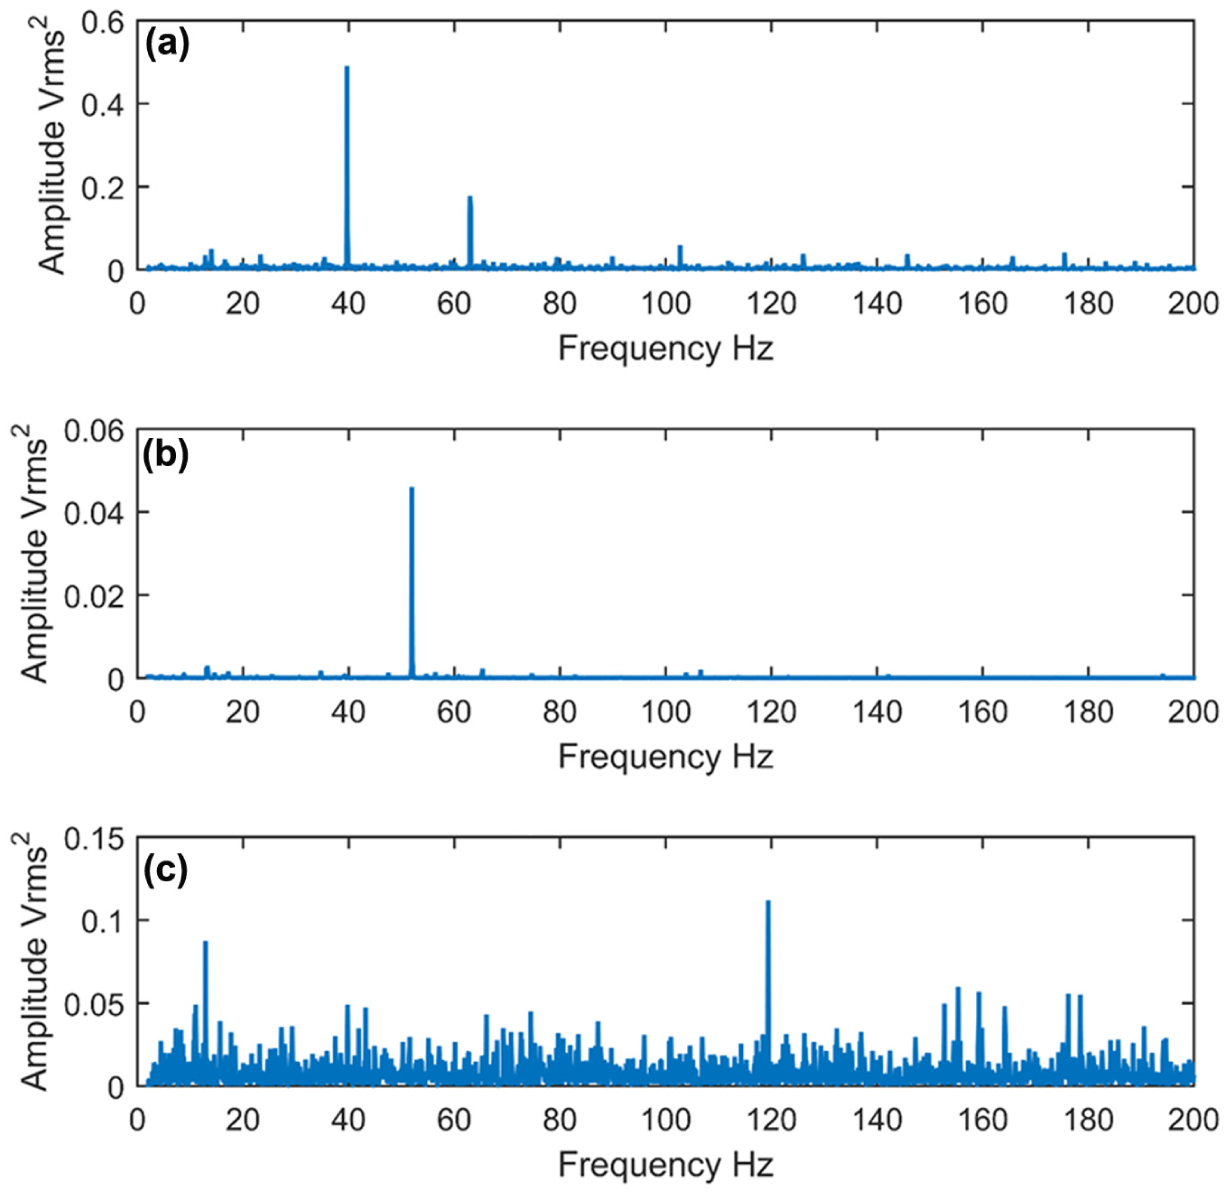
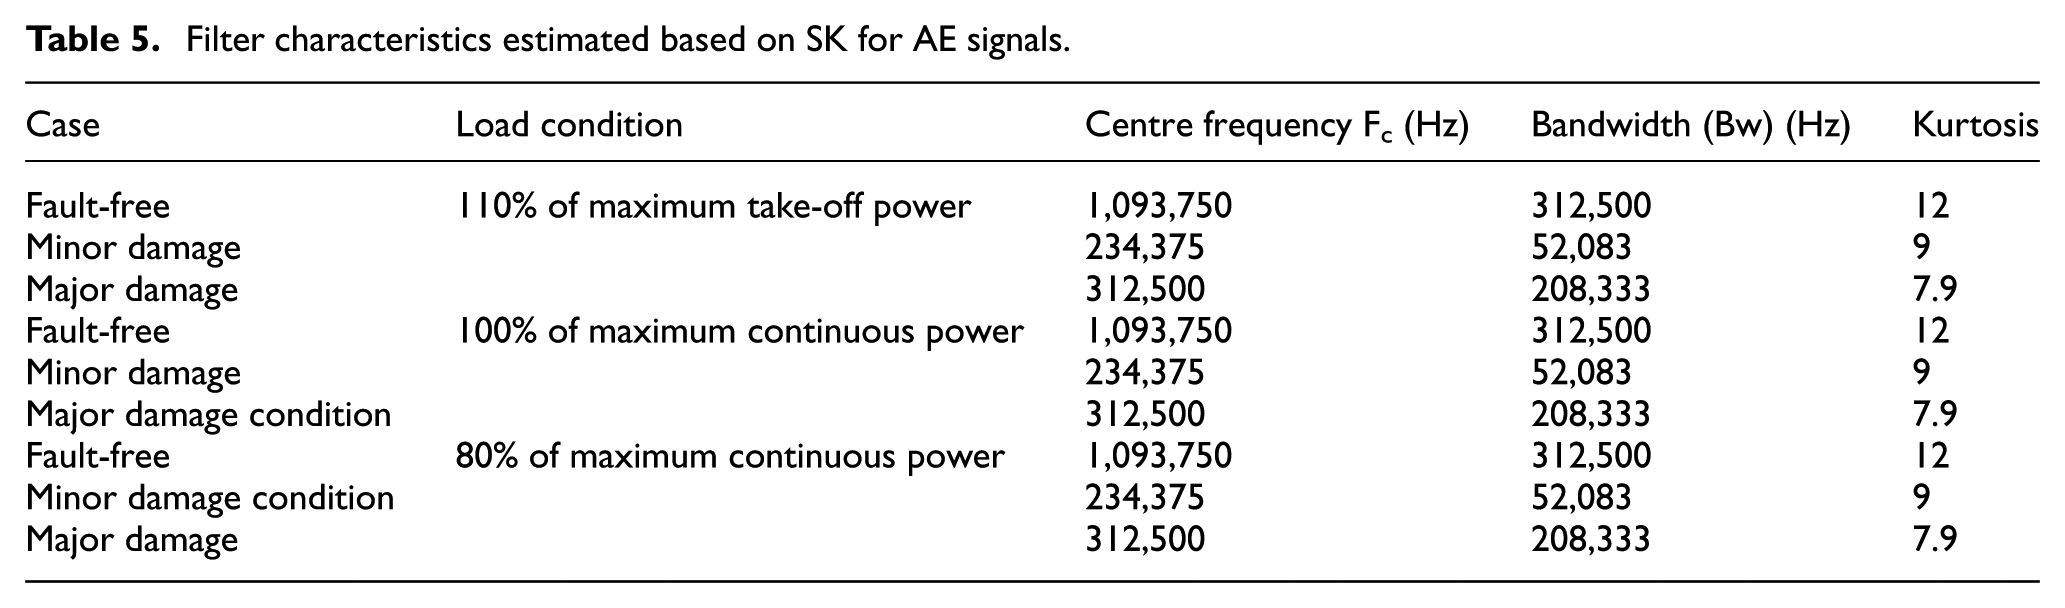
The envelope analysis was undertaken using the central frequency Fc and bandwidth (Bw) estimated by SK analysis, see Table 5. Observations of Figures 24 to 26 showed the presence of the bearing ORD frequency (96 Hz) and its harmonic (192 Hz) for both minor and major damages under different loading conditions.
Filter characteristics estimated based on SK for AE signals.
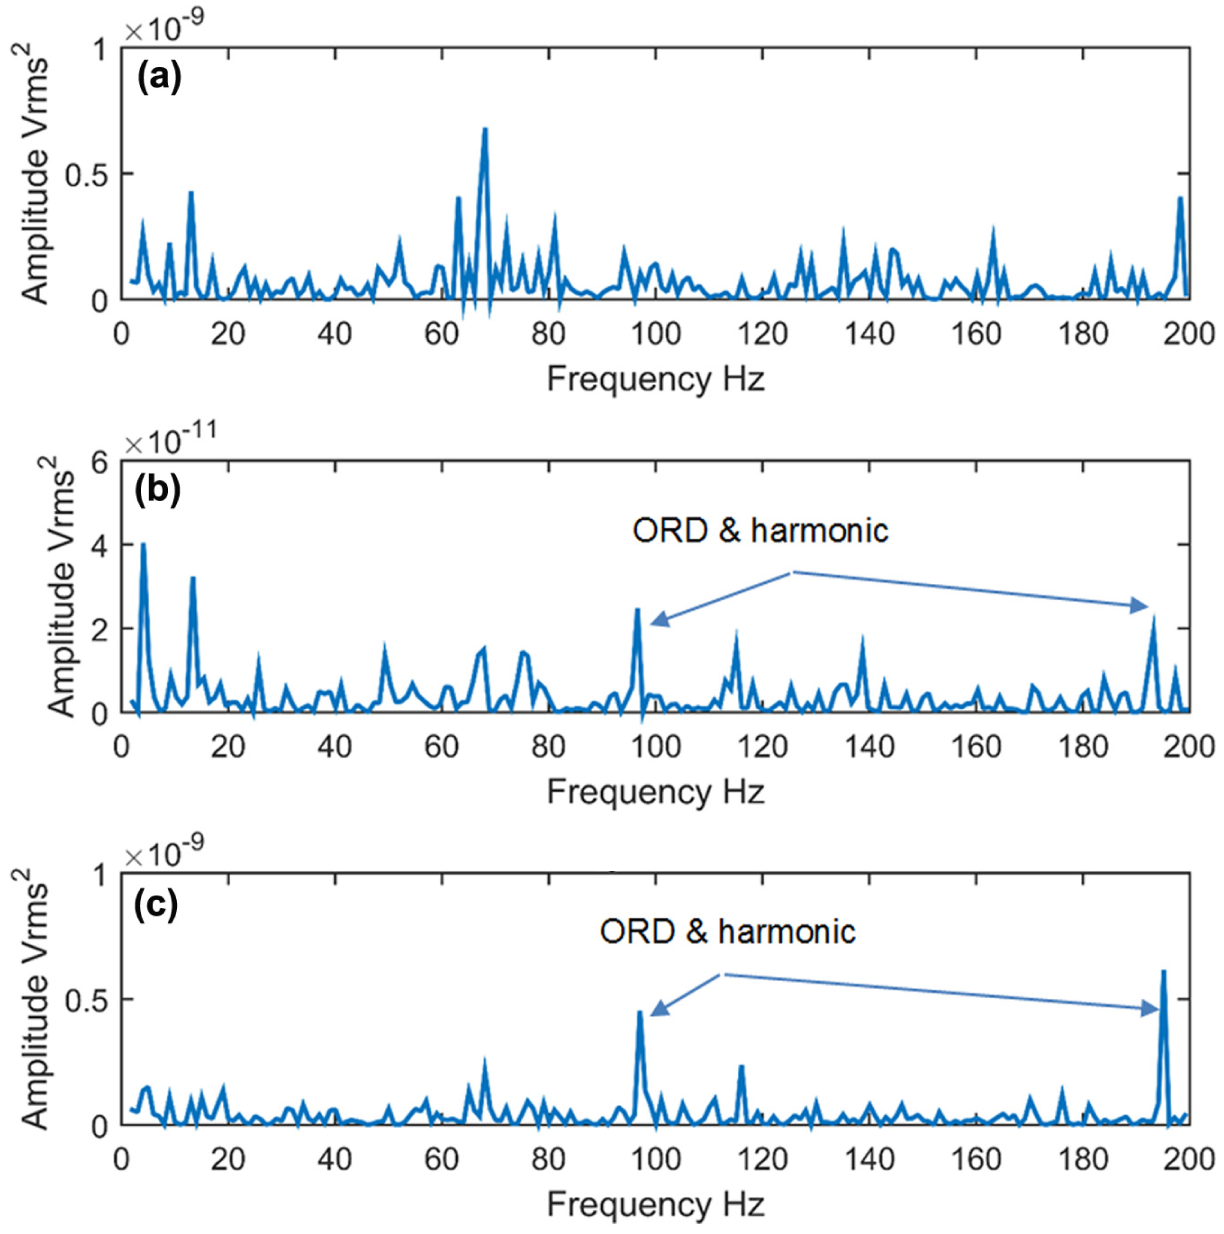
Enveloped spectra of AE signal: (a) fault-free, (b) major and (c) minor bearing defects at 110% maximum take-off power.
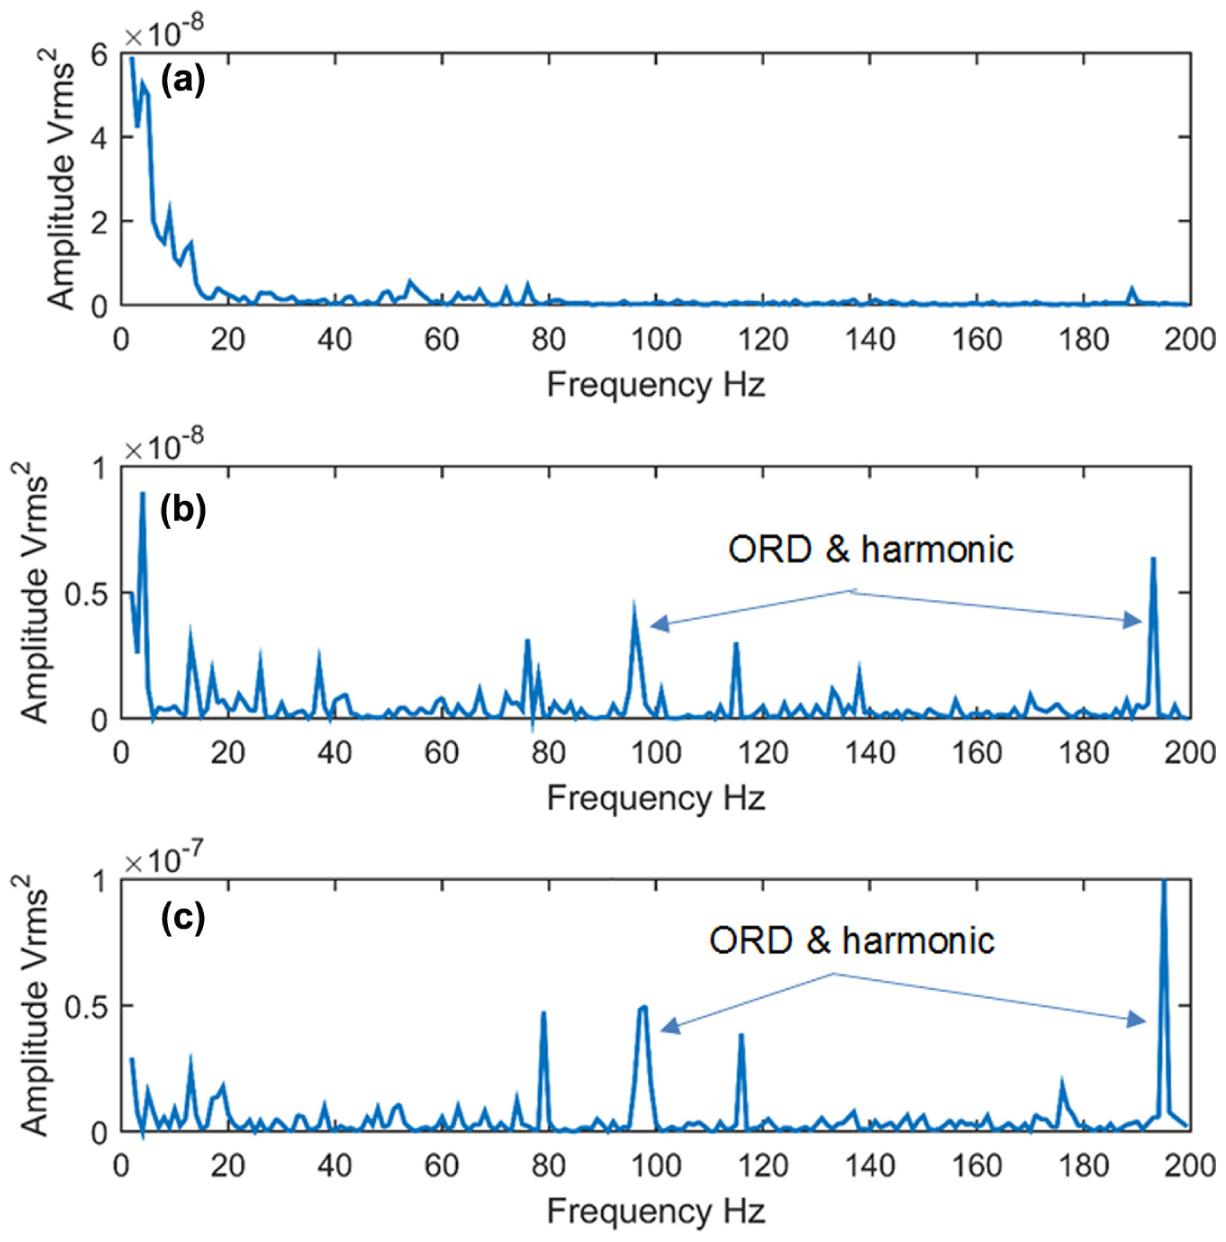
Enveloped spectra of AE signal: (a) fault-free, (b) major and (c) minor bearing defects at 100% maximum continuous power.
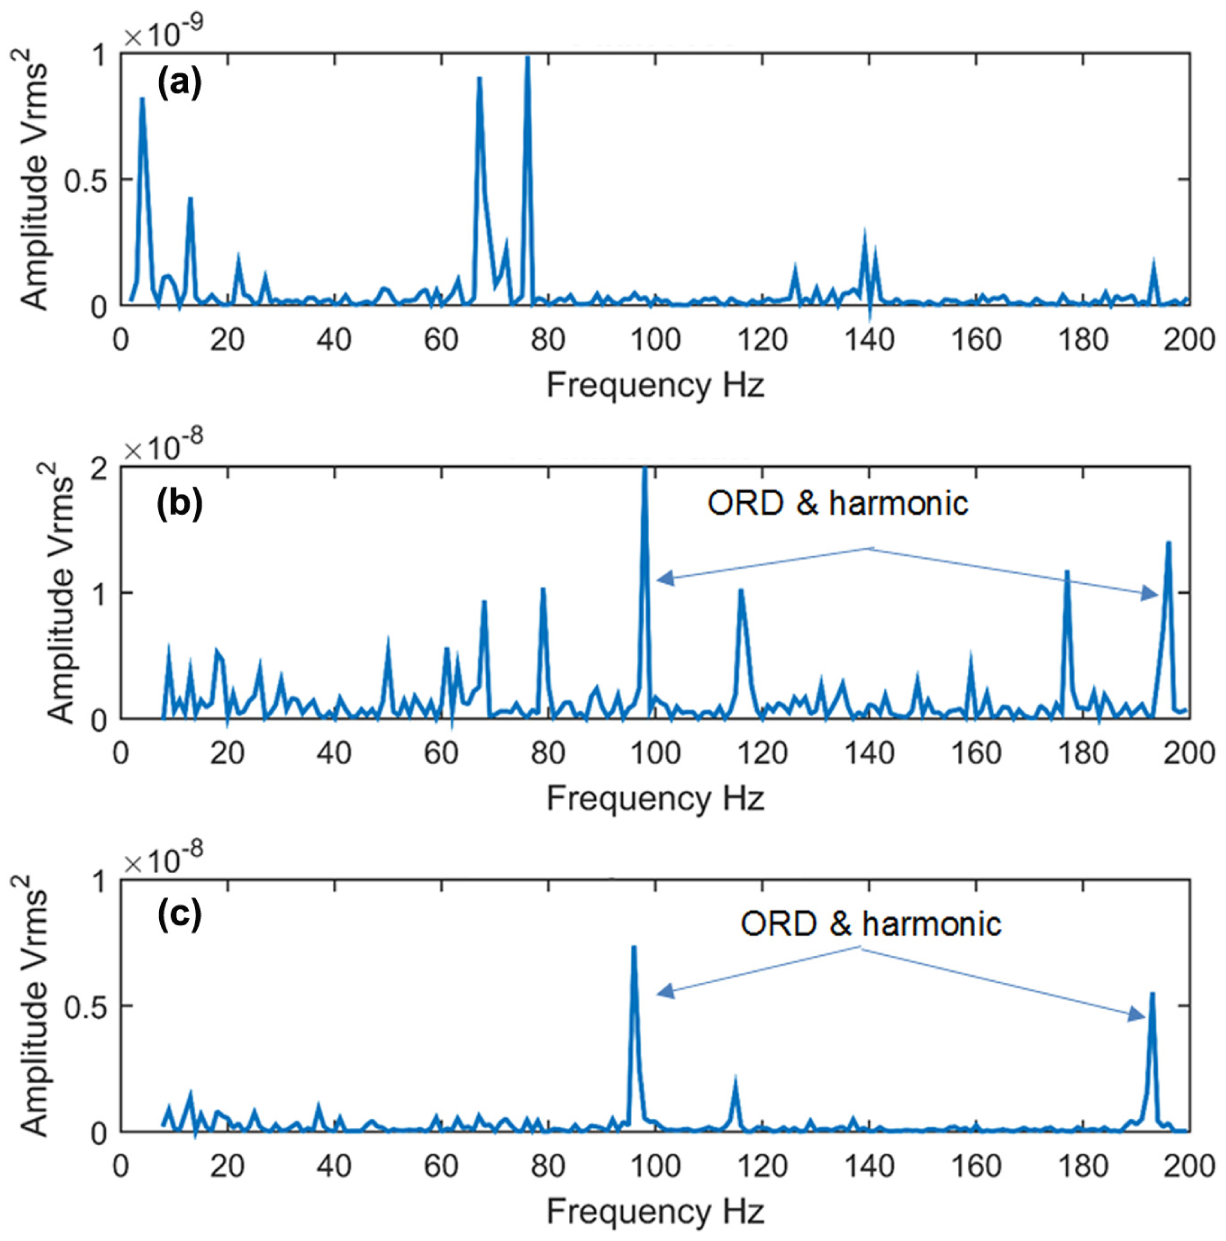
Enveloped spectra of AE signal: (a) fault-free, (b) minor and (c) major bearing defects at 80% maximum continuous power.
Discussion and conclusion
To increase the signal-to-noise level under strong background noise, the AE sensor (PWAS) was attached on the surface of the planet carrier. An advanced wireless transmission system was employed for this investigation. In its current form, the wireless transfer system is only able to support a single sensor; therefore, it was necessary to select a location at which to attach the sensor. The dish of the planet carrier provided ideal location due to the fact that most of the helicopters share same design feature of planet carrier. In addition, it is the closer part to bearings which are the root cause of the most gearbox failures.
The acquired AE signal contains clear peaks at typical gear mesh frequencies showing that a meaningful signal is being transferred from the sensor. Signal energy levels varied enormously with frequency; typical Fourier amplitudes at 10 kHz are four orders of magnitude larger than those at 1 MHz. It is unusual to be able to make these comparisons since many AE sensors are only useful in a limited frequency range. However, the broadband sensitivity of the PWAS sensor also presents challenges since the large energy levels at low frequency which are present within the gearbox can affect the sensor. In addition, intermittent AE signal transmission was observed on the signal; this was attributed to the large vibrations impacting on the sensory-side circuitry.
The techniques used in this article are typically used for applications where strong background noise masks the defect signature of interest within the measured vibration signature. The AE signal is more susceptible to background noise and in this case, the arduous transmission path from the outer race through the rollers to the inner race and then the planet carrier makes the ability to identify ORDs, even more, challenging. However, the use of the wireless system incorporated into the MGB has contributed significantly to improving the SNR.
A comparison of the vibration and AE analysis showed AE analysis was able to identify the presence of the bearing ORD frequency (96 Hz) and its harmonic (192 Hz) for both minor and major damaged for all loading cases based on observations on the enveloped spectra. However, for vibration analysis, the ORD for minor damage case was only detected for the 110% the maximum take-off power condition in Y- and Z-directions. The inner race defect was not detected by both AE and vibration analysis due to the nature of the inner race fault, as shown in Figure 5. Such a distributed fault (natural spalling all around the race) does not generate the theoretical inner race defect frequency due to the absence of singular impacts when bearing rollers/balls passing the inner race.
For the vibration analysis, the measurement taken in X-direction showed no fault was identified for the minor damaged condition under all load conditions. In addition, the enveloped spectrum was dominated by the gear mesh frequencies and their harmonics, and as such the bearing defect frequencies were not evident. However, AE analysis was able to identify both the minor and major defect conditions. Detection of the small bearing defect gives the AE an indisputable diagnosis advantage and emphasis the benefit of having sensors embedded with in the gearbox.
The ability of applied signal processing techniques to identify the presence of bearing fault is based on removing the masked signal and the identification of particular frequency regions with high impact energy; these impacts are due to the presence of the bearing defect which affects bearing sliding motion. Results of vibration analysis show sensitivity to the direction of vibration measurement.
Vibration analysis showed the fault detection depended on the measurement direction with measurements in Y and Z showing stronger signal components compared to the X-direction (vibration signals acquired from the X-direction was dominated by the noise). In addition, the fault detection was best for vibration signals acquired under maximum take-off load (110% load).
In summary, an investigation employing external vibration and internal AE measurements to identify the presence of a bearing defect in a CS-29 ‘Category A’ helicopter MGB has been undertaken. A series of signal processing techniques were applied to extract the bearing fault signature, which included an adaptive filter, SK and envelope analysis. The combination of these techniques demonstrated the ability to identify the presence of the various defect sizes of bearing in comparison to a typical frequency spectrum. From the results presented, it was clearly evident that the internal AE sensor offered a much earlier indication of damage compared to the traditional vibration analysis.
Footnotes
Acknowledgements
This work was conducted as part of EASA study 2015.OP.13 into improved detection techniques for helicopter main gearbox defects.
Declaration of conflicting interests
The authors declare that there is no conflict of interest.
Funding
This research received no specific grant from any funding agency in the public, commercial or not-for-profit sectors.