
Abstract
The growing interest in precision livestock farming is prompted by a desire to understand the basic behavioural needs of the animals and optimize the contribution of each animal. The aim of this study was to develop a system that automatically generated individual animal behaviour and localization data in sheep. A sensor-fusion-system tracking individual sheep position and detecting sheep standing/lying behaviour was proposed. The mean error and standard deviation of sheep position performed by the ultra-wideband location system was 0.357 ± 0.254 m, and the sensitivity of the sheep standing and lying detection performed by infrared radiation cameras and three-dimenional computer vision technology were 98.16% and 100%, respectively. The proposed system was able to generate individual animal activity reports and the real-time detection was achieved. The system can increase the convenience for animal behaviour studies and monitoring of animal welfare in the production environment.
Keywords
Introduction
The growing attention in animal welfare from society results in stronger legislation and higher pressure for optimized husbandry systems in domestic animal production. Animal behaviour information can assist with optimizing husbandry systems resulting in efficient and sustainable animal farming. Proper animal handling leads to good animal health and welfare. Monitoring and tracking individual animal’s behaviour has subsequently played an influential role in supplying high-quality research and efficient management on-farm. 1
Basic sheep behaviour normally refers to ‘standing’, ‘lying’ and ‘feeding’ activity and flocks typically show synchronized resting and activity patterns. Reduced resting behaviour can be used as an indication of social stress in animal husbandry. 2 However, a sheep that spends too much time lying may be sick, a sheep having trouble walking may be lame and a sheep that spends little time feeding might have problems with its mouth, teeth or digestive system. Understanding an animal’s basic behaviour facilitates good management for optimal welfare and maintains production at a high level with profit. Therefore, there is an increasing interest in deploying sensors and electronic systems to monitor animal activity and automatically detect behavioural deviations.
Traditionally, sheep behaviour is observed by skilled stakeholders. 3 Video cameras are also deployed by many farms for supervising animals, especially during lambing. Both direct observation and camera monitoring are time-consuming operations. Additional wearable sensors are added to register animal’s behaviour in animal research. For example, tri-axial accelerometers are used to detect lying time 4 and heat events. 5 Computer-vision-based systems have replaced human inspectors in many tasks in food-related industries. 6 Shao and Xin 7 described an image segmentation and feature extraction method for tracking animal movement using a single camera. Porto et al. 8 proposed a multi-camera video system to detect cow lying behaviour and standing behaviour 9 based on cow’s location where the resting area refers to lying and feeding alley refers to standing. This is different from sheep housing in Norway 10 where sheep are fed and kept in the same pen. Moreover, the barn with limited illumination, complex background and dusty environment can restrict the performance of computer vision analysis when using only the RGB camera.
Using computer vision system makes it possible to consistently monitor animal’s behaviour. However, to optimize the contribution of each animal, it requires the system to identify and locate individual animals of the herd. A computer vision–based identification method was proposed to identify cows and estimate body conditions. 11 Passive radio-frequency identifications (RFIDs) and photoelectric sensors are used to register food intake in dairy farms. 12 Determining the location and identity of animals in a barn has traditionally been made with passive RFID technology, where the position is determined using passive transponders on the animals (collars or subcutaneous implants), and antennas are placed at places of interest in the barn. The disadvantage of this method is that the antennas are sensitive to disturbances and the system only gives an indication of the position of the animals near an antenna. In addition, there are problems with mismatch recordings when the animals are crowded or change location around the antenna. A real-time location system based on ultra-wideband (UWB) gives new opportunities to determine the animals’ position in real-time with good precision (Porto et al. 2014). An existing system (Ubisense, UK) identifies the localization of moving objects in various environments, and the accuracy of the system was declared to vary between 30 and 100 cm.13,14 Porto et al. 15 evaluated the Ubisense system performance in the semi-open free-stall cow farm, and the localization mean error of the system was stated as 0.515 m for the tags applied to the cows. Although these studies showed the possibility for tracking individual animals on-farm, the location information was generated using the position along the x- and y-direction of the barn. Specific behaviour was indicated by dividing the whole area into sub-areas, for example, that being at the feed bunk corresponds to feeding. But without evaluation of location along the z-direction, the system cannot distinguish if the cow is lying or staying in the resting area.
In the modern production environment, the identification and monitoring of individual health and welfare of animals are challenging. The task gets difficult to implement due to lack of data interoperability from multiple platforms and APIs. Therefore, a sensor-fusion back system that could automatically detect and report the standing and lying behaviours of individuals in larger pens would be very advantageous and in demand.
In this article, we combined the animal identity and location with a behaviour monitoring system to create activity registrations of individual sheep in the indoor housing environment. We met three main challenges: (1) differentiation between standing and lying behaviours, as sheep are kept and fed in the same pen; (2) the limited illumination and complex background in the barn; and (3) lack of data interoperability from multiple platforms. To solve the first challenge, we developed a three-dimensional (3D) scanning method to detect and differentiate between the standing and the lying behaviours. Second, we developed a computer vision method to separate the foreground/background by using infrared radiation (IR) images to meet the light challenge. Finally, the identification and the localization of the sheep were done using UWB technology. The identity, location and behaviour were synchronized by timestamps to generate the individual animal activity registrations.
Materials and methods
A trial was conducted in June 2018 at the NIBIO Tjøtta experimental station in the northern part of Norway (65.8 N). The sheep barn under study was a non-insulated barn which had a rectangular plan of 19.31 m × 6.96 m with one side open. The pen area had 24 pens arranged in two rows with the feeding alley in the middle. Each pen was 2 m × 1.5 m with a passage between two neighbouring pens. Within the barn, half the area with 10 pens in two rows was selected where 10 sheep were held. These animals used in the experiment were castrated males born in 2014. They were all of the Norwegian White breed which is a combination breed that provides both meat and wool. Figure 1 shows the plan of the barn under study.

Plan of the barn under study.
A UWB real-time location system was installed in the whole barn area to identify and track all 10 sheep. In addition, a multi-camera video-recording system was installed: two Intel RealSense Camera R200s were installed above two pens (Pen 2 and Pen 3 in Figure 1) to conduct a standing/lying behaviour registration test; an Axis Camera was installed above the centre of feeding alley to evaluate the UWB location system and the behaviour detection system. The identity, location and the behaviour of the individual’s data were synchronized by timestamps to generate the individual animal activity report. The experiment was conducted across a period of 2 weeks. The system overview is shown in Figure 2.
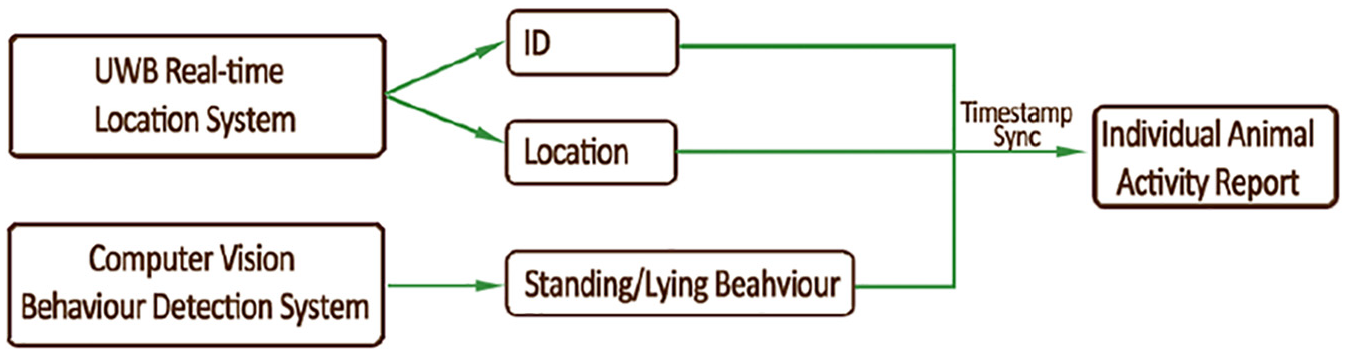
Overview of the system structure.
Real-time location system
A real-time location system based on UWB technology was developed to continuously register individual positions. We designed a new hardware and software platform specifically built for tracking animals in barns. This will give us easy access to the raw data and the possibility to add more sensors, compared to if a commercial UWB system would be used. We added a collar with sensors to the sheep under study. The tag with sensors with packaging and protection material was 69.6 g and the collar was 11.6 g.
Real-time sensor tags were built based on the Decawave DWM 1000 module. This is an IEEE 802.15.4-2011 UWB compliant module that operates on frequency bands from 3.5 to 6.5 GHz. The device also included an ST LIS2DE three-axis accelerometer that was used to measure the activity of the sensor tag. The location system contained multiple UWB devices, which, based on their programming, acted in three different roles:
Tag, which was installed on the tracked animal’s collar;
Anchor, which was used for creating a static point to define the coordinate system. It was used for estimating the distance to the tag;
Specialized anchor, which was called zero-anchor. The zero-anchor was additionally used for tag synchronization and acted as a data provider for the gateway machine.
In Figure 3, a small-scale setup is used for presenting the usage of UWB devices for location tracking. The whole process can be simplified into three steps. In the first step (Figure 3(a)), the tag

Steps for providing tag location to the back end.
The gateway application was written in Python language. It read data provided by the zero-anchor via USB connection and used the single tag’s distance information for solving the location of the tag. The location calculation was made using the MIT licenced open-source solution that allows triangulation to be made with least-squares estimation (LSE) method. 16 Depending on the result, the solved location was then forwarded to the back-end server as a JSON formatted message. In the back end, the location information was stored in a database. In addition, the raw information of the tags’ distance was also sent to the back-end server in a compressed form, in case the data are needed to be processed by other possible means.
In this experiment, we used 8 anchors and 10 tags. The plan of the anchor position is shown in Figure 4, and the measurement of the anchor position is shown in Table 1. The position was provided from UWB system every 10 s. The localization system was built to cover the entire barn so the anchors were evenly distributed over the entire 19.31 m × 6.96 m area. In this experiment, we used raw data collected from the UWB system and preprocessed the data to increase accuracy. We could see that positions calculated with just a few anchors often contained a higher error in calculated position. Therefore, we added a filter to remove the calculated positions in which only a few anchors were available. In calculation of position, we set a limit of at least six anchors to calculate position. During the experiment, there were 6% of the time slots providing distance to less than six anchors and no position was calculated from these.

Anchors installed in the barn.
Measurement of the anchors.

An Axis Camera was installed above the centre of the feeding alley to record sheep’s movement in four pens. The recordings were used for labelling the tag’s position in ground truth. Due to the low roof of the barn, the axis camera was a fisheye camera. The images from the video stream were undistorted from the fisheye view and calibrated to two-dimenional (2D) barn map coordinates. The activity of two sheep in two pens was selected (Pen 2 and Pen 3) as the ground truth dataset. The ground truth was performed using visual inspection and labelled from the interface developed based on the calibrated images. An example of labelling the control ground truth position of Tag 2 and Tag 3 is shown in Figure 5. The real-time location system was evaluated by comparing each tags position
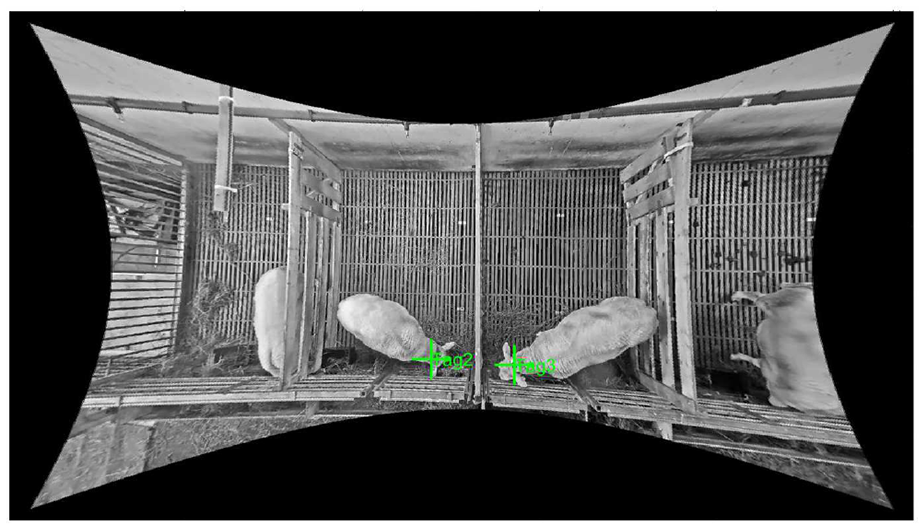
Example of interface developed to compute the control ground truth localization of UWB tags.
The localization error

Errors from each tag were brought into computing the localization mean error and standard deviation for number of the event N, where
Behaviour detection system
Two Intel RealSense Camera R200s were installed above two pens. Each camera was installed 1.8 m high above each section. The installation is shown in Figure 6. The Intel RealSense Camera R200s contained one infrared laser projection system, one full HD colour and two infrared imaging sensors. The system recorded top-view colour, depth and infrared video streams with the synchronized timestamp. The sheep standing and lying behaviours were scored by behaviour detection software module using instantaneous sampling in 1 min intervals.
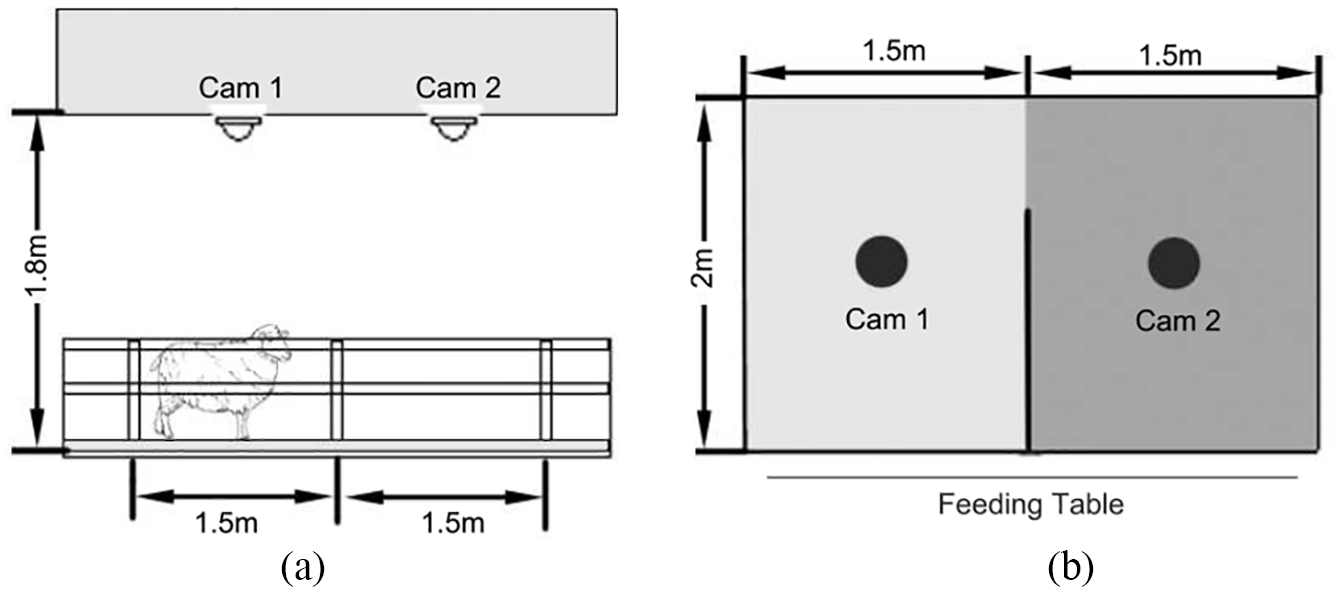
(a) side view and (b) top view of the experimental pen and position of the multi-camera system.
After sheep colour, depth and infrared video streams were collected, the software component performed non-supervised detection of sheep standing/lying behaviour. The software was developed in C++ and the programme can be performed in real-time. Figure 7 shows the behaviour detection system architecture. To achieve a robust automatic detection in the complex condition in the real production environment, the true shape of the sheep was extracted by detecting foreground/background based on colour separation in the HSV colour space and blob detection in IR streams. Standing and lying behaviours were detected by combining the depth information provided by the depth video and the true shape of the sheep. The standing sheep and lying sheep were extracted to two different images, using blob detection to get the number of lying sheep and standing sheep in each frame.

Overview of the behaviour detection system.
Sheep’s true shape detection
Behavioural images of the sheep had to be segmented from their background before depth feature analysis. Foreground/background detection is an essential task in video processing and understanding. In the real environment of the sheep barn, there is usually a complex background, for example, food inside pens, shadows and feeding activity. Traditionally, the foreground and background can be separated using Bayes’ decision theory from normal RGB video streams. 17 However, in this research, the detail of the sheep shape is important to the standing/lying detection result. Furthermore, the experiment was conducted in the northern part of Norway, which means the barn did not have sufficient illumination during most of the day for half the year. Instead of using visible light from RGB cameras, infrared images from IR cameras were more suitable for the low-light scenarios. Therefore, the true shape of the sheep was extracted by separating the foreground/background in IR streams.The sheep as foreground was separated from the background by manipulating the colour components of the IR images in the HSV colour spaces. After testing different light conditions, the values were fixed in the software. The sheep’s true shape was labelled using blob detection, where large groups of connected foreground pixels were considered as a blob. The blobs of the foreground were labelled in different colours and counted as the number of sheep that appeared in the image. Figure 8 shows the RGB image and IR image and the labelled result.
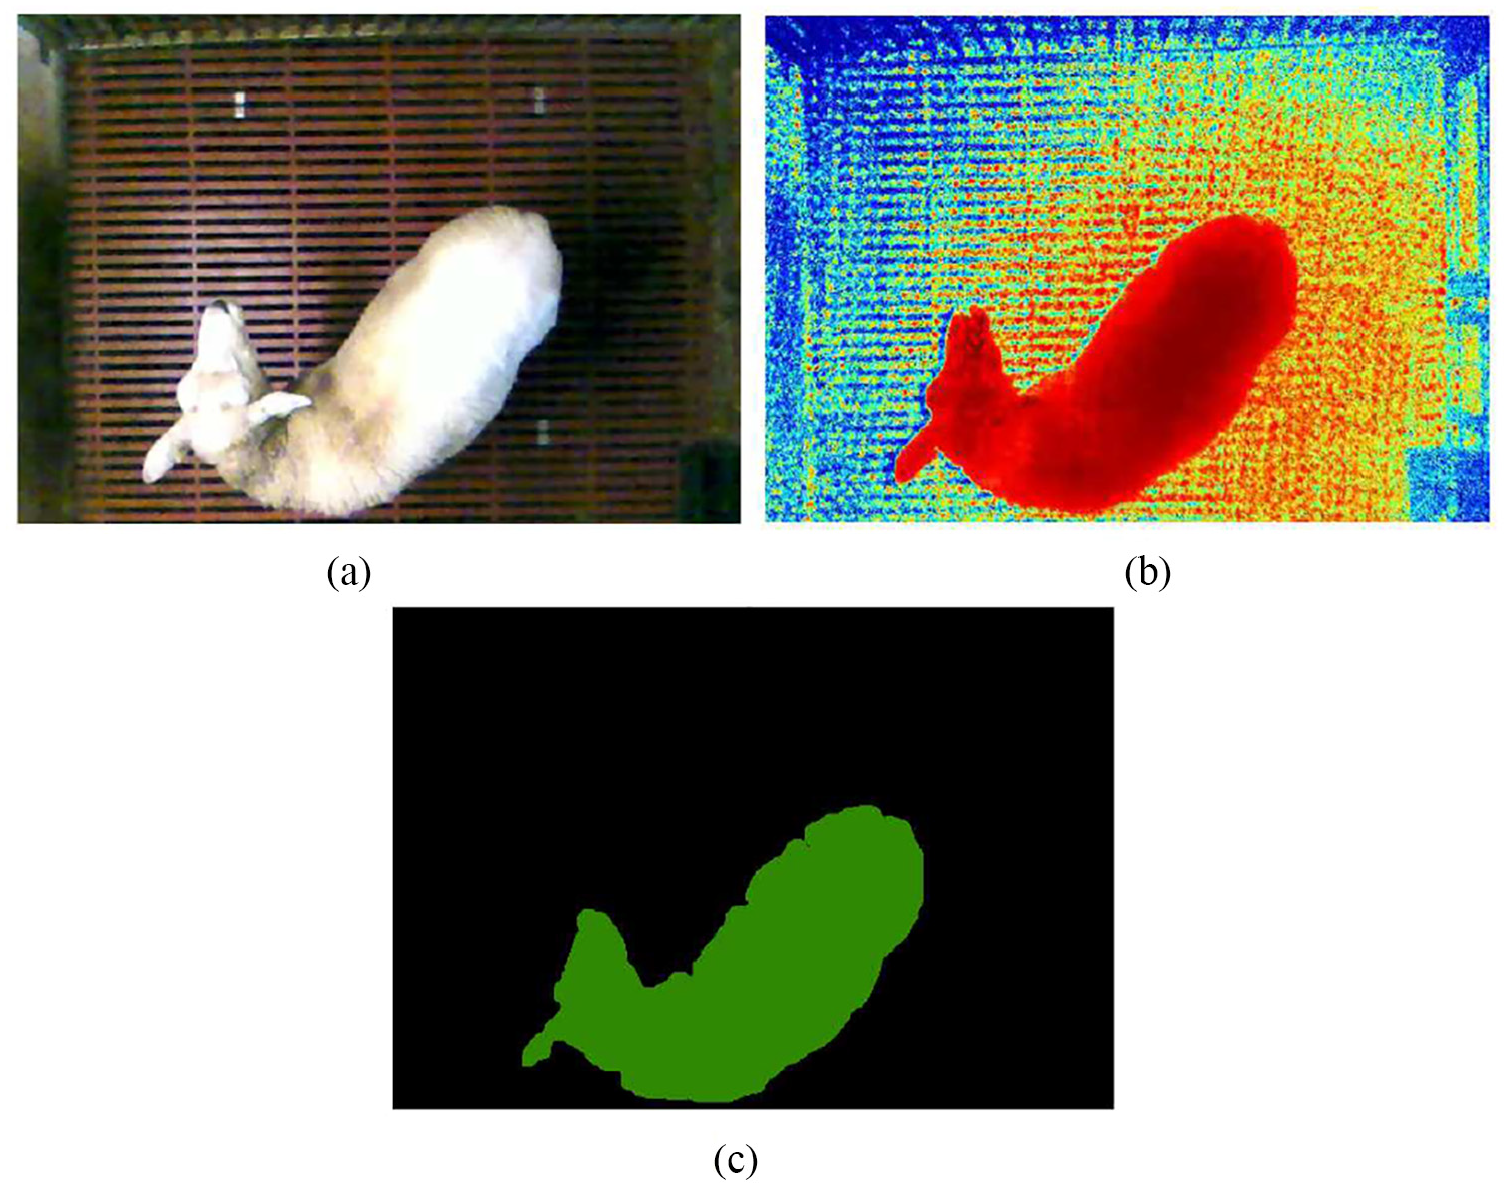
(a) RGB image, (b) infrared image and (c) labelled result.
Standing and lying detection
Intel RealSense Camera R200s used stereoscopic IR to produce depth. 18 Depth was computed by scanning the distortion of the IR pattern projected to the scene. RGB input was also added to the stereo depth calculations. The product claimed indoor range varies from 0.5 to 3.5 m, depending on the lighting condition. In our barn environment, the range was 0.5–2.2 m.
The sheep body height was scored from the depth image based on standing depth range and lying depth range. The depth range threshold values were fixed and added to the software after different tests. The standing and lying behaviours were displayed and saved in separate streams (Figure 9). By overlaying the standing sheep image to the labelled sheep’s true shape image, the standing sheep number was counted using blob detection.

(a) RGB image of sheep, (b) lying sheep in depth image and (c) standing sheep in depth image.
The behaviour detection system was evaluated by comparing the automatic detection result with control ground truth performed using visual inspection and manual registration of sheep behaviour from the video recordings. For the control, we recorded the number of sheep in the frame, the number of sheep standing and number of sheep lying, using the same instantaneous sampling method. We assumed these control data were error free, as it was double checked and small enough to keep an overview.
Results from the automatic detection system were labelled as true positive
Sensitivity


This provided the percentage of sheep behaviour detected correctly over the total number of those observed. It observed and evaluated the ability of the automatic detection.
Accuracy

This parameter expresses the proportion of correctly classified behaviours among all events detected.
Application based on the sensor-fusion-system
The system performed the identification and localization of the sheep using UWB technology. Then, IR cameras and 3D computer vision technology were deployed to detect sheep standing and lying behaviours. By combining the position tracking and basic behaviour data, a sensor-fusion-system was developed to automatically generate individual animal activity data. UWB position tracking and behaviour detection can be synchronized by a timestamp to generate the individual animal activity report. A web application based on the sensor-fusion data was prototyped to present the live localization of animals in the barn and individual animal activity report. An example of the live location page is shown in Figure 10. The 14 tags (including 4 reference tags) were shown in their current position in the barn in the live localization page. Different colour of the tags indicated the activity amount of the individual animals. Individual animal’s standing and lying behaviours can be shown in the time-line diagram of a 24-h period in the application.

Example of live location page.
Results and discussions
The experiment was conducted across a period of 2 weeks of June 2018. In order to give a fair overview of different light conditions and activities during the day, two continuous days (48 h), two sheep (Tag 2 and Tag 3) in Pen 2 and Pen 3, were selected.
Real-time location system
In the chosen continuous time period, 1091 tag positions were evaluated by comparing each tag position with the control ground truth position. Table 2 shows the result of the tag error distance with the number of events, the minimum value, the maximum value and the mean error ± standard deviation of the tags. The mean error ± standard deviation of the tag on the sheep collar was
Result of the real-time location system.

From the testing, we did find a few error measurements highly different from the central data distribution values. Therefore, we observed the box plot (Figure 11) representation of the error computed on each tag. On each box, the central mark indicated the median, and the bottom and top edges of the box indicated the 25th and 75th percentiles, respectively. The outlier data were marked with the symbol ‘+’. In this figure, the localization errors at the 25th percentiles for Tag 2 and Tag 3 were 0.187 and 0.153 m, respectively, and at 75th percentiles were 0.51 and 0.599 m. The number of finite outliers were 15 and 8. The mean error measurement after filtering the outlier data became 0.357 ± 0.254 m.

Box plot of the errors for each tag.
Under the operative conditions in this research trial, the accuracy of the UWB system can be improved because the axis camera and UWB system had restrictions to achieve perfect time synchronization. With regard to the localization error of tags on animals in the production environment, Sanpechuda and Kovavisaruch 19 reviewed that RFID localization obtained mean errors ranging between 0.016 and 1.5 m. Wireless local area network technology for cow positioning was performed with 1 m as the mean error 20 and Bluetooth wireless technology obtained 0.6 m. 21 Using an UWB system, our results proved that the system’s mean error was smaller than the trial conducted by Pastell et al. 22 with accurate results that reached at 50 cm. Porto et al. 15 evaluated the Ubisense system’s performance which stated a 0.515-m error for the tags applied to the cows. Thus, our real-time location system could be used to study some specific aspects of sheep behaviour.
Behaviour detection system
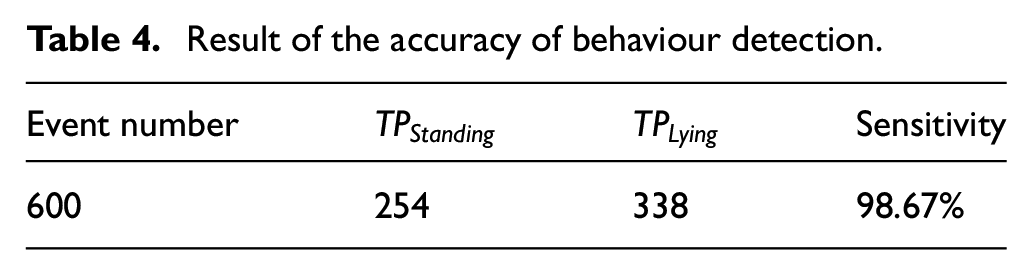
The standing and lying behaviours were scored by the detection system using instantaneous sampling. The sheep behaviour detection was performed on 600 sets of images. The sensitivity of the system achieved for detecting sheep standing and lying positions was 96.95% and 100%, respectively (Table 3). The accuracy of the system was 98.67% (Table 4). During testing, we found the main reason for FN was due to the feeding box being overfilled with food that blocked the sheep’s appearance or sheep performing the itching pose.
Result of the sensitivity of behaviour detection.

Result of the accuracy of behaviour detection.
The behaviour detection results could be compared to an earlier study in a commercial system that measured dairy cow activity. Tullo et al. 23 evaluated the commercially available GEA CowView System (GEA Farm Technologies, Bönen, Germany) to detect cow behaviour based on position. The sensitivity of standing and walking was 63% and 78%, respectively. The sensitivity of the system, proposed by Porto et al.,8,9 for the standing and lying behaviours was 86% and 92%, respectively. In these studies, RGB cameras captured the cow behaviour combining the cow’s present position, where resting area referred to lying and feeding alley referred to standing. However, all three studies were conducted in dairy cow barns, which is different from the sheep housing environment. By comparing the sensitivity of the standing and lying behaviours, our system showed a significant advantage to perform 3D scanning for scene perception.
Furthermore, in the real barn environment test, the IR cameras were deployed as background and foreground segmentations. In many computer vision systems deployed for animal behaviour research, the foreground has been assigned manually using seven landmark points 24 which is a time-consuming operation. With the help of the infrared sensors, we can achieve a real-time system.
Sensor-fusion-system for tracking sheep behaviour and localization
The aim of this study was to develop a sensor-fusion-system that automatically generated individual animal activity data. By combining the UWB technology, IR camera and 3D computer vision technology, the identity, location and behaviour of the individual’s data were synchronized to generate the individual animal activity report. Our trial proved that the accuracy of UWB location system is high enough to connect behaviour data from the 3D camera system to the individual animal. In the meantime, the sensitivity and the accuracy results in this study showed that the system was able to analyse the sheep behaviour, which in next turn might help with monitoring welfare of livestock in their housing environment. Registering the resting time can help to study the social stress in animal husbandry, 2 for example, it has been shown that reduction of the lying area from 1 to 0.5 m2/ewe reduced the total lying time and resulted in less synchronized lying behaviour. 25 Furthermore, high frequency of laying down and standing up behaviour might indicate the onset of lambing. The system may even prove to be useful in ethology research by reducing the workload regarding the analysis of large video- and picture-frame raw datasets and increasing the accuracy of animal behaviour monitoring.
The proposed system is currently in the development and testing stage. The battery life of the UWB nodes will be a limitation for commercial applications. The sensors on the collar of the sheep during the test has run over 2 months. Battery life will depend on various settings, for example, update and interval rate, and there will be a trade off between ranges, update interval and battery life. Another limitation is that the Intel RealSense Camera R200 indoor ranges vary from 0.5 to 3.5 m. Under the natural light and the light system provided in the barn, the range was 0.5–2.2 m. Therefore, the cameras were installed 1.8 m high above the floor. This limited the coverage of the area. Our assumptions suggest that the existing setup will benefit from an industrial-grade depth camera. With such a depth camera, maximum viewing range will reach over 7 m, thus the camera can be installed in the barn’s roof to cover a bigger group. Especially for sheep living in environments as previously described, it may be very helpful to detect individuals in larger groups, to track their movements over time. The animal caretakers could be notified if an animal has not been detected at the feed table for a while, if an animal has been lying resting for a longer period of time or be alerted at the onset of a birth.
Conclusion
In this article, a sensor-fusion-system for automatically tracking sheep localization and behaviour was developed. A controlled trial was conducted using this system on 10 sheep across a 2-week study. The mean error ± standard deviation of sheep position performed by the UWB location system was 0.357 ± 0.254 m, and the sensitivity of the sheep standing and lying detection performed by IR cameras and 3D computer vision technology were 98.16% and 100%, respectively. The proposed system was able to track individual animal’s location and detect sheep standing and resting behaviours in the production environment. The system may help to achieve a real-time automated tool for continuous monitoring of individual sheep in the barn environment.
Footnotes
Handling Editor: Luca Reggiani
Declaration of conflicting interests
The author(s) declared no potential conflicts of interest with respect to the research, authorship, and/or publication of this article.
Funding
The author(s) received no financial support for the research, authorship, and/or publication of this article.