
Abstract
Technology evolves quickly. Low-cost and ready-to-connect devices are designed to provide new services and applications. Smart grids or smart health care systems are some examples of these applications. In this totally connected scenario, some security issues arise due to the large number of devices and communications. In this way, new solutions for monitoring and detecting security events are needed to address new challenges brought about by this scenario, among others, the real-time requirement allowing quick security event detection and, consequently, quick response to attacks. In this sense, Intrusion Detection Systems are widely used though their evaluation often relies on the use of predefined network datasets that limit their application in real environments. In this work, a real-time and ready-to-use tool for monitoring and detecting security events is introduced. The Multivariate Statistical Network Monitoring–Sensor is based on the Multivariate Statistical Network Monitoring methodology and provides an alternative way for evaluating Multivariate Statistical Network Monitoring–based Intrusion Detection System solutions. Experimental results based on the detection of well-known attacks in hierarchical network systems prove the suitability of this tool for complex scenarios, such as those found in smart cities or Internet of Things ecosystems.
Keywords
Introduction
Several technical reports forecast 30 billion IoT (Internet of Things) devices around the world by 2021 and more than 14 billion M2M (Machine to Machine) connections by 2023.1,2 This scenario enables new services and applications for improving people’s daily life as well as new business opportunities. However, many challenges arise too, with security being one of the most important.
Underlying systems and communications networks are continually being threatened by attackers, especially in these hiper-connected environments. For instance, it is worth mentioning two recent attacks, Dyn3,4 and VPNFilter, 5 where thousands of IoT devices were compromised causing, on one hand, a high economic impact and, on the other hand, and even worse, personal costs.
Monitoring and controlling what is happening in these kinds of scenarios is a great challenge since the attack exposure surface grows with the number of devices interconnected. A more challenging issue is to manage the generated data gathered from different information sources (ISs) such as applications, networking devices, and communications. In this way, key aspects such as managing the volume, veracity, or velocity of the data are crucial for achieving quick and efficient detection and reaction against security attacks. 6 Furthermore, these aspects may limit the practical application of the solutions, especially in the described scenario.
In this sense, IDS (Intrusion Detection System) tools are widely used by the specialized community on ICT (Information and Communication Technologies) security. IDS systems are commonly categorized as one of two types: (1) Network-based IDSs (NIDSs) and (2) Host-based IDSs (HIDSs). NIDSs monitor network events such as traffic flows or firewall logs, while HIDSs behave similarly but consider host (endpoint)-related events, for example, syslog, CPU load, and so on.
To evaluate the performance of IDSs, predefined datasets are widely used. Consequently, choosing one or another is a very relevant decision with a relevant impact, not only on the detection performance but also on the confidence on the conclusions the authors claim. In this way, Maciá-Fernández et al. 7 built a recent and real network dataset that copes with the main drawbacks found in the most commonly used network datasets.
Nevertheless, most of the IDS solutions tested through network datasets are not valid for its use in real application scenarios, because there are differences between the environment where they were built and the one where the IDS solution will be deployed. Apart from that, some other functional requirements must be accomplished by the IDS solutions to be afterward deployed in real network environment. They are, among others, to be efficient in managing heterogeneous and large amount of data, real-time requirements, and adaptability. In this manner, ready-to-use solutions for real-time monitoring and anomaly detection are recommended. These types of approaches could eliminate the need to use previously gathered datasets, which are, on the contrary, very difficult to build and time-consuming.
In this work, the Multivariate Statistical Network Monitoring (MSNM)–Sensor tool is introduced to address the previous issues. MSNM-Sensor is an efficient tool for real-time network monitoring and anomaly detection based on the MSNM approach coined by Camacho et al. 8 The MSNM-Sensor is ready-to-use and validates the real application of MSNM-based IDS solutions: the MSNM ecosystem.8–13 Among others characteristics, the MSNM-Sensor is able to manage heterogeneous data sources in real-time; reduces the monitoring network traffic without significant impact on the detection performance; is lightweight, scalable, versatile, and dynamically adaptable to changes in the network environments; keeps privacy on communications; provides a friendly interactive dashboard; and is an open source project.
In order to demonstrate its suitability to be used in complex network environments for real-time monitoring and anomaly detection, the MSNM-Sensor has been successfully tested in hierarchical networks and systems for detecting well-known attacks like DoS, port scanning, and data exfiltration. After that, these results are compared versus those obtained in the work Maciá-Fernández et al. 10 where the authors test the detection capability of the MSNM approach in the same scenario but in offline mode. The obtained results validate the suitability of the tool to be deployed in real network scenarios with real-time monitoring and detection requirements.
The article has been organized as follows. The section “Fundamentals of MSNM” describes the fundamentals of the MSNM methodology, which supports the core functionality of the sensor. In section “MSNM-Sensor,” the components and operation modes of the MSNM-Sensor are described. The tool is validated in realistic network architectures through the deployment of several MSNM-Sensors for real-time monitoring and anomaly detection in the section “Application of MSNM-Sensor for monitoring and attack detection in complex network environments.” Attacks such as DoS, data exfiltration, or port scanning are successfully detected in the proposed network scenario. Moreover, the tool is also compared with a state-of-the-art solution. Finally, conclusions and further work are described in section “Conclusions and future work.”
Fundamentals of MSNM
In this section, we briefly introduce MSNM, which is the basis of the MSNM-Sensor tool. MSNM relies on Principal Components Analysis (PCA), a main tool for multivariate analysis. PCA has been established as a promising technology to perform network anomaly detection.14–17 The unsupervised nature of PCA allows to unveil anomalous behavior from unknown attacks, which is a desired characteristic in those solutions working in real environments. Apart from its unsupervised nature, PCA is a white-box model. In comparison to the bulk of machine learning solutions, PCA models are explainable since trends or relationships in the features and observations of the data can be easily connected.
MSNM has been demonstrated to be a promising methodology in network anomaly detection through several works8–13 offering a high detection performance. Four stages comprise the MSNM methodology. They are (1) parsing, (2) fusion, (3) detection, and (4) diagnosis. All of them are introduced in the following and integrated in the MSNM-Sensor tool as can be seen in next section.
Parsing
Information from communication networks usually comes in the shape of huge logs and traffic-based files containing heterogeneous information. This makes it impossible to directly use this information as input of detection systems and learning models to identify different kinds of attacks. However, to overcome this issue, data sources are processed in order to build a more suitable input for automatic detectors or classifiers.
In this sense, the application of some feature engineering technique is proposed to build a well-structured input, suitable for monitoring and detection systems in general. Thus, the Feature as a Counter (FaaC) 6 technique is used as a functional solution to the problem of learning from large heterogeneous datasets. It consists in transforming different data sources of information (structured or not) events in the new variables. The new ones are just counters of the original ones computed in a given interval of time. For instance, it could be interesting to count the number of accesses to port 22 in a given time window interval, because a high number might mean a brute force secure shell (SSH) attack. The practical implementation tool for the FaaC approach, named FCParser, is available online for downloading at Pérez-Villegas et al. 18
Fusion
In communication networks and systems, it is expected to find more than one information data source to be monitored. Apart from the parsing functionality of FaaC, the FCParser tool is also able to fuse different data sources in a single set of features. For each different source of data, a set of features (counters) is defined. All the sources under monitoring are appended into a simple data stream to build the calibration matrix for the PCA model. For that, each source is sampled with equal sampling rate, then parsed, and finally fused into a unique data stream. This procedure is periodically repeated at each sample time.
The combination of the parsing and the fusion procedures is specially suited for the subsequent multivariate analysis, resulting in high-dimensional feature vectors that need to be analyzed with dimension reduction techniques, like PCA. Moreover, the diagnosis procedure benefits from the definition of a large number of features for a better description of the anomaly taking place. Finally, counters and their correlation are easy to interpret.
Detection
PCA is the core of MSNM. PCA identifies a number of linear combinations of the original variables in a data set
PCA is described through the following equation

where

where

corresponds to the residuals.
In order to detect anomalies in the monitored system,


where
With both statistics (4) and (5) computed from the calibration data
Diagnosis
After detecting something anomalous in the system, it is necessary to investigate its root causes. Most often, the diagnosis procedure is manually carried out by a security analyst alerted by the system.
The diagnosis procedure could be a tricky and tedious task, due to the large amount of information to analyze. Feature contributions to a given anomaly can be a useful tool to identify where the anomalous behavior comes from. Contribution plots or other diagnosis methods like oMEDA (observation-based Missing-data method for Exploratory Data Analysis)
22
or Univariate Squared (US)
23
can be used to identify the feature contributions. Thus, anomalies are detected in the
MSNM-Sensor
In the following section, MSNM-Sensor modules and operations are introduced and thoroughly explained. Before that, an illustrative example of use in a hypothetical network scenario is introduced for a better understanding of how the tool works.
Example of use: an hierarchical approach
The MSNM-Sensor itself is able to monitor and detect anomalous behaviors from a wide range of heterogeneous data sources. However, the really novel idea behind the use of Q-st and D-st statistics is their capability of maintaining the monitoring and anomaly detection performance when they are included in the hierarchy of complex network environments. This useful characteristic has been demonstrated by Maciá-Fernández et al. 10
Although the tool will be tested in the section “Application of MSNM-Sensor for monitoring and attack detection in complex network environments,” in a realistic network scenario, an example of several MSNM-Sensors cooperating within a hypothetical and common network deployment is described as follows. Figure 1 shows a simple network scenario where several MSNM-Sensors (orange boxes) are deployed at hosts and network devices. We can discern in the figure two involved information flows: the monitoring and diagnosis flows. The former (black dashed lines) transports pairs of monitoring statistics (
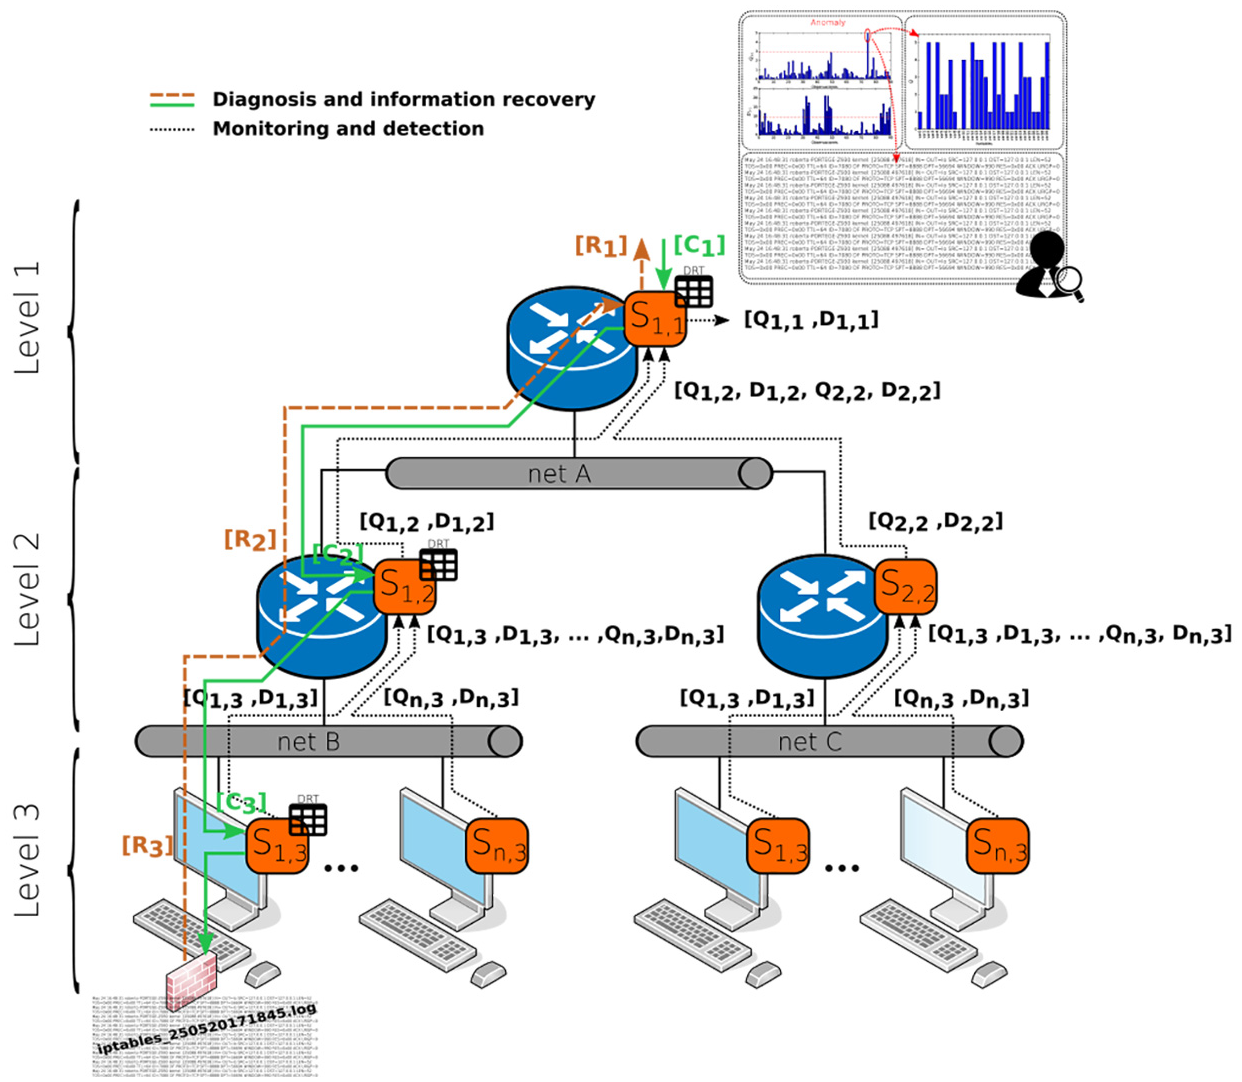
A hypothetical deployment of several MSNM-Sensors (orange boxes) throughout an interconnected system for hierarchical monitoring, anomaly detection (dashed black lines), and diagnosis (solid green and dashed brown lines).
Once the anomaly is detected, a deeper inspection should be done to determine, for example, where the anomaly comes from and its root causes. This is the diagnosis procedure, which is represented in Figure 1 with solid green and dashed brown lines. In this example, the anomaly comes from
MSNM-Sensor modules
The MSNM-Sensor functional modules, depicted in Figure 2, are described as follows:

Functional modules of a generic sensor
IS
The IS module handles the data coming from the ISs. Two types of data sources, according to their location, are considered:
Local (LIS). The information gathered from these data sources is generated by the device where the MSNM-Sensor is deployed. For instance, local ISs can be obtained from firewall log files, NetFlow traffic flows, and host-based information (e.g. syslog in Linux-based systems), among others. LIS data are processed by the parsing and fusion modules.
Remote (RIS). The incoming data from other MSNM-Sensors are handled as a remote IS. Most of the data from other MSNM-Sensors will be the computed values of the monitoring statistics
Parsing and fusion
As mentioned in section “Fundamentals of MSNM,”parsing and fusion modules do, on one hand, a transformation of LIS data sources (structures or not) into a new structured form where new features are counters of the original. On the other hand, in case of considering several LIS data sources, all of them are fused by appending one after another. As a result, we have a homogeneous data stream of quantitative values to be subsequently used in the detection module for anomaly detection. Both processes are carried out by the FCParser 18 which implements the FaaC approach.
Detection
This module represents the sensor functional core for anomaly detection. It provides multivariate statistical-based methods and algorithms to compute the monitoring statistics
The detection module supports three different functions:
Because of the dynamic nature of information coming from networks and systems, learning models should periodically be re-calibrated or re-trained in order to adapt them to normal changes in the environment and avoid high false positive (FP) rates. Usually, such changes are due to the normal cyclo-stationary nature of the information from network communications and systems, 7 which make variables vary depending on the hour, day, week, and so on. These behavioral patterns are periodically repeated. The Exponentially Weighted Moving Average (EWMA) approach is used to dynamically calibrate the sensors every 60 min. 26 Each sample rate, new UCL limits are also computed.
Diagnosis
The diagnosis procedure takes place when an anomaly is detected on the monitored system. It is necessary to find out where the anomalous event came from and its root causes, to afterward deploy the adequate response measures to counteract the attack. How to manage this problem is the duty of the diagnosis module.
The diagnosis module relies on the use of statistical multivariate techniques to determine the source of the anomaly. Currently, the oMEDA 22 method is implemented, but other methods can be included, for instance, contribution plots or diagnosis methods like the one proposed in Fuentes-García et al. 23
Although the diagnosis module solves the anomaly diagnostic by itself, it is done locally, that is, in the device where the sensor was deployed. In addition, defining the device and data source(s) involved in an anomalous behavior in the whole system under monitoring is not a trivial task. For this reason, we create the DRT, which acts similarly to the well-known routing IP tables but adds together the information of local and remote sources. The diagnosis flow, diagnosis routing procedure, and the role of
COMmunications
The COMmunications (COM) module allows each MSNM-Sensor to exchange information. It handles the exchange of specific messages. The system supports (but is not limited to) two types of messages: data and command. The messages mainly differ in the payload and type. For instance, a data message can include any information required in sensor operations, for example, the monitoring statistics. On the contrary, command messages are devised to control these processes.
Depicted in Figure 2, two information flows are differentiated: monitoring and diagnosis. It is worth mentioning that only the first one (monitoring) is currently implemented, while the second one is an ongoing work (see the project in Magán-Carrión et al.
27
). However, we decided to mention and describe both of them because they are complementary. In this way, monitoring information flow exchanges data messages containing the computed statistics
In this early stage, there is no specific routing algorithm between sensors. Instead, each sensor must be manually configured to send and receive data to and from others. A self-deployed sensor process will be added in future releases.
Manager
As depicted in Figure 2, all modules work together following an execution pipeline and sharing the necessary information. The module in charge of orchestrating and managing the others is the manager.
As mentioned above, there are two different information flows: monitoring and diagnosis. The first one (monitoring) involves four main modules (IS, parsing, fusion, and detection) that should be invoked sequentially, because the output of each module is the input of the next one. However, the second flow (diagnosis) involves the diagnosis module, which is invoked if a specific message is received. Finally, manager handles the orchestration of which MSNM-Sensor module should run and when.
MSNM-Sensor operations
Thus far, the main functional MSNM-Sensor modules have been described. However, high-level operations, including several modules, are devised in accordance with the principal MSNM-Sensor functionalities: monitoring and diagnosis. The diagnosis process is still an ongoing work; however, we decide to briefly describe it for completeness. Both operations are managed through the MSNM-Sensor dashboard which is described at the end of this subsection.
Monitoring operation
To be aware of what is happening in systems or networks, it is important to detect anomalous behaviors. However, this is not a trivial task, since a previous work must be done to select which element and information should be supervised. In this manner, the monitoring flow and the involved modules offer a versatile and scalable tool allowing the user to freely select data sources and variables to be monitored.
Figure 3 shows a detailed view of module interactions and the exchanged information. In the figure, we show a hypothetical local data source

Involved modules and the information exchanged among them for a
For each
Although just one data source has been considered so far, additional local (LIS) or remote (RIS) data sources can also be included if needed. Figure 3 shows the procedure to add new data sources. In this case (but not limited to it), there are three data sources involved: two local (
Diagnosis operation
As aforementioned, after detecting an anomaly in the system, the diagnosis procedure should be launched to determine its origin. Figure 4 depicts the operation steps launched to determine which IS is involved in the anomaly. For instance, we suppose that a security event arose from the

Diagnosis operation steps to determine the origin of an anomaly in the system. In this case, the anomaly comes from a variable
Once the corresponding observation to be inspected has been retrieved from the sensor, the oMEDA algorithm is launched. This algorithm outputs the contribution of each variable, where the higher the contribution, either positive or negative, the more relevant the variable was in the anomaly. In this case, the variable with a high positive value is
Together, the timestamp and the diagnosis under investigation allow the sensor to extract the corresponding piece of raw information to be afterward analyzed by the security analyst Camacho et al. 13
Management and control
The MSNM-Sensor application comes with an interactive dashboard. Thanks to this dashboard, the security analyst or the application operator can, in real-time, access the monitoring and diagnosis information and manage the sensor deployment. A snapshot of the monitoring main section of the dashboard is shown in Figure 5. The upper part shows the logical connections created among the sensors. The operator can see the direction of the monitoring flow as indicated by arrows. In this specific scenario, it is clearly shown how the sensors in routers R1, R2, and R3 are configured to send their monitoring information to the Border Router (BR) router. In addition, the monitoring graphs will appear in the bottom part by clicking on a specific sensor. Among other actions, the operator can interact with these graphs to pause/play the updating procedure for a better inspection. The dashboard is needed for whatever monitoring system that allows the operator to reduce the response/reaction time when an attack takes place.

Snapshot of the monitoring view of the MSNM-Sensor dashboard. The logical connections of the sensors (orange boxes) are shown in the upper section of the figure, while the monitoring graphs are in the bottom part.
Application of MSNM-Sensor for monitoring and attack detection in complex network environments
Experimental environment
To validate the monitoring and anomaly detection performance of the MSNM-Sensor in complex systems, we deployed several sensors over a controlled scenario with virtual machines running in a cluster. This scenario has been previously devised in work of Maciá-Fernández et al. 10 to theoretically prove the hypothesis of the application of MSNM for hierarchical systems. A performance comparison between the previous work and the MSNM-Sensor’s deployment throughout the same network scenario, is provided in subsection “Comparative study.”
The complete scenario with the different machines is depicted in Figure 6. This environment simulates a typical network architecture of a corporation so we can observe several subnetworks, network devices, and end devices. A demilitarized zone (DMZ) is located in the inner network, separated from the outside world (Internet) with a BR and departmental networks in turn delimited by the corresponding routers (R1, R2, and R3).

Experimental scenario. Four MSNM-Sensors
In this scenario, we generated two types of network traffic: normal and malicious. Normal traffic comprises all HTTP communications from all departmental hosts requesting HTTP resources allocated at the several web servers placed in the Internet and DMZ. As shown in Figure 6, the incoming traffic from and outgoing traffic to the Internet goes through the BR. On the contrary, Rx routers, with
However, the malicious traffic is generated from different locations in the predefined architecture, simulating very well-known and state-of-the-art attacks. These are (1) DoS (high and low rate); (2) port scanning, a relevant step in the recognition phase in a penetration testing procedure; and (3) data exfiltration for privacy violation purposes.
We run our scenario during a period of 25 h. In the first 23.5 h, only normal traffic is generated. During the last hour and a half, the attacks previously described are generated sequentially in 5-min intervals: high-rate DoS, low-rate DoS, scanning attack, and data exfiltration.
The different routers in the network (R1, R2, R3, and BR) are equipped with NetFlow inspectors that generate NetFlow v5 information. These data are afterward consumed in real time by the corresponding MSNM-Sensors, allocated in the mentioned network devices. These sensors are named
Experimental results
As we stated in previous sections, a key characteristic of the MSNM-Sensor is its applicability for real-time monitoring and detection in complex network environments with a variety of devices and communications (to reproduce the obtained results, related data and scripts are available at the official GitHub repository).
There are several ways to evaluate the performance of the MSNM-Sensor as a detection system. In this work, the so-called monitoring plots 21 and the widely used AUC (Area Under the Curve) and ROC (Receiver Operating Characteristic)24,28 are used. The first ones allow the security analyst to be alerted when anomalies are taking place in the system, that is, when the monitored statistics exceed the predefined control limits. In regard to the second ones, the AUC is a quantitative measurement of the area under the ROC curve. The ROC curve compares the evolution of the TP (True Positive) rate versus the FP rate for different values of the classifying threshold. The AUC is a performance indicator such that classifiers with AUC = 1 behave perfectly, that is, it is able to correctly classify all the observations, while a random classifier would get an AUC value around 0.5.
Anomaly detection
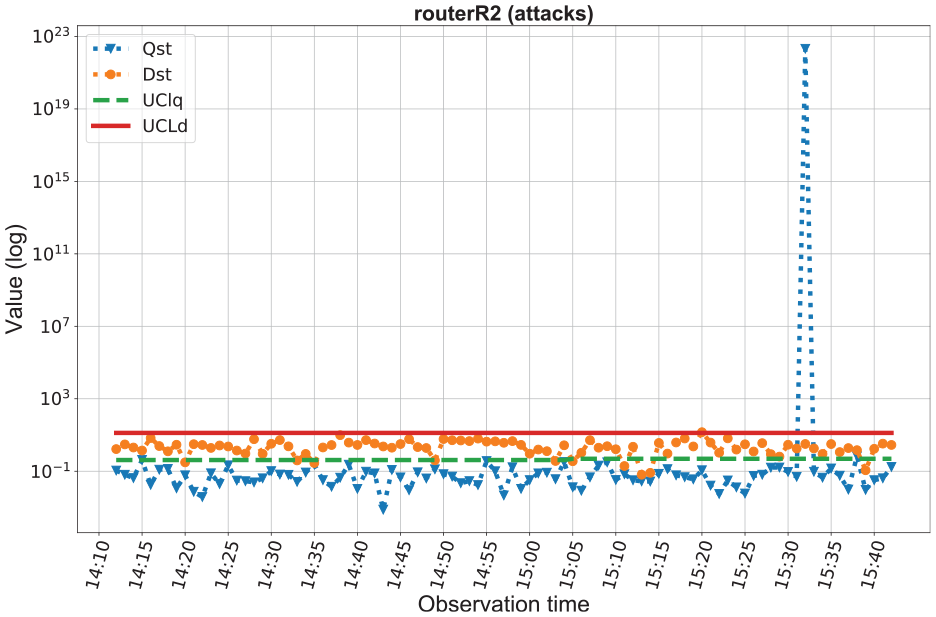
Figure 7 shows the

It is worth paying special attention to the attack period. In this way, Figure 7(b) clearly shows deviations in the statistics values when the attacks take place. First deviation corresponds to the high-rate DoS attack being the low-rate DoS attack in second place. Five minutes after the port scanning attack is taking place and the data exfiltration attack is the last one. In addition, the MSNM-Sensor deployment allows us to distinguish where the anomaly is coming from by inspecting similar monitoring plots from each of the inner routers R1 to R3. For instance, the port scanning attack is originated somewhere in the R1 network as it can be seen in Figure 8. Similarly, Figures 9 and 10 show that the data exfiltration and DoS-related attacks have been originated in R2 and R3 networks, respectively.


Detection performance
Figure 11 shows the ROC curves and AUC values obtained at BR. In this figure, on one hand, we consider the detection performance of all involved attacks (the black continuous line in the figure). On the other hand, we can see the corresponding detection performance per attack. In this case, only the attack’s positive samples are considered, leaving the rest out. As expected, data exfiltration (or data leakage) is one of the most difficult attack to detect mainly due to its nature: it periodically sends little and randomly chosen portions of files to the attacker. On the contrary, the port scanning attack was almost completely detected. This is motivated by the high rate among scan attack occurrences. Finally, high-rate DoS attacks are easy to detect since their network traffic pattern highly differs from the normal network traffic in comparison to low-rate DoS attacks.

ROC curve and AUC values at BR for all involved attacks (black continuous line) and per attack.
Comparative study
Aiming to validate the real-time monitoring and detection capabilities of the MSNM-Sensor, we compare the previous results with the ones provided by Maciá-Fernández et al., 10 hereafter, the WIFS’16 results. This work confirms the hypothesis of that MSNM approach is able to monitoring hierarchical communication networks by aggregating statistics at the different network segments or levels. The authors use the gathered network traffic once the experiment has been finished to prove the MSNM hierarchical approach. Instead, the MSNM-Sensor deployment monitors and detects anomalies in real-time.
Figures 12 and 13 show the contribution plots and ROC curves, respectively, from the above mentioned work. In comparison to those obtained by the MSNM-Sensor deployment experiment (see Figures 7(b) and 11), we can visually observe a similar pattern in regard to the


ROC curve and AUC values in WIFS’16 experiment at BR router for all involved attacks (black continuous line) and per attack.
In general terms, the MSNM-Sensor deployment performs similar to the compared work. It proves its usefulness and suitability to be used in real network environments for real-time monitoring and anomaly detection.
Conclusions and future work
This work introduces the MSNM-Sensor, a ready-to-use tool for real-time monitoring and detection of security events in complex systems and network environments. The MSNM-Sensor offers an alternative way for testing MSNM-based IDS solutions in comparison to conventional approaches based on the use of predefined network datasets. Last approaches could limit the application of IDS solutions in real network environments.
Inherited from the MSNM methodology, MSNM-Sensor reduces and efficiently handles the monitoring information, maintaining its detection performance. On the contrary, existing IDS or security information and event management (SIEM) solutions consider raw data, thus adding extra monitoring traffic overhead. Moreover, MSNM-Sensor inherently adds privacy in monitoring communications since no sensible or raw data are sent to the central station just the statistics instead.
The solution relies on the use of lightweight algebraic and statistics operations that allow it to be embedded in less powerful devices, for example, wearable devices, environmental sensors, and IoT devices in general.
The MSNM-Sensor detection performance has been successfully tested for MSNM-based IDSs in hierarchical networks though some other IDS approaches can be also evaluated. The MSNM-Sensor should be tested in real scenarios, for example, IoT ecosystems or those found in smart cities in order to test its scalability and detection performance. Finally, the anomaly diagnosis operation is still in development; thus, we will focus our future work on it too.
Supplemental Material
MSNM-S_DSN-19-0653.R2 – Supplemental material for Multivariate Statistical Network Monitoring–Sensor: An effective tool for real-time monitoring and anomaly detection in complex networks and systems
Supplemental material, MSNM-S_DSN-19-0653.R2 for Multivariate Statistical Network Monitoring–Sensor: An effective tool for real-time monitoring and anomaly detection in complex networks and systems by Roberto Magán-Carrión, José Camacho, Gabriel Maciá-Fernández and Ángel Ruíz-Zafra in International Journal of Distributed Sensor Networks
Footnotes
Handling Editor: Deze Zeng
Supplemental material
The current version of the MSNM-S is released under a GPL license, and we encourage readers to be an active part of the project, which is available at Magán-Carrión et al. 27
Declaration of conflicting interests
The author(s) declared no potential conflicts of interest with respect to the research, authorship, and/or publication of this article.
Funding
The author(s) disclosed receipt of the following financial support for the research, authorship, and/or publication of this article: This work has been partially supported by Spanish MINECO (Ministerio de Economía y Competitividad) through projects TIN2014-60346-R, TIN2017-83494-R, and FEDER funds.
References
Supplementary Material
Please find the following supplemental material available below.
For Open Access articles published under a Creative Commons License, all supplemental material carries the same license as the article it is associated with.
For non-Open Access articles published, all supplemental material carries a non-exclusive license, and permission requests for re-use of supplemental material or any part of supplemental material shall be sent directly to the copyright owner as specified in the copyright notice associated with the article.