
Abstract
With the widespread propagation of Internet of Things through wireless sensor networks, massive amounts of sensor data are being generated at an unprecedented rate, resulting in very large quantities of explicit or implicit information. When analyzing such sensor data, it is of particular importance to detect accurately and efficiently not only individual anomalous behaviors but also anomalous events (i.e. patterns of behaviors). However, most previous work has focused only on detecting anomalies while generally ignoring the correlations between them. Even in approaches that take into account correlations between anomalies, most disregard the fact that the anomaly status of sensor data changes over time. In this article, we propose an unsupervised contextual anomaly detection method in Internet of Things through wireless sensor networks. This method accounts for both a dynamic anomaly status and correlations between anomalies based contextually on their spatial and temporal neighbors. We then demonstrate the effectiveness of the proposed method in an anomaly detection model. The experimental results show that this method can accurately and efficiently detect not only individual anomalies but also anomalous events.
Introduction
As a widely used technology in information security, anomaly detection is generally used to detect the anomalous behaviors or anomalous data that violate statistical rules. Other than misuse detection, which is considered as a rule-based method, anomaly detection refers to detect not only the behaviors that are different from the current stored normal patterns but also the unknown anomalous behaviors which are newly emerging. 1 With the advent of Internet of Things (IOT) era, people can conveniently obtain a large amount of various data by millions of sensors according to their requirements, especially in the case of IOT through wireless sensor networks (WSNs) with good mobility and flexibility. 2 Currently, more than 200 on-orbit satellites are capturing remote sensor (RS) data from earth observations, which are further used to forecast anomalies, such as climate extremes or geological extremes. And almost all automobile production lines detect anomalous auto parts according to the sensed data sent by the sensors.
However, most traditional anomaly detection methods rely on the patterns, both normal and anomalous, greatly. A behavior might be considered anomalous only if the detected behavior matches an existing known anomalous pattern. Nevertheless, a newly emerging anomalous behavior, which does not match any existing anomalous pattern, might be incorrectly detected as normal. 3 In view of this, some anomaly detection methods based on machine learning are proposed, which can learn from newly emerging behaviors and update the existing anomalous patterns. However, the changes and correlations of the data from the same sensor are always ignored, so does the changes and correlations of the data from different sensors. 4 In the IOT through WSN, due to the dynamic and self-organizing characteristics of WSNs, the difficulty of anomaly detection in such scenario is further increased, thus it is particularly necessary to take the changes of sensed data into account.
In IOT through WSNs, all the deployed sensors constantly send data back to central aggregators or management nodes, as the quantity of data increases, so does the complexity of data analysis and processing. 5 In addition, as the data from the sensors change all the time, it is hard to detect anomalous events (temporal or spatial) accurately just on the basis of stored normal patterns. Considering a possible scenario, as follows: a temperature sensor deployed in a forest area sends back an anomalous temperature value to central aggregator at a certain time, but then it sends back a series of normal temperature values. This anomaly might be caused by the direct sunlight focus landed on the temperature sensor during dewdrop time. When the angle of sunlight changes, the temperature values drop naturally. Obviously, this should not be considered, which consequently triggers a fire alarm. However, if the temperature sensor constantly sends back anomalous temperature values to the central aggregator or its neighbor sensors send anomalous temperature values as well to the central aggregator at the same time period, this is more likely a fire alarm. Hence, it is necessary to propose a heuristic method to better detect both anomalous behaviors and anomalous events accurately and efficiently.
The remainder of this article is organized as follows. In section “Related work,” the previous related work on anomaly detection are introduced. In section “AEDTS model,” together with the anomaly detection method, the AEDTS (Anomalous Events Detection based on Temporal dimension and Spatial dimension) model is presented. In section “Experiments,” the experiments conducted to evaluate the performance of AEDTS on both real dataset and synthetic dataset are discussed. In section “Conclusion and future work,” we further summarize the article and discuss the directions of our future work.
Related work
Traditional anomaly detection methods
Anomaly detection is generally considered as the problem of finding the patterns in data which do not conform to priori expected behaviors. 6 So far, researchers have done lots of related work on anomaly detection and made some achievements. 7 Meanwhile, some general principles have been derived and some valuable methods have been proposed.
Generally, traditional anomaly detection methods can be roughly classified as three categories, that is, methods based on distance, methods based on density, and methods based on model. As to the methods based on distance, some common distance calculation methods, such as Euclidean distance, are often adopted as the measure for anomaly detection. In most distance-based methods, an object is considered as anomalous when the distance between the object and the center of detection model exceeds a certain threshold. Angiulli 8 proposed an algorithm for mining distance-based outliers in very large datasets whose I/O cost corresponds to the cost of reading the input dataset twice. Similar to most distance-based algorithms, it is greatly influenced by data distribution. Moshtaghi et al. 9 developed a theory underlying three measures of similarity which can be used for anomaly detection. However, the algorithm is constrained to high-dimensional data space. Zhao et al. 10 proposed an anomaly detection method which is based on adaptive fuzzy clustering. However, it suffers from too many false alarms. Shaikh and Kitagawa 11 analyzed the problem of anomaly detection from uncertain data which is based on the computation of top-k distance. Although the complexity of the anomaly detection algorithm based on distance computation is relatively low, when processing real-world datasets, the accuracy of the algorithm cannot be guaranteed. Shaikh and Kitagawa 12 proposed a cell-based approach, aiming at solving the outlier detection on uncertain datasets of Gaussian distribution. But the algorithm is sensitive to parameters and cannot remain stable in anomaly detection.
As to the methods based on density, an object is considered as anomalous if the density of the area where it locates is less than the predefined threshold.13–23 In most local anomaly detection cases, density-based methods perform better than the methods of other category. Liu et al. 24 proposed an anomaly detection method based on the concept of isolation without employing any distance or density measure. As a result, the method still suffers from too many false alarms. Gupta et al. proposed an anomaly detection method focused on the individual data points which are considered as globally anomalous. However, it ignores the correlation among these data points.
As to the methods based on model, an anomaly detection model is first established, and then the model can be further trained by historical data.25–35 From the perspective of methods involved in the model, there exist the anomaly detection models based on statistical methods such as Gaussian distribution, machine learning methods such as artificial neural network, or overlapped methods such as support vector machine (SVM). Schlkopf et al. 36 proposed a method for anomaly detection which is based on a natural extension of SVM. However, the method relies heavily on prior knowledge. Subsequently, some other anomaly detection methods, which are based on SVM, are put forward. However, the performance of these SVM-based anomaly detection methods suffer from the sensitivity to missing data. Huang et al. 37 proposed two unsupervised anomaly detection algorithms which can distinguish local anomalies from normal instances. But it neglects the changes of anomalous behaviors. Ma et al. 38 proposed a framework, which can detect anomalies in uncertain data stream. However, it cannot detect the correlation among anomalous behaviors effectively.
Anomaly detection in IOT through WSN
With the widespread application of IOT through WSNs, traditional anomaly detection methods cannot fully meet the requirements of detecting the anomalies in IOT through WSN accurately and efficiently. In view of this, researchers have developed some new methods for anomaly detection in IOT through WSN.
Chen et al. 39 proposed a fully distributed general anomaly detection (GAD) scheme, which uses graph theory and exploits spatiotemporal correlations of processes for real-time anomaly detection. However, GAD cannot detect anomalous event which consists of a series of related anomalous behaviors and reflects the changes of anomalous behaviors.
Liu et al. 40 proposed an unsupervised anomaly detection framework, which is capable of detecting anomalous behaviors and events from the perspective of spatial dimension and temporal dimension. Although the contextual neighbors of each sensor are taken into account, the sensor data change and the correlation among them are ignored.
It can be seen that most existing anomaly detection methods focus on individual anomalous behavior (data) or the anomalous event which consists of both anomalous behaviors and their spatial or temporal anomalous neighbors.41–43 However, most previous work has overlooked the changes in anomalous behaviors and the correlations among them.
In this article, we present AEDTS, an anomaly detection model, which takes the changes of sensor data into account and is capable of detecting both anomalous behaviors and anomalous events accurately and efficiently. In AEDTS, an anomalous behavior detected will not be considered as anomalous event first, and the changes of the anomalous behavior and its contextual neighbors are further taken into account on both temporal dimension and spatial dimension. If the behaviors (data) sent from the same sensor constantly show anomaly, these temporal sensor data might trigger an anomalous event. If most spatial neighbors of a series of sensors have shown anomalies in succession within a predefined time period, an anomalous event might be triggered.
AEDTS model
In this section, the problem formulation of anomalous event detection is presented, and then follows the definitions, analysis, and our solution in detail. The proposed AEDTS consists of the following phases: data preparation phase, initial clustering and grid partition phase, and anomaly detection phase.
Problem formulation
In most cases, data extremum attract more attention than normal data such as financial crisis warning, climate extremes, and bank loan. In this section, anomaly and anomalous event are first formally defined, and then the unsupervised density-based clustering algorithm, the grid partition strategy, and the notion of spatial–temporal anomaly are introduced. Based on these definitions, the unsupervised contextual anomaly detection model AEDTS is presented.
In Figures 1 and 2, the temporal anomaly and spatial anomaly, both which are involved in contextual anomaly, are shown, respectively. As shown in Figure 1, the sensor data, which are sent from a certain sensor, change over time, and there exist a series adjacent anomalies and two separate anomalies which are surrounded by a rectangular dotted box and solid circles, respectively. Among the anomalies, the separate and adjacent anomalies are considered as anomalous behaviors and an anomalous event, respectively. As shown in Figure 2, the data from all sensors are first aggregated by DBSCAN (Density-Based Spatial Clustering of Applications with Noise), a density-based clustering algorithm, and then the outliers, which are separated from the clusters, are identified as anomalies, which are represented by red solid points. In order to clearly reveal the anomalies in grid cells, all normal data are not shown in Figure 2. As a widely cited clustering algorithm in scientific literature, DBSCAN is awarded the Test of Time Award in 2014.44,45 When clustering, other than most distance-based algorithm, DBSCAN does not need to specify the number of clusters in advance and it can find the clusters of arbitrary shape. Next, the monitored spatial region, where all sensors are deployed, is partitioned into grid cells, where a grid cell is considered to be anomalous only when the number of anomalies, which are generated from the clustering process and located in the grid cell, exceeds a certain proportion. Then, the anomalous grid cells are aggregated by the grid merging strategy. The generated clusters of anomalous grid cells, marked as circles 1 and 2 in Figure 2, are considered as spatial anomalous events (SAEs) that must trigger an alarm, while each individual sparsely situated grid cells are considered as anomalous behaviors. In addition, If a spatial anomaly event remains for a certain period of time, it is then considered as a temporal anomalous event (TAE) as well.
Definition 1: Anomalous behavior
An anomalous behavior occurs when, at a certain point in time, an input from a sensor exceeds a threshold or is significantly different from the inputs of its neighboring sensors.
Definition 2: Temporal anomalous event
A temporal anomalous event occurs when, within a given time period, a cluster of inputs from a sensor exceeds a given threshold.
Definition 3: Spatial anomalous event
A spatial anomalous event occurs when two anomalous clusters, generated by anomalous grid cells during the clustering process, are spatial adjacent.

An example of temporal anomaly.

An example of spatial anomaly.
Grid partition and grid cells merging
In this section, we describe in detail the key steps of grid partition and anomalous grid cell merging in the anomaly detection model. In order to detect the distribution of anomalies, we first partition the region where all sensors are deployed into grid cells, and the statistics of each grid cell can be represented by a 5-tuple. As shown in Figure 3, in each 5-tuple
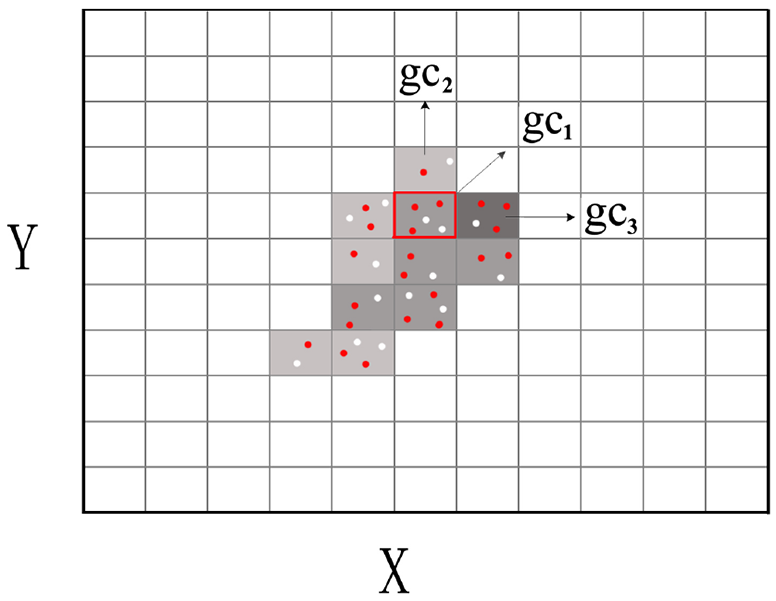
Spatial grid cells (anomalous and normal).
Suppose the region where all sensors in a WSN are deployed is partitioned into
When detecting SAEs, we first calculate the ratio of anomalous data in each grid cell. In Figure 3, we use different scales of gray to indicate the level of anomalous data in a grid cell. If the ratio exceeds a predefined threshold
Anomaly detection model
In our model, a series of sensor data from the sensors in a WSN are taken as input, the data from the same sensor are analyzed based on time dimension, and the data from different sensors are analyzed synchronously. Generally, the anomalies detected are further classified into individual anomalous behaviors and anomalous events. As such, our proposed anomaly detection model consists of data preparation phase, initial clustering and grid partition phase, and anomaly detection phase. The proposed anomaly detection model is shown in Figure 4.
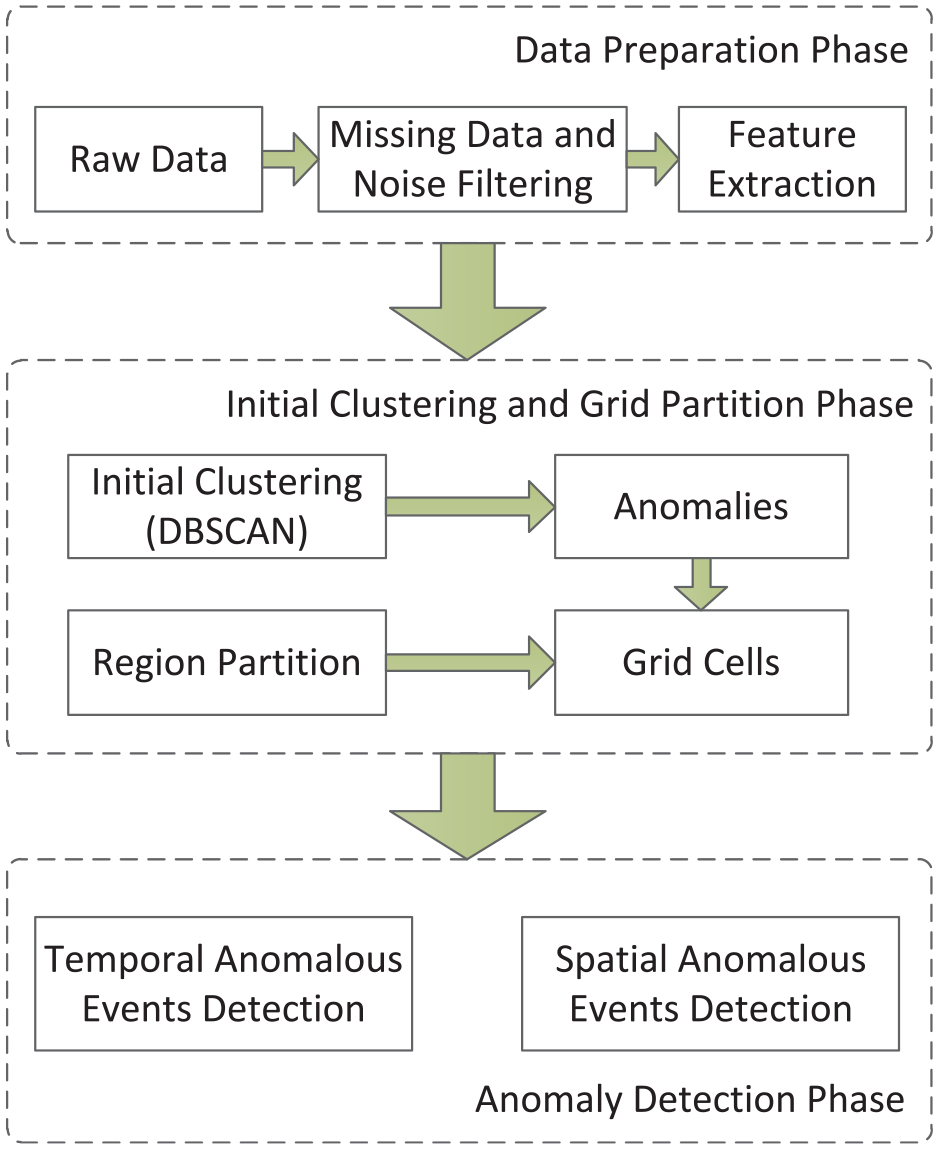
Anomaly detection model (AEDTS).
Data preparation
In the data preparation phase, the sensor data from WSNs are first cleaned and normalized, because it is almost impossible to avoid the situation of data missing or appearing noise, which might lead to skewed data distribution in the process of data acquisition. Then, the important features are further extracted, which might improve detection efficiency and reduce the interference from irrelevant features.
Initial clustering and grid partition
In the initial clustering phase, all the data from the sensors with the same time stamp are aggregated by DBSCAN. And the generated clusters are identified as normal data and distinguished from the anomalies. Then, the region where the sensors are deployed is partitioned into grid cells according to the predefined
Anomaly detection
In the anomaly detection phase, not only individual anomalies but also anomalous events are detected by temporal and spatial analysis. When detecting TAEs, the anomalies over a period of time are analyzed, and each series of adjacent anomalies on time dimension, which meet the predetermined temporal requirements, is identified as TAE. When detecting SAEs, the anomalous adjacent grid cells are aggregated by grid-based clustering algorithm, each generated clusters of certain scale are identified as SAEs, and the rest of the anomalies in the other individual anomalous grid cells are identified as anomalous behaviors.
Anomaly detection algorithm
In this section, we describe the key steps in the anomaly detection model in detail. As mentioned above, the complete algorithm of AEDTS consists of three key steps: the step of data preparation, which includes the process of filtering missing data, cleaning the sensor data in WSN, and normalizing the data to be analyzed; the step of initial clustering and grid partition, which includes the process of initial temporal anomalous data detection, spatial grid partition, and calculating the statistics of grid cells; and the step of anomalous event detection, which includes the process of TAE detection and SAE detection. The complete algorithm is shown in Algorithm 1.

Experiments
In this section, the performance of AEDTS is evaluated based on the experiments on several UCI datasets and is also compared with three state-of-the-art anomaly detection methods. In section “The datasets,” the datasets used in this article are presented. In section “The baseline methods,” the methods which are employed to compare with AEDTS are introduced. In section “The evaluation,” the evaluation indexes which are widely employed for the experiments of anomaly detection are presented. In section “Experimental results and analysis,” the experimental results are presented in detail.
The datasets
In this article, the performance of AEDTS is evaluated based on three UCI datasets, as shown in Table 1, which include the subset of KDD CUP’99 network intrusion (Http), El Nino, and the Electricity Board Hourly Readings. 46 The KDD CUP’99 network intrusion dataset contains the network intrusion data, the El Nino dataset contains oceanographic and surface meteorological readings taken from nearly 70 moored buoys positioned throughout the equatorial Pacific, and the Electricity Board Hourly Readings dataset contains the real-time readings from Tamil Nadu. As for the data in the datasets, since we need only the attributes with continuous values, the binary attributes and nominal attributes are removed. In this article, With Mulcross data generator, a synthetic dataset with 100,000 data points and 9% anomalies is generated, and we further add 10 anomalous events, each of which includes 100 continuous anomalies, to the synthetic dataset.
Properties of datasets used in the experiments.

The baseline methods
In this article, we compare the performance of AEDTS with three baseline methods, which perform well in anomaly detection or can be used to evaluate the performance of anomaly detection methods. The first baseline method employed in the experiments is ORCA (ORCA is a program for mining outliers in large multivariate data sets) 47 which is based on the well-known k-nearest neighbor (KNN) method. Meanwhile, ORCA employs a sample randomization strategy and a simple pruning rule and almost has a linear time complexity. The second baseline method employed in the experiments is one-class SVM. 48 Since one-class SVM with radial basis function kernel performs well in anomaly detection, it is generally used as the baseline method for evaluation. The third baseline method employed in the experiments is local outlier factor (LOF), 49 a density-based method which can detect outliers effectively in high-dimensional dataset.
The evaluation
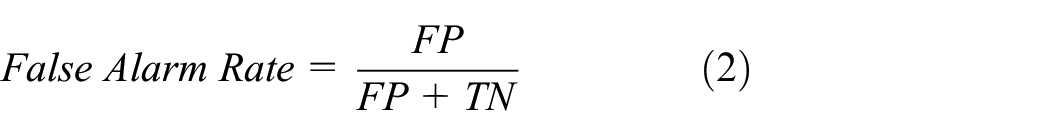
In order to evaluate the performance of AEDTS, three commonly used evaluation indexes are employed, which are detection rate (DR), false alarm rate (FAR), and run time. As described in Table 2, true positive (TP) denotes the anomalies which are correctly identified as anomalous, false positive (FP) denotes the normal data which are incorrectly identified as anomalies, true negative (TN) denotes the normal data which are correctly identified as normal, and false negative (FN) denotes the anomalies which are incorrectly identified as normal data. Based on the indexes described in the confusion matrix, the DR and FAR are further calculated by equations (1) and (2)

Confusion matrix.

Experimental results and analysis
Performance of anomaly detection
In this experiment, we compare the performance of ORCA, LOF, one-class SVM, and AEDTS using both KDD CUP’99(Http) and El Nino datasets. As for the parameter settings, we set
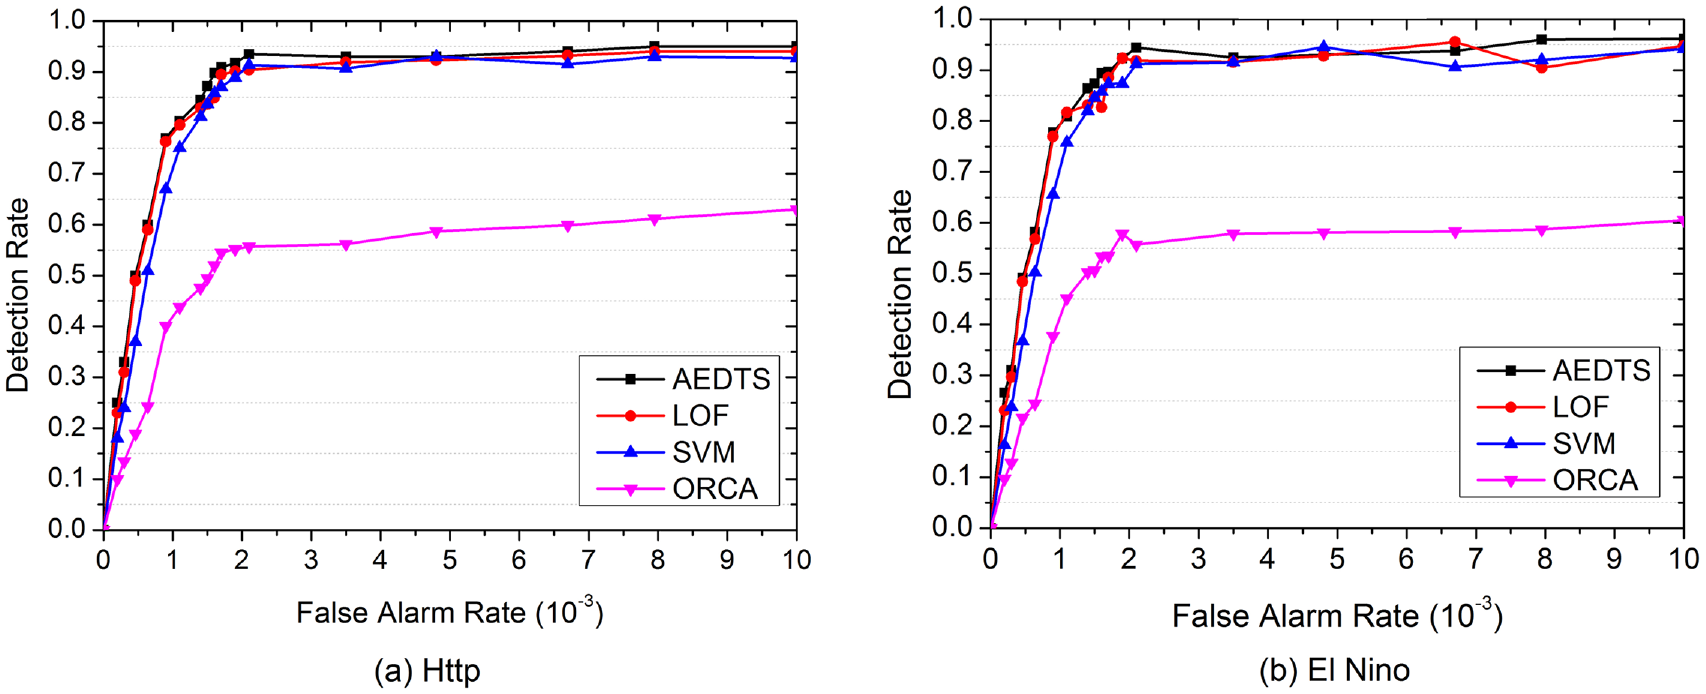
Performance comparison for anomaly detection.

Runtime comparison for anomaly detection.
Performance of anomalous event detection
In this experiment, we test the performance of AEDTS on both the real datasets, which are KDD CUP’99 (Http), El Nino, and Electricity Board Hourly Readings, and the synthetic dataset. In order to simulate the situation of sensor data at different times, the data in KDD CUP’99 (Http) are divided into several sections and labeled with different time stamps. And the data in Electricity Board Hourly Readings are divided into several sections and labeled with different coordinates, so as to simulate the situation of sensor data of different locations. Since there exist both spatial attributes and temporal attributes in El Nino, it does not need additional processing. As to the parameter settings, we set
Performance of AEDTS.

AEDTS: Anomalous Events Detection based on Temporal dimension and Spatial dimension; TAE: temporal anomalous event; SAE: spatial anomalous event.
Performance of AEDTS with different parameter settings
The following experiments investigate the efficiency and effects of AEDTS with different parameter settings on the synthetic dataset. Generally, the region where all sensors are deployed is partitioned into

Performance of AEDTS with different p (

Performance of AEDTS with different k (
Conclusion and future work
Although many anomaly detection methods have been proposed to date, very few can detect anomalous events to adapt to the changes that exist in sensor data. In this article, we propose an adaptive method based on contextual anomaly detection in IOT through WSNs, which can not only detect individual anomalies but also detect TAEs and SAEs. The advantages of our proposed method are as follows:
Compared to traditional anomaly detection method, our proposed novel contextual anomaly detection model is combined with density-based clustering algorithm that can identify clusters of arbitrary shapes;
Based on AEDTS model, not only individual anomalies but also TAEs and SAEs that directly or indirectly reflect the correlation between anomalies can be detected efficiently and effectively;
The proposed model can be further improved to detect anomalies in different application scenarios such as remote sensing applications or IOT applications. Furthermore, advanced approaches, such as interactive data mining and machine learning techniques, can be integrated into the model to further improve the detection performance.
In our solution, the proposed model partially depends on the selection of clustering method, which has a certain influence on the detection results. As a future work, we will further improve on the selection strategy of the proposed clustering method and the adaptability of AEDTS. In addition, we will also work on improving the ability of AEDTS on processing real-time data streams and on anomaly detection in various application scenarios.
Footnotes
Handling Editor: Xiaojiang Du
Declaration of conflicting interests
The author(s) declared no potential conflicts of interest with respect to the research, authorship, and/or publication of this article.
Funding
The author(s) disclosed receipt of the following financial support for the research, authorship, and/or publication of this article: This research was supported by the Guangdong Province Key Area R&D Program of China (Grant No. 2019B010137004), the National Natural Science Foundation of China (Grant Nos 61972108, U1636215, and 61871140), the National Key Research and Development Plan (Grant No. 2018YFB0803504), the National Arts Youth Fund (Grant No. 31901243), and the Science and Technology Project of Taizhou City (Grant No.1901gy19).