
Abstract
The sorting mechanism underlying the traditional evaluation grid method with attractive factors mainly represents the time or the paired comparison method. However, the current approach employed to identify abstract factors of attractiveness may not be comprehensive. The objective of this article is to propose a hybrid method with an integrated fuzzy Kano model and fuzzy importance–performance analysis to evaluate attractive factors. Fuzzy importance–performance analysis is a more accurate quantitative–qualitative method for two-dimensional analysis, and integrated fuzzy Kano model compensates for the low-resolution problem of the traditional Kano model. A combination of both models arrives at a more comprehensive and reliable evaluation grid method evaluation mechanism. The results indicate that the attractive factors sorted through integrated fuzzy Kano model–fuzzy importance–performance analysis have deconstructed abstract factors and feature factors of the customer service robot. Moreover, the key factors of the products sorted by through integrated fuzzy Kano model–fuzzy importance–performance analysis provide a better understanding of customer expectations associated with the products, which consequently enables developers and designers to accurately understand the design style and conceive new ideas.
Keywords
Introduction
Currently, new product ideas have to generate support before they can become formal development projects. 1 From a designer’s point of view, a better alternative would be to discover profitable ideas. 2 Vigorous challenges have transformed many manufacturers from being production-centralized to being customer driven. 3 Therefore, customer satisfaction has become an important factor companies need to address when developing new products. 3 The evaluation grid method (EGM), which was introduced by Sanui, 4 is a theoretical method for preference-based design that has been utilized to develop attractive products or systems. 5 EGM is mainly used to evaluate the attractive factors of products, which consist of original level (preferred attribute of products), upper level (abstract factors) and lower level (specific feature factors). 5 A qualitative EGM matches the abstract feelings of interviewees with concrete product features. This information is useful for designers and developers to better understand the relationship between customer preferences and product attributes. Consequently, products can be reasonably configured, and the results are expressed using a hierarchical diagram of the appeal factors for evaluation. 6
However, as research progressed, several scholars 6 have discovered insufficiency in the use of the subjective qualitative evaluation method, particularly with regard to similar product features. These issues directly affect the conclusions of the evaluation of EGM and may lead to a different design direction. Thus, to improve the discrimination ability of EGM, numerous researchers have attempted to use quantitative analysis methods. Therefore, current studies6,7 that mainly focus on solving problems related to EGM rely too much on qualitative analysis as well as ways to organize different types of attractive factors into multiple evaluation dimensions. Consequently, EGM should be optimized to attain more comprehensive qualitative and quantitative analysis methods of customer satisfaction. Moreover, it should also explore the combination of evaluation method of customer satisfaction and the customer’s perception of product features as well as increase the analytical dimension of attractive factors.
Consequently, scholars have developed an integrated method with the analytic hierarchy process (AHP) and the Kano model.8,9 AHP is a combination of qualitative and quantitative decision analysis methods and can sort the relative weight of all product features by comparison in pairs. 8 Although this method uses quantitative analysis to improve EGM, a single evaluation dimension is insufficient to reflect the diverse abstract factors of products. Moreover, despite the ability of the Kano model to divide product attributes into five different quality categories, 8 its qualitative analysis is not sufficiently precise and lacks discrimination in the face of similar product features. Therefore, further optimization is needed for better application to the EGM.
The objective of this study is to propose a hybrid method of the integrated fuzzy Kano model (IFKM) and fuzzy importance–performance analysis (FIPA) that offers a solution to the above-mentioned problems. FIPA is a more accurate quantitative–qualitative method for factor analysis with two dimensions of evaluation indicators, and IFKM compensates for the low-resolution problem of the traditional Kano model. The combination of both models improves the sorting mechanism of attractive factors of the EGM and makes the relationship between attractive factors more comprehensive and reliable. The paper takes as a case study, a customer service robot (CSR), which is a new product that provides information service in public space such as bank or hotel.
The remainder of this article is structured as follows: section ‘Literature review’ provides a review of the literature. Section ‘Methods’ outlines the research methodology that was utilized for analyses. Section ‘Results’ describes the profile of survey data, attractive factor analysis (IFKM-FIPA) and correlation relation (calculated by quantification theory type I (QT-1)); this section includes the results of compared analysis and associated features analysis. Section ‘Discussion’ presents a discussion of the results between the traditional method and IFKM-FIPA. Finally, a conclusion is drawn in Section ‘Conclusion’.
Literature review
EGM
The EGM was derived from Kelly’s psychology category, 10 which is the main method to capture personal cognitive concepts and build a hierarchical diagram 4 (Figure 1). The EGM explores the abstract perspective of the satisfaction and preference of customers with the attractiveness of products. 4 Ma et al. 5 found the design strategy for the attractiveness of new products and built a quantitative relationship between the perceptual concept and product appearance. Several researchers6,7,11 have used the EGM to evaluate the inherent relationship and regularity between abstract factors and specific product features. Their results showed that EGM has a significant effect on developing attractive factors of innovative products, especially in new product development or design process. So far, traditional EGM was found to place too much emphasis on qualitative evaluation, and the subtle differences between similar attractive factors are difficult to discern. Therefore, a number of scholars12–14 have attempted to integrate a quantitative analysis method, QT-1, to explore multiple regression relationships between attractive factors of the EGM.

A hierarchical diagram of the evaluation grid method (EGM).
QT-1
QT-1 is a branch of multivariate statistical analysis that was presented by Hayashi. 15 QT-1 multiple regression analysis is used in situations where independent variables are qualitative variables and dependent variables are quantitative variables. QT-1 builds a mathematical model between both variables to forecast the dependent variable and identifies the inner link and underlying laws of things. 15 QT-1 has been used for qualitative and quantitative investigations, such as the analysis of the relationships between ‘people’s abstract qualitative properties’ and ‘design elements of quantitative properties’. 4 Regarding product design, QT-1 can also be adapted to access the weight between the design factors of user preferences. In the field of EGM, QT-1 not only provides quantized data information regarding the role of attractive factors but can also be used as a quantitative validation tool. However, the calculation of QT-1 is mainly based on the sorting result of the EGM, which cannot intervene in the analysis process of the upper and lower factors of the EGM.
AHP
AHP is a multiple-criteria decision-making technique developed by Saaty 16 for the assessment and selection of alternatives according to a set of selected criteria based on the elements of the hierarchy, related to any evaluation index of the decision problem. The previous research8,17,18 has shown that AHP can conduct effective weight analysis of design features for products to implement the reasonable and effective configuration of design features during product development. Kang et al. 9 used AHP to analyse upper-level factors of EGM in a paired comparison and attempted to improve the rationality of EGM. The cumulative method of mention times 19 or paired comparison (AHP) is still being adopted to define the weight of each factor in the current EGM study.
Although the upper-level factors (abstract factors) of EGM have their particularity, the difference between abstract words is not exactly identified by the quantitative weight. From the customer’s preference, the strong or weak influence of each abstract factor is not equivalent to the important strength of the keywords embedded in the product. For example, when the words ‘tough’ and ‘slim’ are compared, even if most of the respondents consider ‘slim’ to be better than ‘tough’, for a specific product, ‘tough’ may not be a disadvantage or a defect, and thus, it would likely obtain higher user satisfaction in a durability evaluation. Various semantics from different evaluation indicators will directly lead to different user satisfaction with a specific effect on the result of the correlation analysis. Henceforth, the performance of AHP is limited in terms of comprehensively reflecting the influence of abstract factors on the product.
The Kano model
In the field of new product design and service development, Kano model is used for evaluating consumer preferences and requirements (Figure 2). 20 In the field of service quality research, customer research often involves multiple dimensions.21,22 Therefore, as a type of perceived service quality, the products’ attractive factor can also be evaluated from different dimensions. The Kano model 23 stresses a two-dimensional quality of user satisfaction. Kano’s five identified qualities are must-be quality (M), one-dimensional quality (O), attractive quality (A), indifferent quality (I) and reversal quality (R). The attractive quality exerts a significant effect on user satisfaction. 24 For customers who do not have clear attitudes towards specific products, the investigation data achieved by the Kano model are not sufficiently accurate for product detail features. 25 Yang 25 improved the fuzzy Kano model (FKM) questionnaire, and the results showed that compared with the traditional Kano model, consumer feelings could be expressed with more detail and analysed more accurately using the FKM. 26

The Kano model.
Moreover, the traditional Kano model is a subjective qualitative method, which limits the effect of decision support in the field of product development because of its close features that straddle the boundaries of the factors, thus leading to a higher misjudgment rate. Consequently, it is necessary to improve the traditional FKM by refining the category judgment index and optimizing the entire research process.
The basis of the Kano model classification has been adjusted.27,28 Lee et al. 28 proposed a refined model that divides Kano’s first four categories into eight categories. Based on this refined model, manufacturers can obtain a more accurate understanding of the quality attributes from the customer’s perspective, thus making more precise quality decisions. By adjusting the attribute type of the Kano model, Meng et al. 27 further refined the quantification calculation between various projects with the degree of approximation algorithm and introduced a comprehensive method through combination with the importance–performance analysis (IPA) model. To increase the precision of the classification of functional features, numerous scholars27,29,30 developed a combined IPA–Kano model for a comprehensive evaluation of the key factors of new products.
IPA
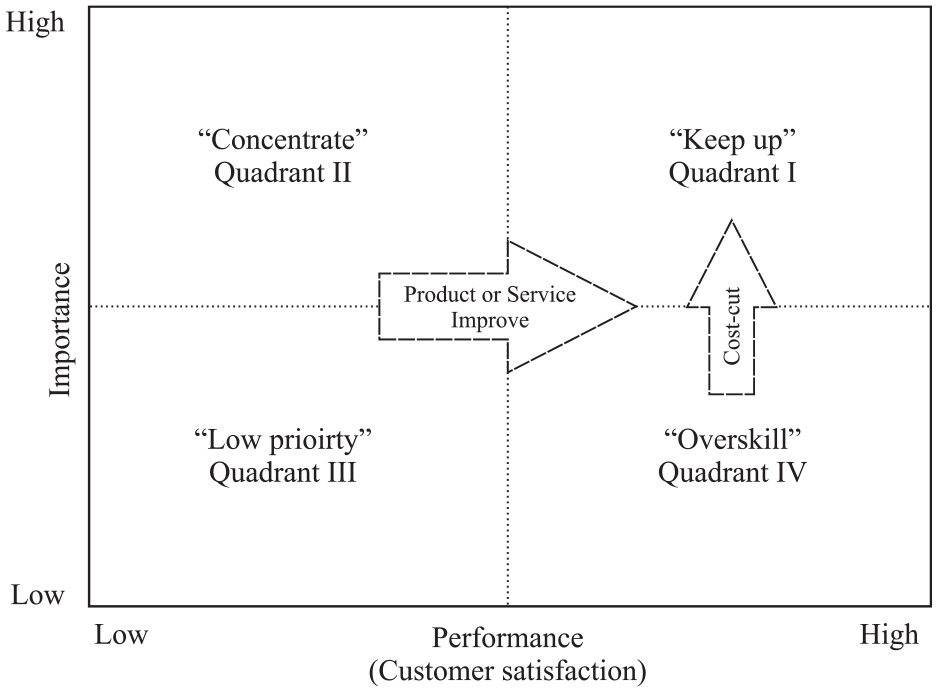
IPA, introduced by Martilla and James, 31 is a two-dimensional grid based on customer-perceived importance and product performance for identifying the crucial product or service attributes. 29 The IPA matrix (Figure 3) consists of vertical (importance) and horizontal (performance–satisfaction) axes that call for the calculation of the mean value of all attributes. 32 IPA has been extensively used in customer satisfaction analyses for improving products and service quality in many fields.33–35 Although by considering the subjectivity, randomness and fuzziness of the user’s attitude, the perception measurement is still based on a discrete evaluation, and the continuity of the attitude change is neglected. Many scholars36–38 applied a fuzzy algorithm to enhance the detailed differences of user’s feelings between continuous performance evaluation. It can be verified that the resulting fuzzy IPA (FIPA) method is suitable for weight sorting of abstract factors in EGM. While customers’ satisfaction of design styles indicates the performance of those design styles, customers’ perception of their importance indicates the perceived importance of those design styles.
Importance–performance analysis.
The limitations of prior research can be summarized as follows:
Traditional EGM focuses too much on qualitative analysis and offers limited discrimination, which makes it difficult to integrate diversified attractive factors.
The evaluation dimension of the paired-comparison method of AHP is relatively single, which causes one-sided evaluation results when faced with diverse abstract factors.
In the application of EGM, the traditional Kano model needs to be further optimized to compensate for the lack of discrimination for similar product attributes.
IPA can increase the evaluation dimension during abstract factor analysis, but it still belongs to a rough qualitative analysis, and needs to be combined with a fuzzy algorithm to improve accuracy.
In summary, in EGM research, the main current difficulty is to solve the synergy problem of the quantitative and qualitative analysis. The reason is that both quantitative analysis data of abstract factors and multidimensional quantitative and qualitative analysis of attractive factors are needed for practical application. Furthermore, adopting a hybrid method of IFKM and FIPA can meet the current requirements and provide a more valuable reference for the design and development process.
Methods
The modelling method implemented in this study is shown in Figure 4. The main purpose of the first stage was to capture and extract more comprehensive attractive factors through expert interviews and to intuitively reflect the relationship between attractive factors through a hierarchical diagram. The second stage consisted of IFKM-FIPA analysis, upper-level factors and original level factors extracted from EGM. These were evaluated through the triangle fuzzy value to identify importance and performance and were subsequently sorted by IFKM from the fuzzy value of the interviewee’s attitude. Then, the ranking was performed through conjoint analysis with the weight and priority determination of each item. At the final stage, data of the regression relationship between each factor were calculated through QT-1.

Modelling of the IFKM-FIPA procedure.
Stage 1: attractive factors extracted by the EGM
The separation and acquisition of more comprehensive features, as well as abstract factors from products, are mandatory to achieve the objective of extracting attractive factors. Thus, keener insights and specialized knowledge are required, which may not be readily provided by general interviewees. The result of the EGM is qualitative data that does not affect the final weight sorting. Therefore, an expert group was organized for the EGM interview (Delphi method). The Delphi method 39 is a forecasting process framework based on the results of questionnaires sent to a panel of experts. The expert group consisted of 30 participants who were professional designers, design students or product developers. Each interview lasted for 15 to 30 min. The main interview activities included the following: (1) interviewees were allowed to browse the product sample cards (a total of 35 product samples) by comparing no more than three selections they deemed satisfactory; (2) interviewees were asked to describe the reason for their selection and record the original level (no more than three from each sample); (3) next, interviewees were asked to describe the features using one or more adjectives (abstract factors) and record the upper level; (4) finally, experts were allowed to point out concrete features (the lower level) of the original level that correlated with the adjectives. Statistics were performed and all the data were summarized. The approximation of the upper level by the KJ method was combined and a vocabulary list was created. The KJ method 40 is used to organize data into useful categories and proposes a way to combine similar items. A list of the preferred attributes (the original level) and concrete features (the lower level) was arranged, and a map was drawn using a hierarchical diagram.
Stage 2: IFKM and FIPA
According to the upper level and the original level, a tailored IFKM-FIPA questionnaire was designed for the evaluation of the relationship between both levels. First, the number of respondents needs to be determined. Respondents should attain a representative sample size, and the planned sample size is more reasonable than an arbitrarily determined sample size 41

where n represents the number of samples, z represents the reliability coefficient, h represents the expected sampling error value and
According to the sample calculation method of Jiou, 41 because of the limitations of the study’s survey and in consideration of the cooperation degree of the respondents at the time of the survey, equation (1) yielded that the number of samples required for formal questionnaire interviews in this study should not have been less than 56. Consequently, a total of 100 questionnaires were distributed. All interviewees were required to have experience or knowledge regarding service robots or related products, and 92 valid questionnaires were gathered, which indicates a recovery rate of 92%.
The two-level factors of the hierarchical diagram by IFKM and FIPA were scored. The methods are described in the following.
FIPA
FIPA is a comprehensive evaluation method used for quantifying satisfaction-influencing factors through a fuzzy rule. According to defuzzification rules, the following actions are mandatory: conversion of the perceived performance of the triangular fuzzy value to a logic value, combination of perceived performance to the corresponding measurement of importance and two-dimensional distribution of perceived performance and its importance through quadrant analysis. 42
Traditional measurement establishes five evaluation variables: very weak (VW), weak (W), normal (N), strong (S) and very strong (VS). The use of a triangle fuzzy value (three value judgments: lowest value, middle value and highest value) to outline the evaluation variables of respondents is more suitable with a fuzzy quantity of respondents.
Different interviewees generate diversified evaluation indices. For example, one interviewee had the triangular fuzzy values (0, 0 and 0.25), (0, 0.25 and 0.50), (0.25, 0.50 and 0.75), (0.50, 0.75 and 1.00) and (0.75, 1.00 and 1.00), which translate to very dissatisfied, not satisfied, in general, satisfied and very satisfied (Figure 5). Another interviewee had the triangular fuzzy values (0, 0.15 and 0.30), (0, 0.30 and 0.45), (0.40, 0.50 and 0.60), (0.75, 0.90 and 1.00) and (0.90, 1.00 and 1.00). 43 According to the fuzzy rules (equation (2)), the average fuzzy value of each comment variable can be calculated. This value describes the evaluation variables of the fuzzy comprehensive evaluation and represents the average cognitive level of the comment variables

where

The cognitive levels of the ith interviewee.
Moreover, based on the interviewee’s perceived evaluation variable through the corresponding algorithm (equations (3) and (4)), the following are employed: triangular fuzzy values, quantitative satisfaction factors and overall satisfaction of fuzzy comprehensive evaluation. Following defuzzification rules (equation (5)), the triangular fuzzy values of perceived performance are obtained and converted to logical values 43
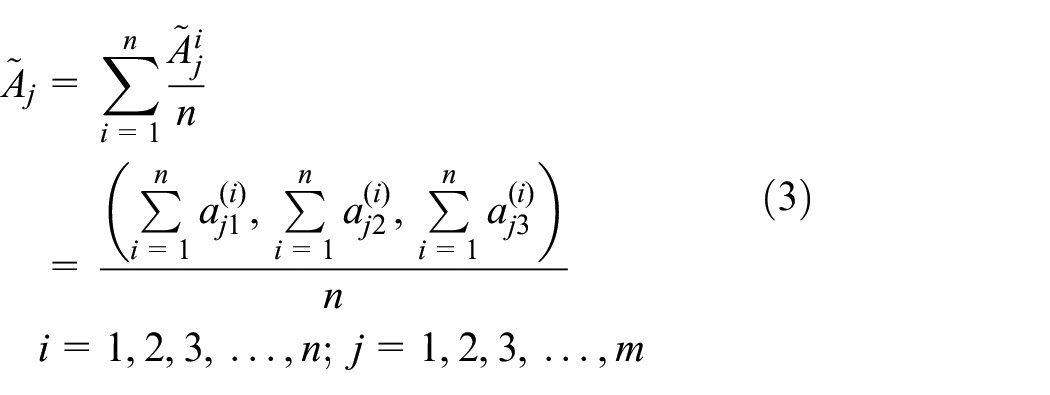
where

Here,

where
Finally, a quadrant analysis diagram is generated using the results from the quantitative calculation.
IFKM
The traditional Kano model requires interviewees to select a single answer that reflects their sentiments towards an attribute, such as ‘like’, ‘must-be,’‘neutral’, ‘live-with’ and ‘dislike’ (Table 1), as a number. In contrast, the FKM is reasonable in processing human vagueness and uncertainties. 44 Human ambiguity or complex feelings (i.e. uncertainties) are expressed through possible degrees as they relate to deriving positive delight or negative disgust towards optional factors. 44 Moreover, the sum of each row should be equal to 1

Kano evaluation table.

M: must-be; O: one-dimensional; A: attractive; I: indifferent; R: reverse; Q: questionable.
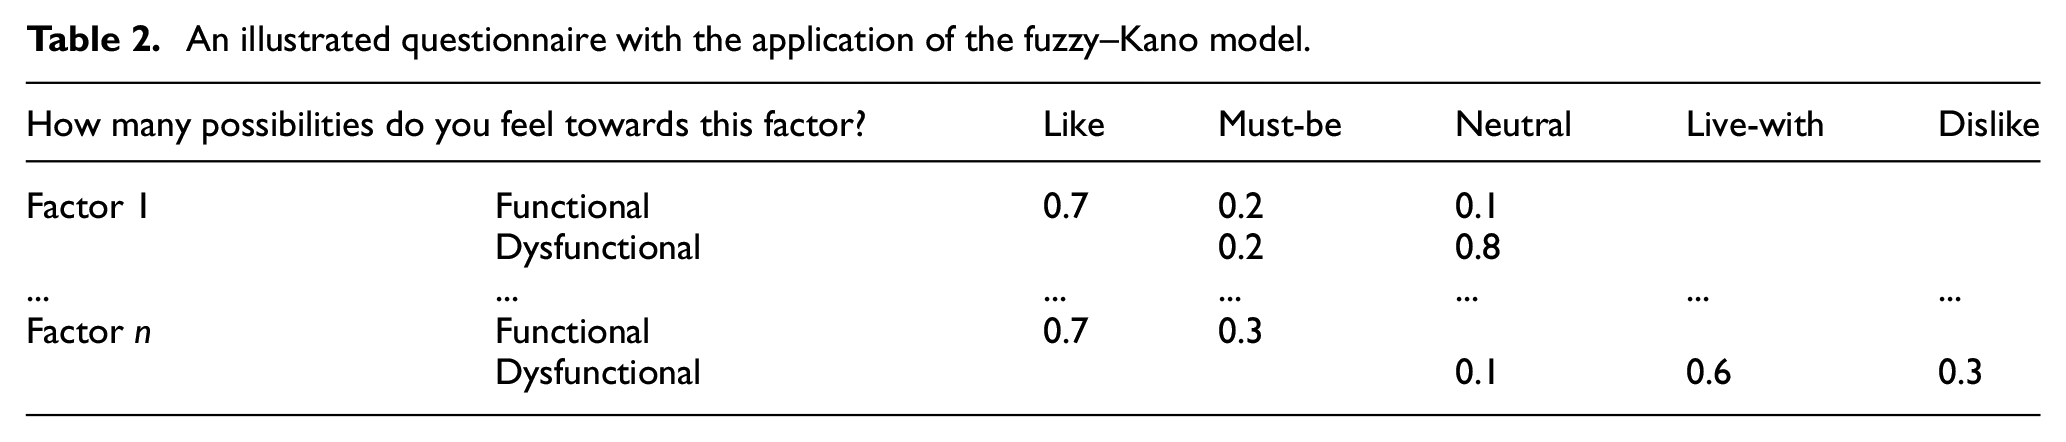
A five-factors row vector is utilized to illustrate the interviewee’s sentiments for both functional presence and dysfunctional absence. For the FKM (Table 2), a linguistic scale is depicted by fun = (0.7, 0.2, 0.1, 0, 0) and dys=(0, 0.2, 0.8, 0, 0). By virtue of matrix algebra, a 5×5 fuzzy relation matrix R (e.g. feature 1 in equation (6)) is obtained through (fun)t×(dys), where the superscript t denotes a transpose operation. 44
An illustrated questionnaire with the application of the fuzzy–Kano model.
As research progressed, Meng et al. 27 realized that the traditional Kano model essentially is a qualitative analysis method, and its classification standard is relatively subjective. When several features of the Kano model are relatively close or straddled between two boundaries, the misjudgment rate is high. Moreover, in the classification table, which reflects the quality factors of the traditional Kano model (Table 1), the 25 possible quality combinations of the differences between corresponding factors were ignored. 27 For instance, each A belongs to an attractive quality, with no difference in calculation. Similarly, M1, M2 and M3 belong to the must-be quality and I1 to I9 belong to the indifferent quality. This classification method can lead to excessive indifferent quality and very few one-dimensional qualities. However, the influence degrees of A1, A2 and A3 should be different if A2 is taken as the datum quality factor. Moreover, because A3 is influenced by O1 and tends to be part of O1, the same case also applies to other qualities. 27 Hence, the adjustment of each feature of the integrated Kano model is obtained through similarity computation, as indicated in Table 3, where M, O, A, I1, I2, I3 and R are canonical judgment (CJ).
Integrated Kano evaluation table.

M: must-be; O: one-dimensional; A: attractive; I: indifferent; R: reverse; Q: questionable.
If given a non-canonical judgment (NJ), similarity to its adjacent CJ is inversely proportional to the distance between them and proportional to the number of CJ. Therefore, the calculation equation of similarity
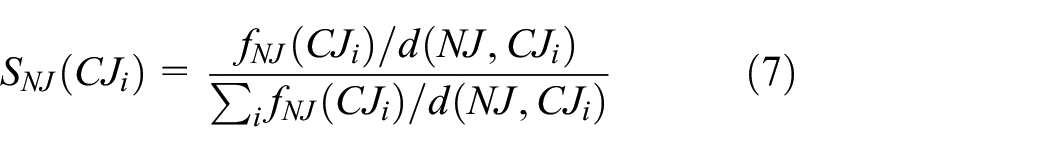
where
For NJ–Q1 in Table 3,

and
where
According to equation (7), the similarity of all features in the classification of quality is calculated and the integrated Kano model of the evaluation system is acquired in accordance with the similarity evaluation system, which ultimately builds the calculation equation for the quantity of five-kind quality features as follows

where
Weight analysis and priority determination of each item
In the stage involving weight analysis and the priority determination of each item, a decision must be made through synthetic evaluation of the results of both IFKM and FIPA.
In the IPA quadrant analysis diagram (Figure 3), the horizontal axis represents the performance index (i.e. the satisfaction index) and the vertical axis represents the perceived importance of quality features. 29 Maintaining performance is shown in quadrant I. Both customer satisfaction and perceived importance are very high and the region’s strategy is to maintain service quality. In quadrant II, improvement is emphasized. In this area, customer satisfaction is low and the perceived importance degree is high. The ideal strategy involves promotion and improvement, with the goal of gradual development towards quadrant I. Quadrant III reflects the lowest value. Quadrant IV indicates excessive performance, where customer satisfaction is high but has low perceived importance. Thus, the regional strategy should be to maintain performance. However, because of a lower importance degree than in quadrant I, the priority is also lower than in quadrant I. Furthermore, the regional factors of service quality may be gradually developed towards quadrant I through user training and product marketing. Decreasing excessive costs of the features may also be considered.
Moreover, because of the different categories of the Kano quality, the priority of quality features must generally follow: M > O > A > I. 20 When combined with FIPA analysis, the final evaluation is given in Table 4. Numbers 1 through 6 represent strategic priorities. For the indifferent quality (I) and reverse quality (R), the strategy is ‘don’t care about or removed’. Thus, Table 4 is not mentioned.
IFKM-FIPA factors weight sorting.

M: must-be; O: one-dimensional; A: attractive; IFKM: integrated fuzzy Kano model; FIPA: fuzzy importance–performance analysis.
Stage 3: Data calculated by QT-1
In QT-1, the qualitative variable (x) is called item (the original level) and all abstract factors evaluation values (y) in each item are called category (the upper level).
45
To express the response of an item and the category of each sample, the dummy variable
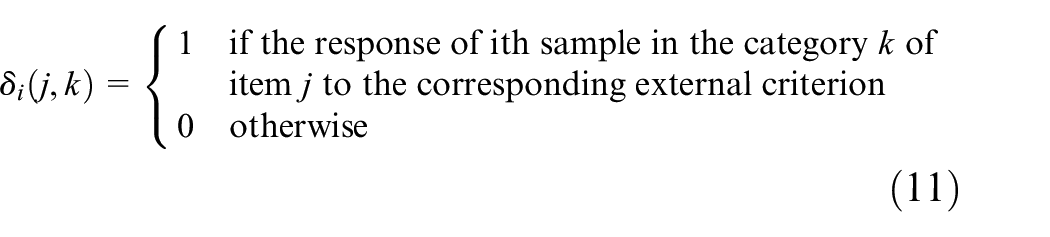
Defined as follows
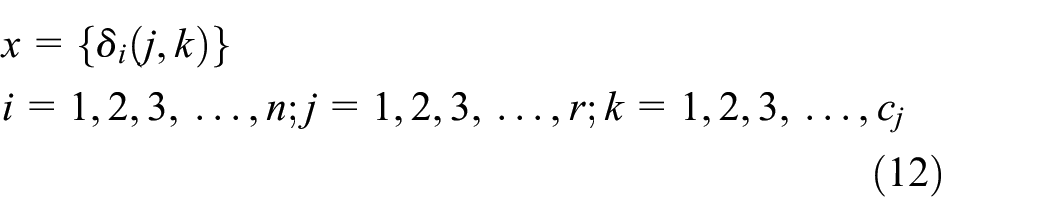
Assuming a linear relationship between the abstract factor evaluation values (y) and the qualitative variables (the original level, x), then a linear model can be obtained as

where
In QT-1, the model prediction accuracy can be estimated using the R-multiple correlation coefficient (MCC), and n is the quantity of the samples
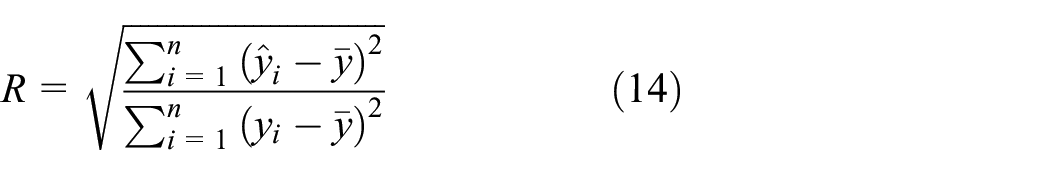
Moreover, this model also uses the determination coefficient (R2) in QT-1, representing its prediction accuracy. The closer R2 is to 1, the higher the accuracy of the relevant model will be. A determination coefficient (R2) of the calculation model should exceed 0.5 (R2 > 0.5), which means that the result of QT-1 is acceptable. 45
In this study, QT-1 was used to analyse the results and verify the weighted relationships among the three levels of attractive factors. This facilitated the understanding of the multiple regression values of the CSR.
Results
Hierarchical diagram of the EGM
Through analysis and comparison of data recorded from the expert group, similar abstract words and feature components are combined using the KJ method. A hierarchical diagram is constructed (Figure 6 shows part of the entire map) based on data records to describe the intrinsic relationships shared by all three levels. The numbers on the right-hand side indicate the number of times that similar opinions were mentioned while neglecting those with less than two mentions.

A hierarchical diagram of the customer service robot (CSR).
Upper level
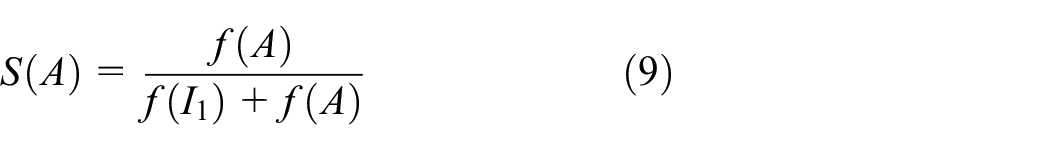
Statistical data were imported into MATLAB for calculations. First, the average of all interviewees’ triangular fuzzy standard values was calculated. The results are summarized in Table 5. The calculation results of the upper level are summarized in Table 6. The third column lists the importance degrees of the triangular fuzzy values, and the fourth column lists the importance degrees of the logic values, which are identical to the performance data. It may be inferred that most interviewees regarded the abstract factors listed by the expert group as certainly important. However, the overall satisfaction was 0.421, which is a lower value and indicates that there still is a lot of space for improvement with regard to product style. According to the two columns of logical values, a scatter quadrant diagram (Figure 7) was generated using SPSS. With the distribution of each factor in the map, the quadrant numbers were gathered and are listed in Table 6.
Triangular fuzzy value of IPA evaluation.
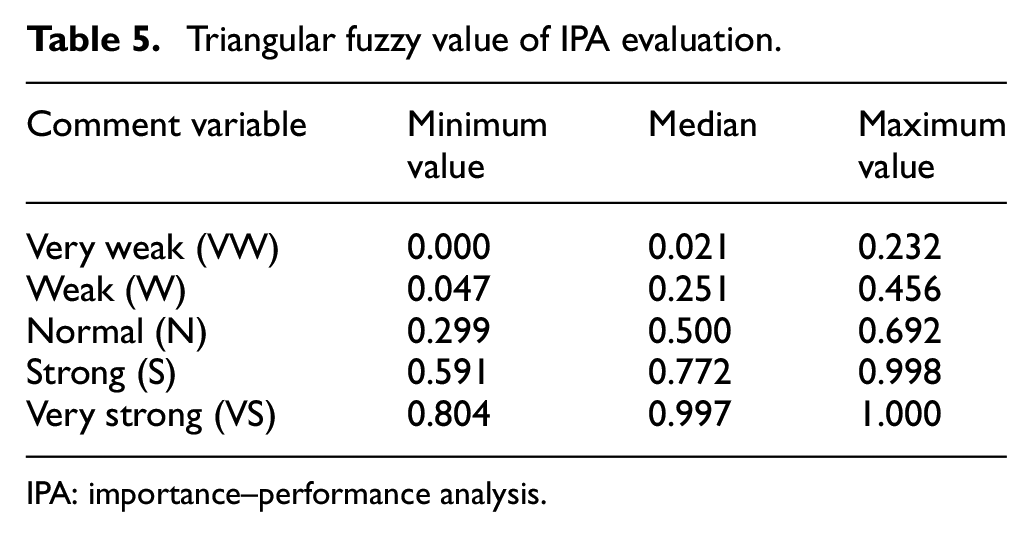
IPA: importance–performance analysis.
IFKM-FIPA analysis of the upper level.


FIPA map of the upper level.
MATLAB was adopted to program IFKM and import various factors associated with the statistical results of the IFKM questionnaire. The IFKM approximation classification of the various types of data was calculated and generated for classification and sorting (M > O > A > I). Finally, according to the sorting shown in Table 4, both order and two-weighted order, related to the priority of improvement and maintenance, were ranked.
The sorting order reflects factors that require urgent attention for improvement as well as factors of advantages that require maintenance. To perform multiple regression analysis of advantages to further explore specific features, a significantly higher advantage vocabulary (Safe, Convenient, Concise and Reliable) must be utilized for the next-stage analysis.
Original level
The logical values of the original level from the defuzzification are summarized in Table 7 and the data were imported into MATLAB. Both general and separate scatter quadrant diagrams (Figure 8) were calculated and generated and the quadrant numbers in Table 7 were collected. The quadrant number may be obtained if sorting by all features is performed simultaneously. Because of the differences in the type of factors, the appearance factors may appear focused in the second quadrant. Therefore, the factors must be evaluated by type. The value (I (0.756), P (0.499)) indicates that an urgent improvement of specific product features is needed. By sorting factors of the original level, the research acquired a highly comprehensive evaluation of factors, which reflects the urgent need for promotion related to product advantages. Moreover, top-ranking features must be utilized as candidates for next-stage analysis (in QT-1, the number of factors for analysis is limited by the number of samples).
IFKM-FIPA analysis of the original level.
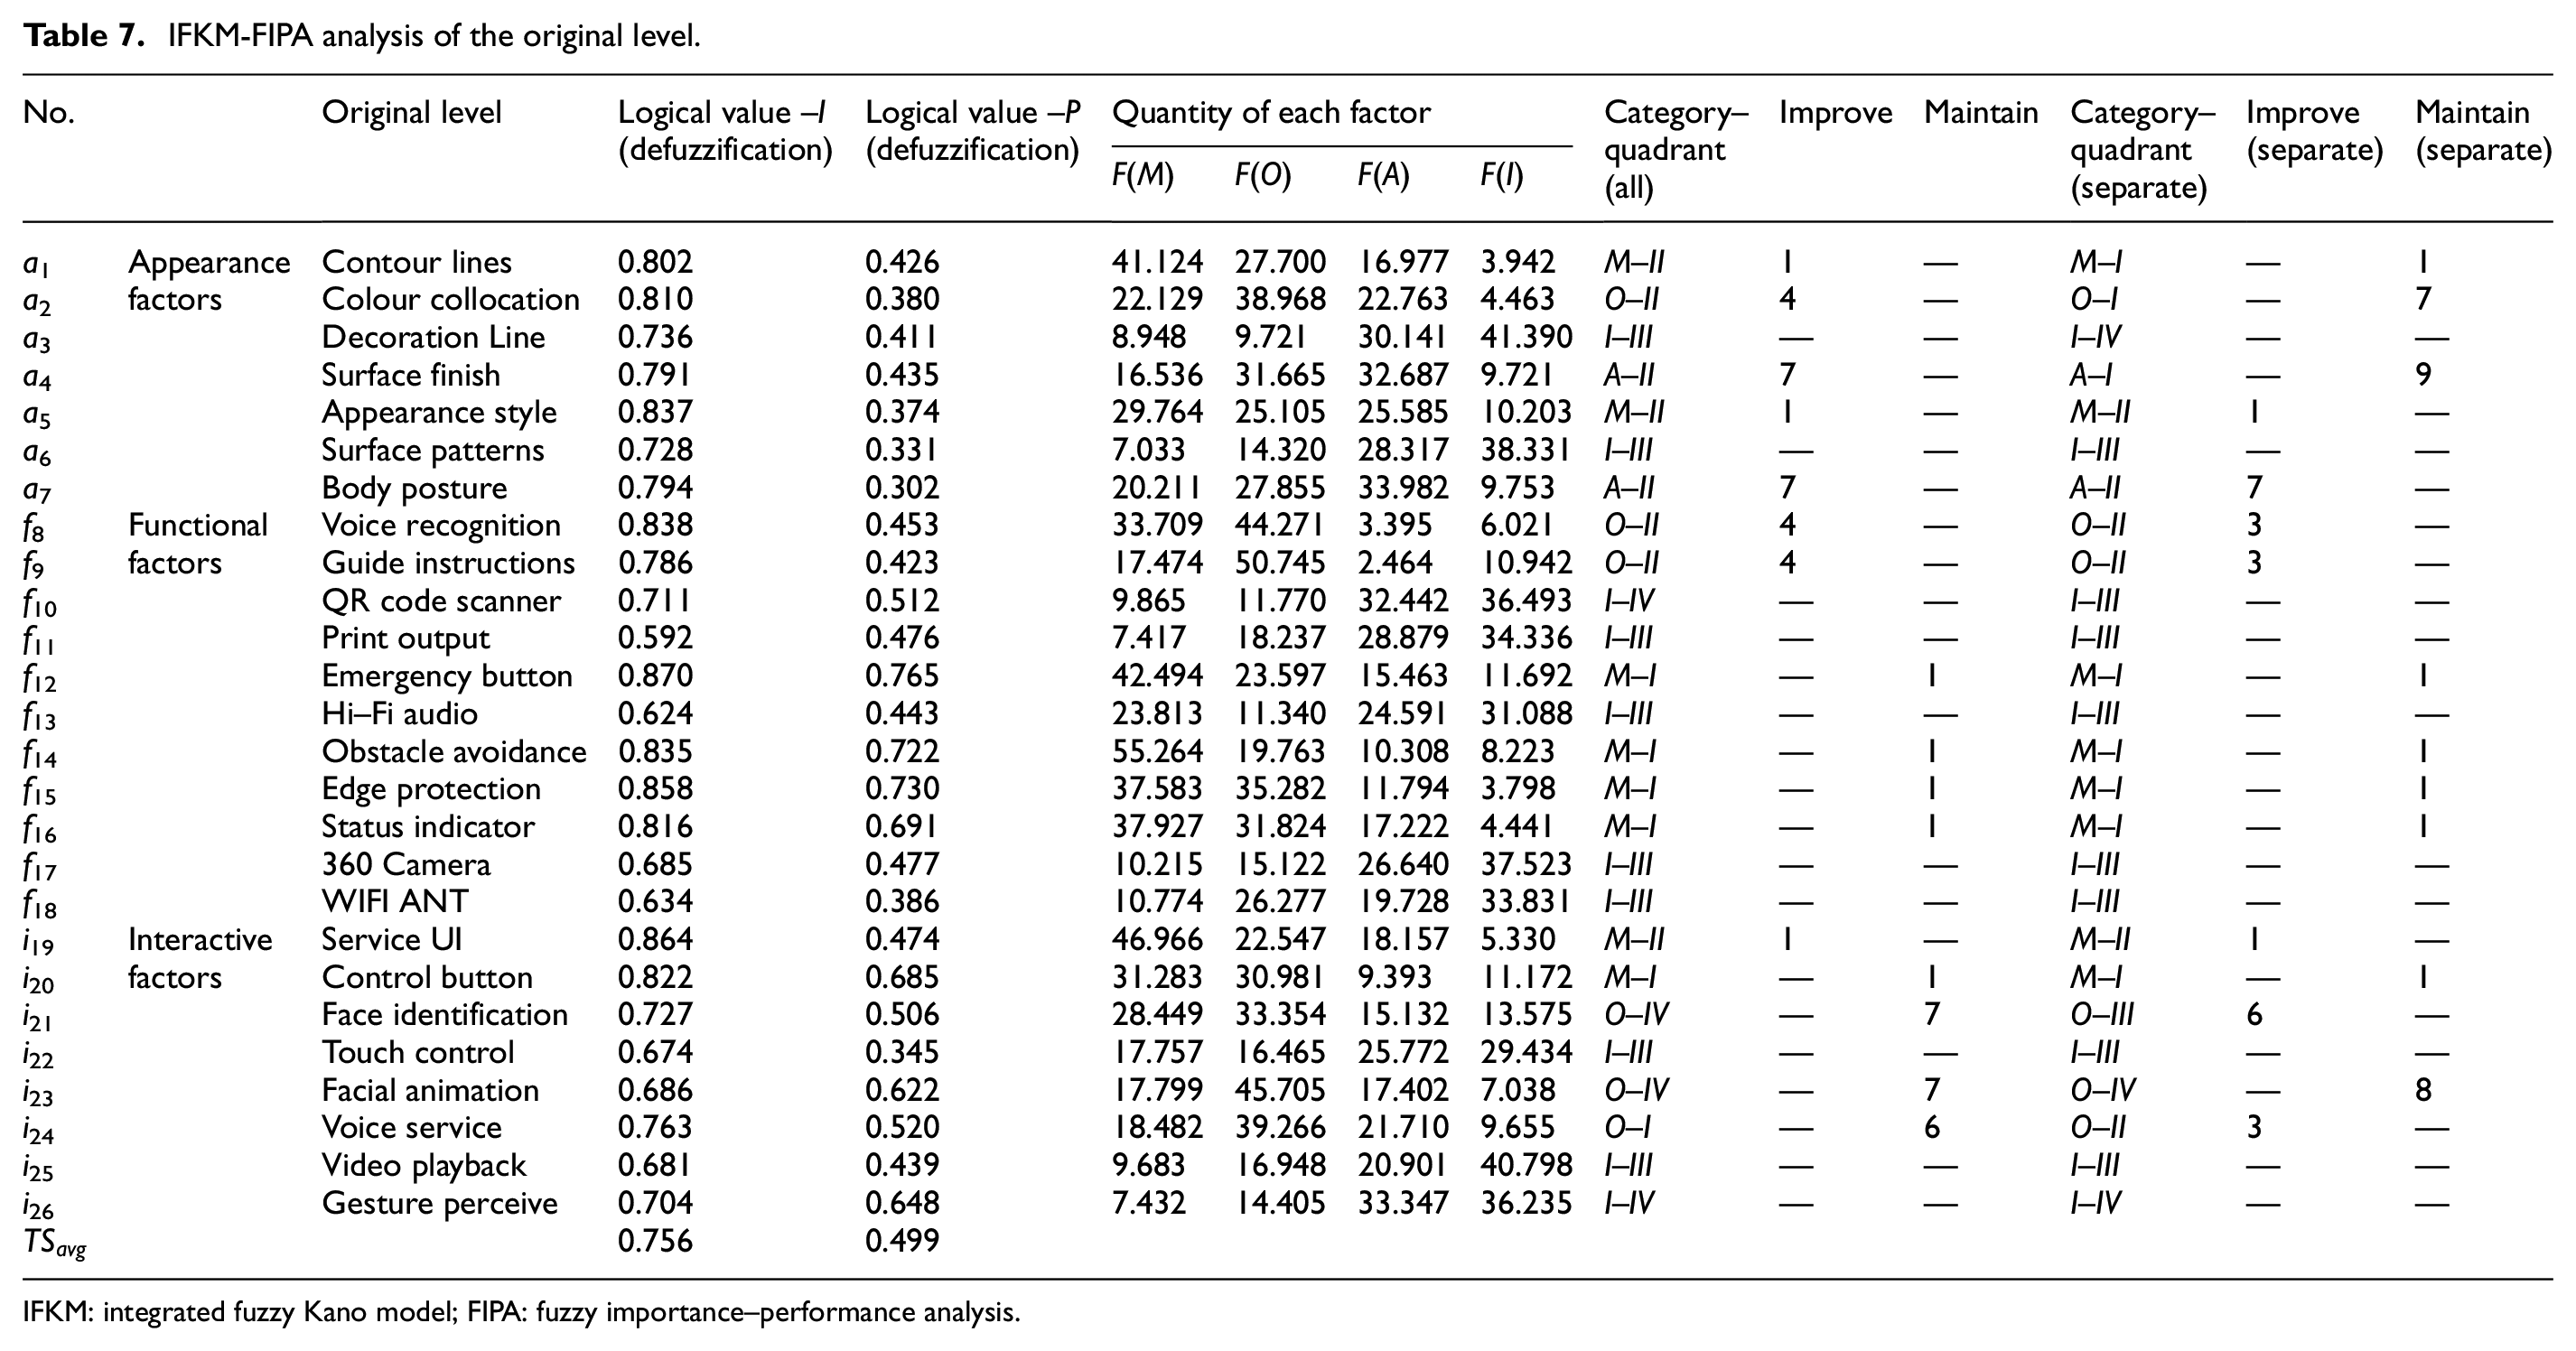
IFKM: integrated fuzzy Kano model; FIPA: fuzzy importance–performance analysis.

The FIPA map of the original level: (a) all factors, (b) appearance factors, (c) functional factors and (d) interactive factors.
Results calculated through QT-1
The expert group was asked to grade samples containing four abstract words by preference. Each interviewee was permitted to assign scores according to the degree of the sample, using a five-category Likert-type Scale (Table 8), with ‘strongly agree (SA), agree (A), undecided (U), disagree (D) or strongly disagree (SD)’, on behalf of the five types of strength and corresponding scores of 5, 4, 3, 2 and 1, respectively. The final scores were obtained after weighing the average score of the samples. For each abstract word correlating to the attractive factors, QT-1 was applied and the three categorical factors (appearance, functional and interactive) were integrated into the independent variables. This illustrated the relationship between the corresponding reaction (qualitative projects) with 0 and 1, where remark 1 indicated with feature factors (the lower level) and remark 0 indicated without feature factors. Table 9 shows the list of interviewee scores for describing the abstract images of the samples. All other factors (aside from the described and insignificant categories) were added to each final category of factors. All statistical results were encoded into the matrix and the QT-1 visual basic application program was employed for calculations. The last category consists of indistinct and unclear factors and was therefore automatically ignored. The results are summarized in Table 10.
Likert-type scale of the upper level.

SD: strongly disagree; D: disagree; U: undecided; A: agree; SA: strongly agree.
Statistics table of QT-1.

Comparison with the QT-1 scores.
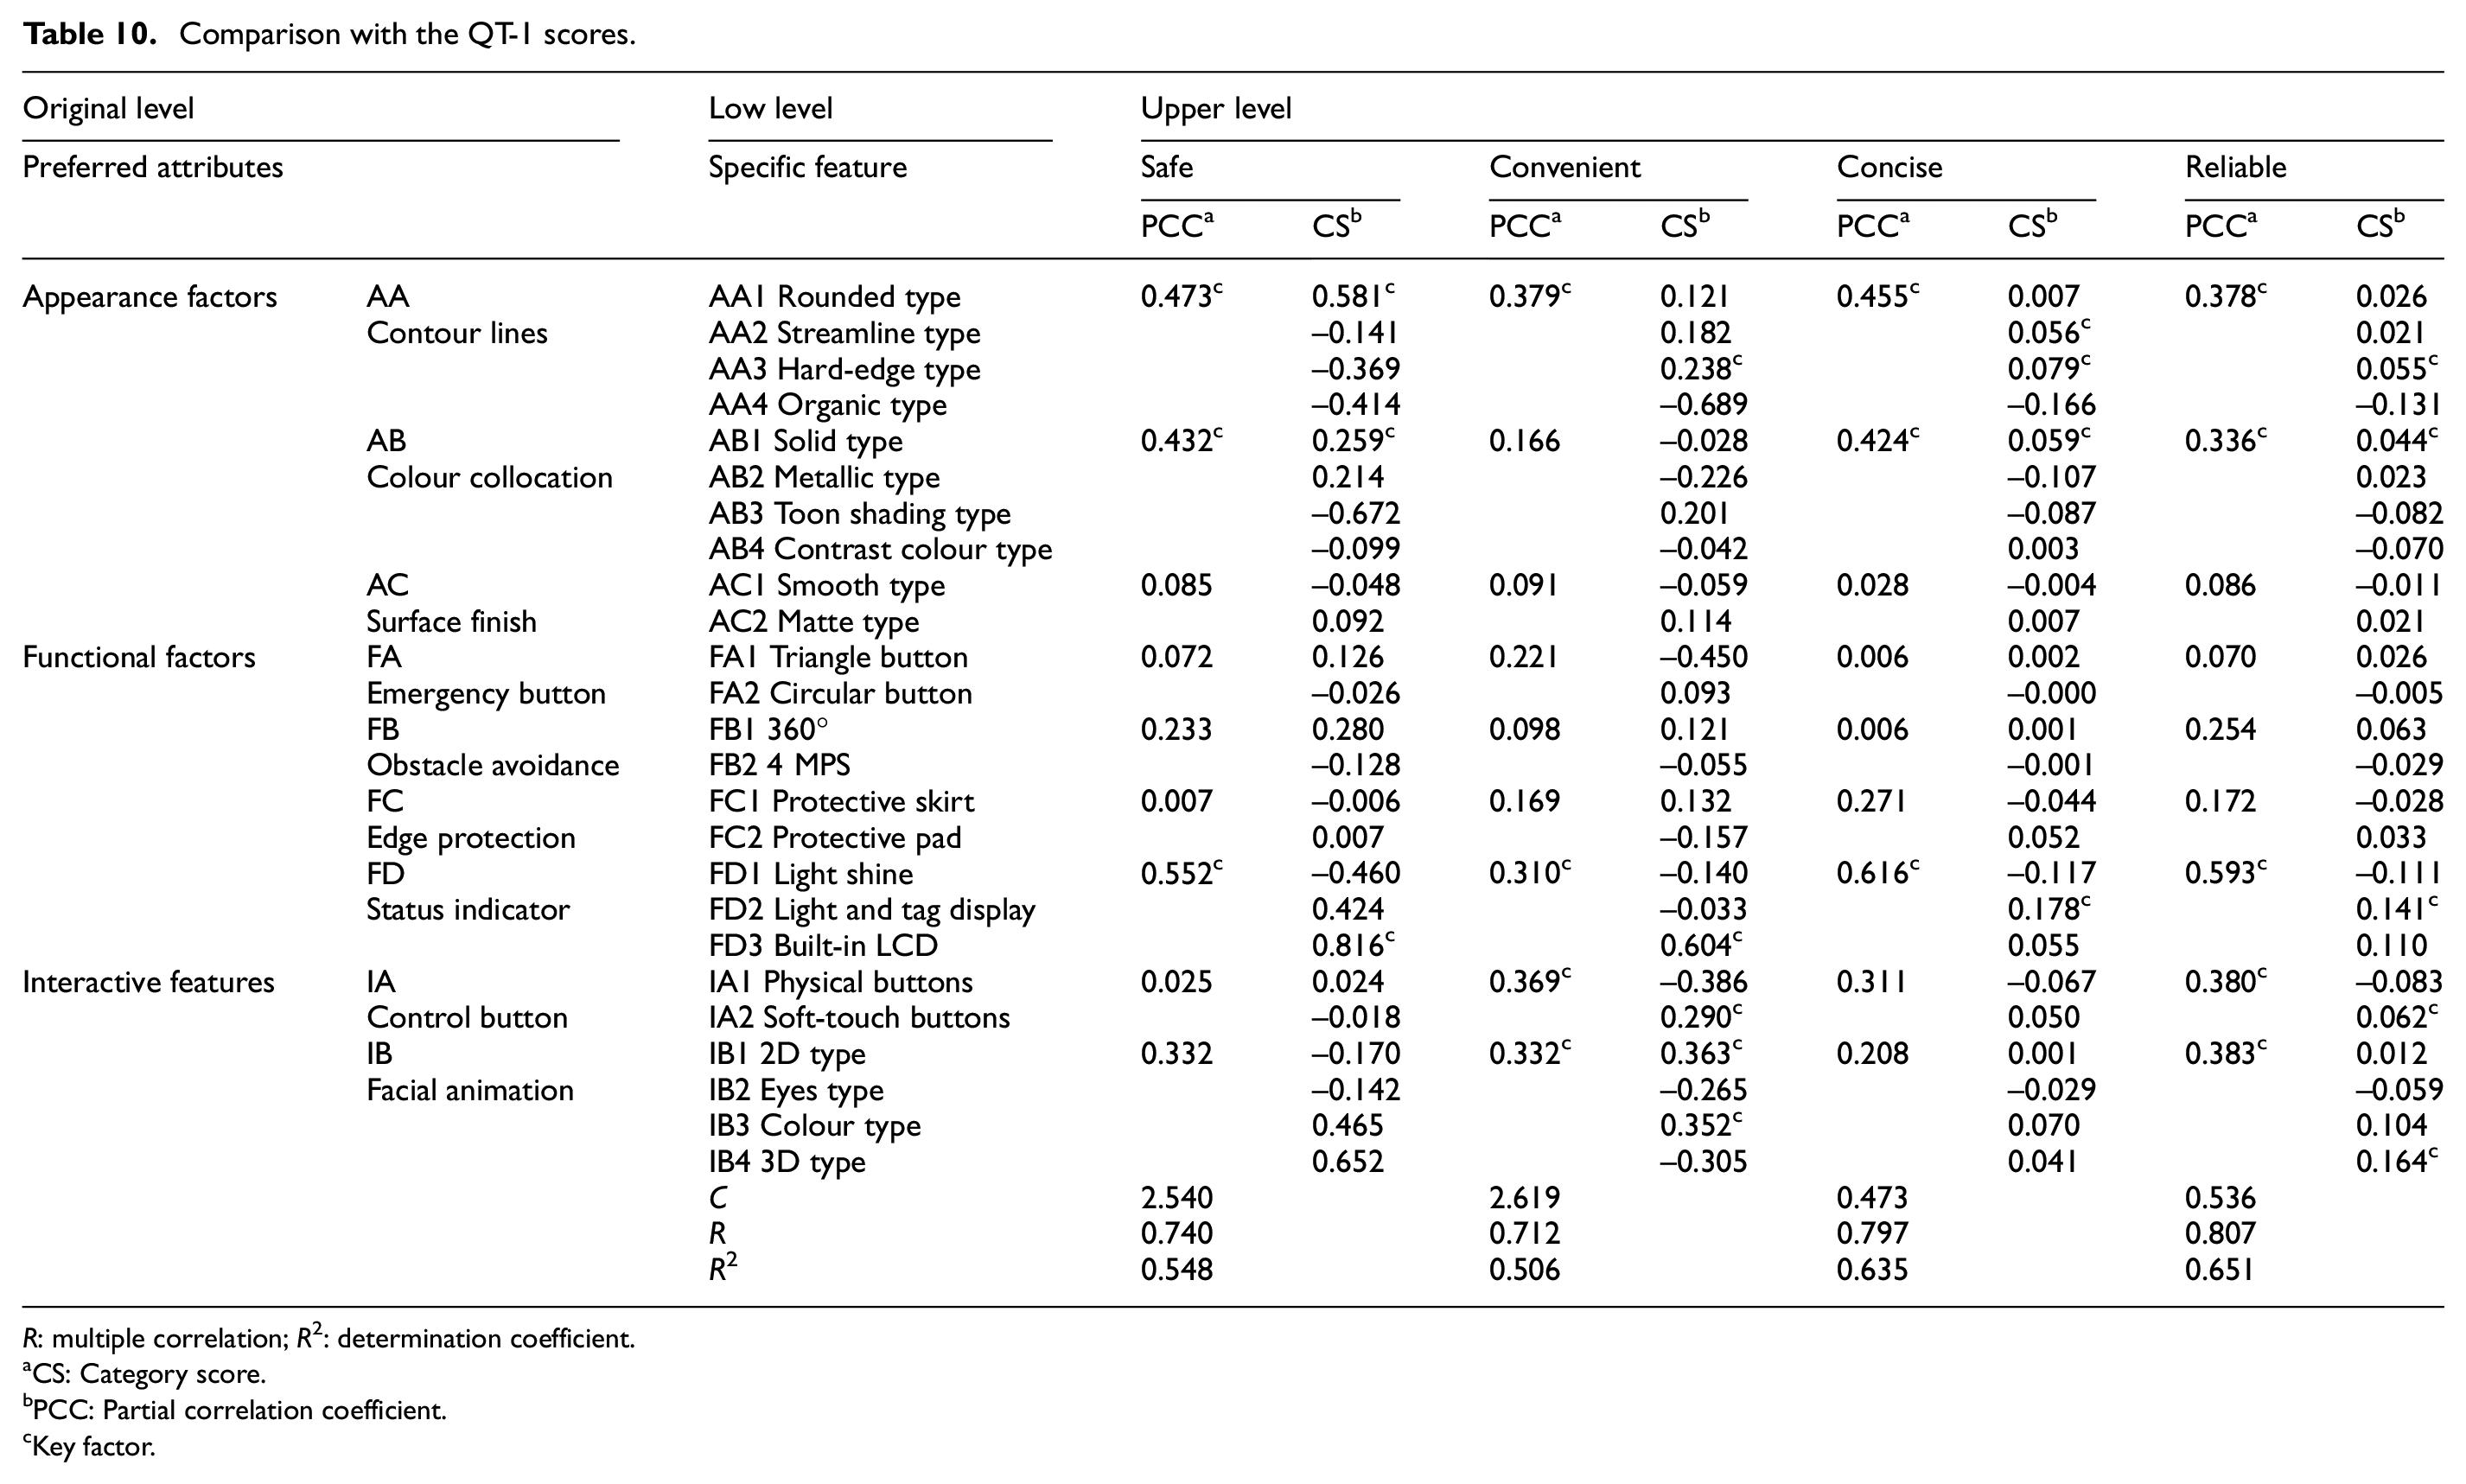
R: multiple correlation; R2: determination coefficient.
CS: Category score.
PCC: Partial correlation coefficient.
Key factor.
Discussion
During the early stages of product planning and design, manufacturers and product designers have to clarify the relationship between abstract factors and product feature factors. Particular emphasis is given to the rational and efficient configuration problem, involving various properties and the reasonable allocation of design and development resources according to actual scenarios. Therefore, higher attention has been focused on filtering methods of the abstract factors of products, 46 which has always been a hot topic in research because of rationality and significance.
As shown in Table 6, the logical value of importance of the feature ‘smart’ is 0.842, which ranks high among all factors. However, after analysis with IFKM-FIPA, the logical value of performance (satisfaction) of the feature ‘smart’ is 0.402, it ranks second of all the factors that need to be improved. The AHP method is known as the adopted paired comparisons of abstract words to determine satisfaction.9,47 Compared with the results obtained using this method, IFKM-FIPA provided clear guidance for designers on whether or not to improve or maintain such factors. This means that in comparison with the single-dimension comparison method of AHP, IFKM-FIPA analyses the upper level factors of EGM from multiple dimensions. This assigns greater significance to semantics, which does not possess high-performance (satisfaction) values but has actual importance and relatively high satisfaction concerning the product features. IFKM-FIPA renders the featured evaluation of diverse attractive factors more intuitive and available.
As indicated in Tables 6 and 7, according to the results of IFKM ranking, the distinction between the Kano qualities is very significant. Some factors provide numerical approximations, which are difficult to classify, and in the previous Kano analysis result, 9 approximations between the Kano qualities occur frequently. IFKM analysis avoids this problem.
According to the traditional Kano model, 20 Table 7 shows that the ‘appearance style’ belongs to M quality, which means the factor must satisfy the user. The current level of satisfaction is unknown and the result of M quality cannot provide a clear suggestion to generate a design decision. However, the IFKM-FIPA analysis result is M-II, which ranks first among all the improved factors. The same phenomenon occurs in O and A (the underlined items in Table 7). In comparison with the rank results from the previous Kano analysis,8,9 improved EGM with IFKM-FIPA divides in-depth the features that urgently require improvement as well as the beneficial factors for design reference. IFKM-FIPA directly yields design recommendations for attractive factors. Therefore, designers and developers can make clear and substantial decisions related to product positioning and the competitive advantages of using these ranking results as reference. Furthermore, cost reduction in several unnecessary factors (such as features correlating to I quality) may also be considered.
Attitudes towards CSR products from interviewees may also be explored from IFKM-FIPA analysis results. For instance, as an important product feature, reliability is the most important feature appreciated by users in the product development process. From the satisfaction evaluation (AHP) 9 aspect, low-performance factors need to be improved. However, the logical value of performance of the feature ‘reliable’ is 0.437. The factor only needs to be maintained rather than improved. This is because the CSR is always maintained by the service provider, the correlation between users and reliable products is weak. Therefore, although it was identified as an important feature by the expert survey group, it was not an M quality factor with regard to user opinion. Thus, maintaining the property was continued. So, with previous Kano method,8,9 which emphasized subjective qualitative quality, these product feature details were difficult to reveal.
In the original level analysis, the study divided the factors into different quadrants according to factor types (appearance, functional and interactive factors). Different factor types have essential differences in terms of user preference, and these differences frequently influence features of the same type. For example, interviewees who preferred practical function may believe that functional factors are more important than appearance factors. However, interviewees who prefer aesthetics believe the opposite. Thus, to obtain a more accurate understanding of product features, researchers need to conduct the same type factors through sorting quadrant divisions.
Key factors of the QT-1 calculation analysis are sorted through IFKM-FIPA, which are also utilized for verifying the sorting mechanism of IFKM-FIPA for attractiveness factors. The advantages of strong correlations among similar products in the market may be identified from the key factors in Table 10. Designers can refer to the key factors to improve the strongly related styles of the product ideas, which is the main function of the results from the QT-1. In determining the coefficient R2, when R2 > 0.5, the results are more reliable. 45 The results from the calculation indicate a high correlation between the sorted upper factors and the original factors from IFKM-FIPA that have a strong correlation. Compared with the previous study on the IPA–Kano model, 33 the result of the QT-1 method has a more significant analysis level. Continued analysis of the results indicates that although contour lines and colour collocation of the appearance factors have a low ranking with regard to overall satisfaction, a strong correlation exists with regard to product style building. This is also a visual feature, which is more likely observed by interviewees. Thus, more attention must be assigned to this feature during the design progress. In addition to the positive influence of key factors, focus must also be assigned to the reverse effect. For instance, for the key factor of ‘colour collocation’, the value of the ‘toon shading type’ is −0.672, indicating that the interviewees believe that this colour style does not provide a person with a feeling of safety or reliability. Therefore, if the designers want to reinforce a sense of safety or reliability in the design sketch, these design factors need to be carefully limited.
Conclusion
This study investigated a case of CSR, which is a creative product that provides intelligent service in future urban cities. Most interviewees expressed a keen interest in these types of products. It also presents researchers with more confidence that positive feedback from interviewees may lead to the aspired research objectives.
A hybrid method was presented that incorporates the hierarchical diagram analysis of EGM, two-dimensional analysis of FIPA and refined multidimensional analysis of IFKM rough sets for new product development during the early design stage. By integrating a series of methods, this methodology improves the product design process and achieves a more reliable solution.
First, while the EGM can identify the key factors in new product development by accurately transferring customers’ preference into design features, it fails to provide quantitative analysis to subtly distinguish attractive factors. Regarding AHP, although it is designed towards decision problems during the evaluation stage of product features, it fails to identify the abstract features from additional aspects. The Kano model is a qualitative analysis method, and its classification standard is relatively subjective, while FIPA can effectively solve the problem of single-dimensional analysis of abstract factors.
The highlight of this article is that it proposes the integration of EGM, IFKM and FIPA, thus embodying the complementation of multiple disciplines. The case study indicates that both FIPA and IFKM optimize the EGM for a diversified product feature analysis, which can assist researchers to better understand product features from different dimensions and establish clear design objectives between manufacturer and customer expectations.
This article can help product designers to produce more accurate analyses of consumer needs while increasing customer satisfaction through the product design process. Ultimately, this enables developers and designers to have a precise understanding of the design style and conceive new ideas.
There are still some limitations in this article. For example, the interview method of the EGM is still a relatively cumbersome and technical process. It is difficult to describe the attractive factors from the samples for ordinary interviewees. Current research methods are still limited to using a questionnaire, and statistical data are influenced by subjective factors. The samples are mainly based on those which have appeared in the market and the results are also limited to known product features, thus making it difficult to analyse unknown innovation factors.
Future research will focus on moving from the existing method to integrating physiological signal experiment analysis and the evaluation procedure into a computer-assisted design support system for new product ideas. Furthermore, several more convenient and reliable customer survey methods need to be developed and applied to the EGM in the future.
Footnotes
Handling Editor: Wei-Chiang Hong
Data availability
The data used to support the findings of this study are available from the corresponding author upon request.
Declaration of conflicting interests
The author(s) declared no potential conflicts of interest with respect to the research, authorship, and/or publication of this article.
Funding
The author(s) disclosed receipt of the following financial support for the research, authorship, and/or publication of this article: This study was financially supported from the Shanghai Municipal Education Commission-Shanghai Summit Discipline-IV in Design under contract number DC17013.