
Abstract
In the research of industrial robot design, designing using only the perceptual thinking and creativity of an industrial designer or overemphasizing the intervention of quantitative data research in the field of emotional cognition is relatively one sided. In this article, research on how to combine the above two aspects effectively will be conducted. The aim is to present a design method which provides artistic creativity and scientific support for industrial robot design. Therefore, a method for representing perceptual image spaces of industrial robots through pictures and semantics by evaluating the perceptual images and using statistical approaches such as factor analysis will be proposed. Perceptual design elements of industrial robots are decomposed from the perspective of style and color. After the quantitative type I analysis, the numerical relationships between the semantics of images and design elements are identified. Also, a method for mapping relationships between the perceptual image spaces and design elements of industrial robots is developed. After three-dimensional modeling and simulation, the semantic difference methods are used in combination with the emotional evaluation and measurement methods for physiological experiments such as eye tracking, skin conductance, heart rate, and electroencephalography experiments with the aid of virtual reality. Finally, a perceptual design method is extracted for smart industrial robots based on virtual reality and synchronous quantitative physiological signals.
Introduction
In Asia, especially in Japan, the concept of “Kansei engineering” has been put forward for a long time. In both Japan and Korea, the “societies of Kansei engineering” have been established. European and American scholars summarize that these studies are about the “design and emotion.” 1 Pertinent theories include Kansei engineering theories developed by Japanese scholars and three-hierarchy theory brought forth by an American scholar, Donald Arthur Norman. 2 Researchers and scholars have proposed many product design methods or techniques about various product designs based on Kansei engineering. For instance, H Akira 3 presented a parallel design method, and Asano 4 introduced a new technique for visualizing users’ cognitive structures. M Kajtaz et al. 5 proposed a personalized product design method for identifying and quantifying subjective customer demands effectively. T Djatna et al. 6 presented a method for designing aromatherapy products of Bali Island based on Kansei engineering to satisfy personalized needs. A Shergian and T Immawan 7 introduced a creative design method for bamboo clocks on the basis of Kansei engineering. IP Tama et al. 8 proposed a customer-oriented design method combining Kansei engineering with the Kano model. Abundant outcomes have been achieved in research about the application of Kansei engineering in various designs and evaluations. For instance, Nagamachi, 9 J Vieira et al., 10 and A Horiguchi and T Suetomi 11 applied Kansei engineering in evaluating automotive designs. Hsiao and Tsai 12 studied the color combinations and images of baby walkers in depth. Tsai et al. 13 evaluated the color combinations and images of electronic locks using fuzzy neural networks and gray theory. Tsutsumi and Sasaki 14 performed a perceptual evaluation via a questionnaire survey on neural networks. S Chanyachatchawan et al. 15 put forward a perceptual data modeling method based on verbal expressions and applied it to the user-centered product evaluations effectively.
Norman 16 introduced a theory with respect to the “instincts, behaviors and reflections.” Desmet et al., 17 who defined the “product emotions,” created the Emocards and PrEmo for measuring the product emotions. 18 KM Prkachin et al. 19 presented a method for analyzing discrete emotions. B Park et al., 20 with some other researchers, examined the issues about emotional designs and positive emotions. In order to study the emotional product designs, M Kukhta and Y Pelevin 21 investigated the mechanism through which perceptual and emotional responses were generated in shapes of design objects, and where a model was put forward for perceiving visual images. W Lu and JF Petiot 22 brought forth an emotional product design method based on user cognition and emotions. J Jiao et al. 23 established a perceptual system for emotional design. Y Huang et al. 24 presented a method for developing new products according to the relationships between consumer emotional demands and products. H Jiang et al. 25 introduced a modeling method for customer satisfaction with emotional product designs based on rough sets and particle swarm optimization methods. Rieuf et al. 26 studied the emotional participation in design tasks of early creative sketches in the industrial design process. Mata et al. 27 put forward a perceptual design method based on parametric modeling. The mentioned research findings offer theoretical foundations and technical support for examining the emotional designs and emotional measurements.
The aforementioned literature suggests that Kansei engineering discusses relationships between people perception and object design characteristics. Emotional designs mainly study emotional experiences from the perspective of psychology. With the improvement of human social life and the advancement of technologies, modern product design ideas based on “user experiences” or “emotions” have been gradually improved. 28 Namely, emotional measurements are crucial premises for innovative emotional product designs. 29 At present, these measurements are mainly performed in terms of physiology and psychology. 30 With the continuous advancement of information technologies, three-dimensional (3D) modeling, virtual reality (VR), and Internet-based investigation techniques have been extensively employed. The industrial robots are mechanical products. Therefore, related studies have been mostly focused on “material”“technologies” and “properties,” so the integration of emotional design ideas into product designs has become inevitable. This article is aimed to explore a design method for making the industrial robot designs artistically creative and scientific and to coordinate the emotion physiological signal acquisition method and emotional, psychological reaction measurement method. A perceptual design method for smart industrial robots based on VR and synchronous quantitative physiological signals is extracted. In this article, research on how to combine the above two aspects effectively will be conducted. The aim is to present a design method which provides artistic creativity and scientific support for industrial robots design.
Research on methods for constructing perceptual image spaces for industrial robots
Expression of perceptual image spaces for industrial robots based on pictures
Five hundred three pictures of industrial robots were extensively collected. Five professional design teachers and postgraduates were asked to compare these pictures concerning their similarities and typical features, in order to eliminate pictures which were highly identical and not quite typical. After selection, 127 typical pictures of industrial robots containing 1 to 3 perspectives and being of varying size were retained. An eye tracking experiment was performed to determine the angles of view suitable for observing the products in subsequent studies and eliminate other interference factors. Based on the results of the eye tracking experiment, further discussions were performed with the experts. Finally, the left side was confirmed as the angle of view. One hundred twenty-seven typical pictures of industrial robots were categorized and selected. In the end, 40 pictures of industrial robots remained and were numbered from 1 to 40 as experimental samples. Thirty subjects were invited to take part in the sample grouping experiment, and the tree diagram of the sample clusters suggested that it was the most suitable to group the samples into eight clusters. The distance between each sample and the center of gravity of its cluster was determined by the k-means clustering. Next, the sample was allocated to the nearest cluster based on the results to recalculate the center of gravity between the new cluster and the original one. The distance between each sample and the center of gravity of its cluster was calculated by k-mean. The sample that was the closest to the center of gravity was selected as the representative sample of the cluster. The representative samples were ultimately chosen for all the eight clusters, as shown in Figure 1.

Finalized representative industrial robot samples.
Semantics-based expression of perceptual image spaces for industrial robots
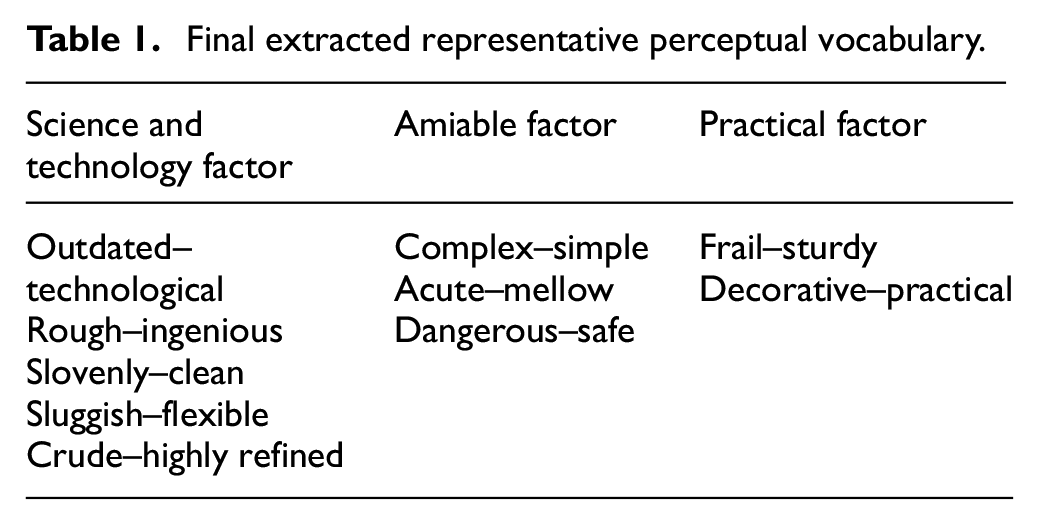
During the research, 116 pairs of perceptual vocabularies of industrial robots were collected. After the primary screening, 60 pairs of perceptual vocabularies were identified and then further selected by the experts. Finally, 36 pairs of perceptual vocabularies which reflected the respondents’ cognition better were clarified. The final 36 pairs of vocabularies were combined with 8 representative samples of industrial robots to evaluate the semantic meanings of the perceptual images. A factor analysis was conducted using the SPSS and other statistical analysis software in line with the experimental results. The mean matrix for the semantical evaluation of representative samples was imported into SPSS22.0, and the analysis-dimension reduction-factor analysis was necessarily set for analysis. Then, the output results were analyzed. According to the explained variance, the ratio of the contribution of the three factors is 47.162%:27.952%:22.653%, approximately 5:3:2. Finally, a corresponding number of representative semantic image factors were separately extracted from each factor proportionally without changing the proportion of their explained variance. When 10 clusters of semantic image factors were extracted, 5, 3, and 2 clusters of the factors were, respectively, extracted for three major factors; namely, the first five clusters of factor 1, the first three clusters of factor 2, and the first two clusters of factor 3 were selected for the factor extraction to get representative perceptual vocabularies, as shown in Table 1.
Final extracted representative perceptual vocabulary.
Research on methods for mapping relationships between perceptual image spaces and design elements of industrial robots
Decomposing perceptual design elements of industrial robots
Previous studies rarely mentioned the decomposition of design elements of industrial robots. This article attempts to decompose the perceptual design elements of industrial robots, making valuable explorations from the perspective of style and colors. Design elements of industrial robots are decomposed according to their fundamental structural features, mainly including 9 major items (flanges at both ends, wrists, small arms, elbow joints, big arms, waist, base, body, and tracing methods) and 25 categories. Previous studies on the perceptual design elements mostly focused on the design elements of product styles, but rarely considered the color design elements, mainly because colors are too sensitive, so studies on the color combination will be extremely complicated. Industrial robots, like industrial machines, are simpler in color application and match. Therefore, this article attempts to classify color design elements into two major items (dominant and supporting colors of industrial robots) and 12 categories.
J. Dominant colors of the main body: these dominant colors are mainly “J1 yellow,”“J2 white,”“J3 red,”“J4 blue,”“J5 gray,” and “J6 green.”
K. Supporting colors of the main body: on local parts and the main body, supporting colors are primarily “K1 black-yellow,”“K2 black-red,”“K3 black-blue,”“K4 gray-white,”“K5 orange-white,” and “K6 blue-white.”
In particular, 11 major items and 37 categories are identified after the design elements of an entire industrial robot are identified.
Experiment of semantic evaluation of ultimate perceptual images
According to the items and categories identified by decomposing Kansei design components of industrial robots, at least 27 industrial robots were selected at this experimental stage to satisfy the experimental requirements for semantic evaluation of final perceptual images. Therefore, apart from choosing 8 industrial robots as representative samples, another 19 samples were further selected from 8 categories and the original 40 industrial robots. Finally, 27 industrial robots were chosen as product samples. A questionnaire survey on semantic differences in new seven-order images was designed based on 27 sampled industrial robots and 10 representative perceptual image vocabulary pairs selected through the cluster analysis. To be specific, an experimental questionnaire for evaluating the relationships between the semantic meanings of image semantics and design elements of industrial robots were used. The pictures were successively presented to the respondents on the computer screens. During the presentation, the respondents were required to appropriately score images of 27 industrial robots evaluated by 10 pairs of perceptual vocabularies. The questionnaire survey results were sorted out, and the mean values of semantic vocabularies of images were determined as the samples, thus calculating the values for evaluating the semantic feelings about the sampled industrial robots.
Mapped relationships between perceptual image spaces and design elements
Definitions of all the items and categories were clearly represented on the breakdown chart of the perceptual design elements. Eleven style and color features were numbered from A to K, such that the types were denoted by Arabic numbers (1, 2, 3, and 4). Finally, the design elements were coded through the analysis, as shown in Table 2. In this work, the quantitative type I analysis was performed on forming methods inclined to images to determine the quantitative relationships between each group of image semantics and design elements. The “Backward-technological” denoted a pair of opposite adjectives, which corresponded to the design elements of the industrial robots granted the highest and the lowest scores. Besides, they were summarized to clarify the quantitative relationships between the image semantics and design elements, so as to determine the design rules for industrial robots with different preferred images. To endow industrial robots with scientific and technological images, designers tend to design the robots as follows. Styles of flanges at ends, without significant impacts, are cylindrical, and wrists are wrapped by arms; small arms are chunky, and elbow joints are connected by fusing small arms with the upper arms; the upper arms are slim and long; waist is a combination of square and round shapes; the base is a combination, and the body is slim; the tracking is exposed, and blue is the most suitable dominant color. Although the combination of black and yellow, as a dominant color, was granted the same score as the combination of black and blue, it was the most appropriate to match black with blue in a combination of the dominant color.
Industrial robot design element codes.

Perceptual design method for smart industrial robots based on VR and synchronous quantitative physiological signals
Drafting schemes for industrial robots and key points for implementation
Schematic design of industrial robots under semantic conditions of images
Following the developing rules for design elements of industrial robots summarized in the research mapped relationships between their perceptual image spaces and design elements, and 10 pairs of final extracted representative perceptual vocabularies, a form of schematic design elements can be created with the combination of codes. The particular codes of emotional vocabularies under dual-end conditions are shown in Table 3.
Codes of emotional vocabularies for specific categories under dual-end conditions.
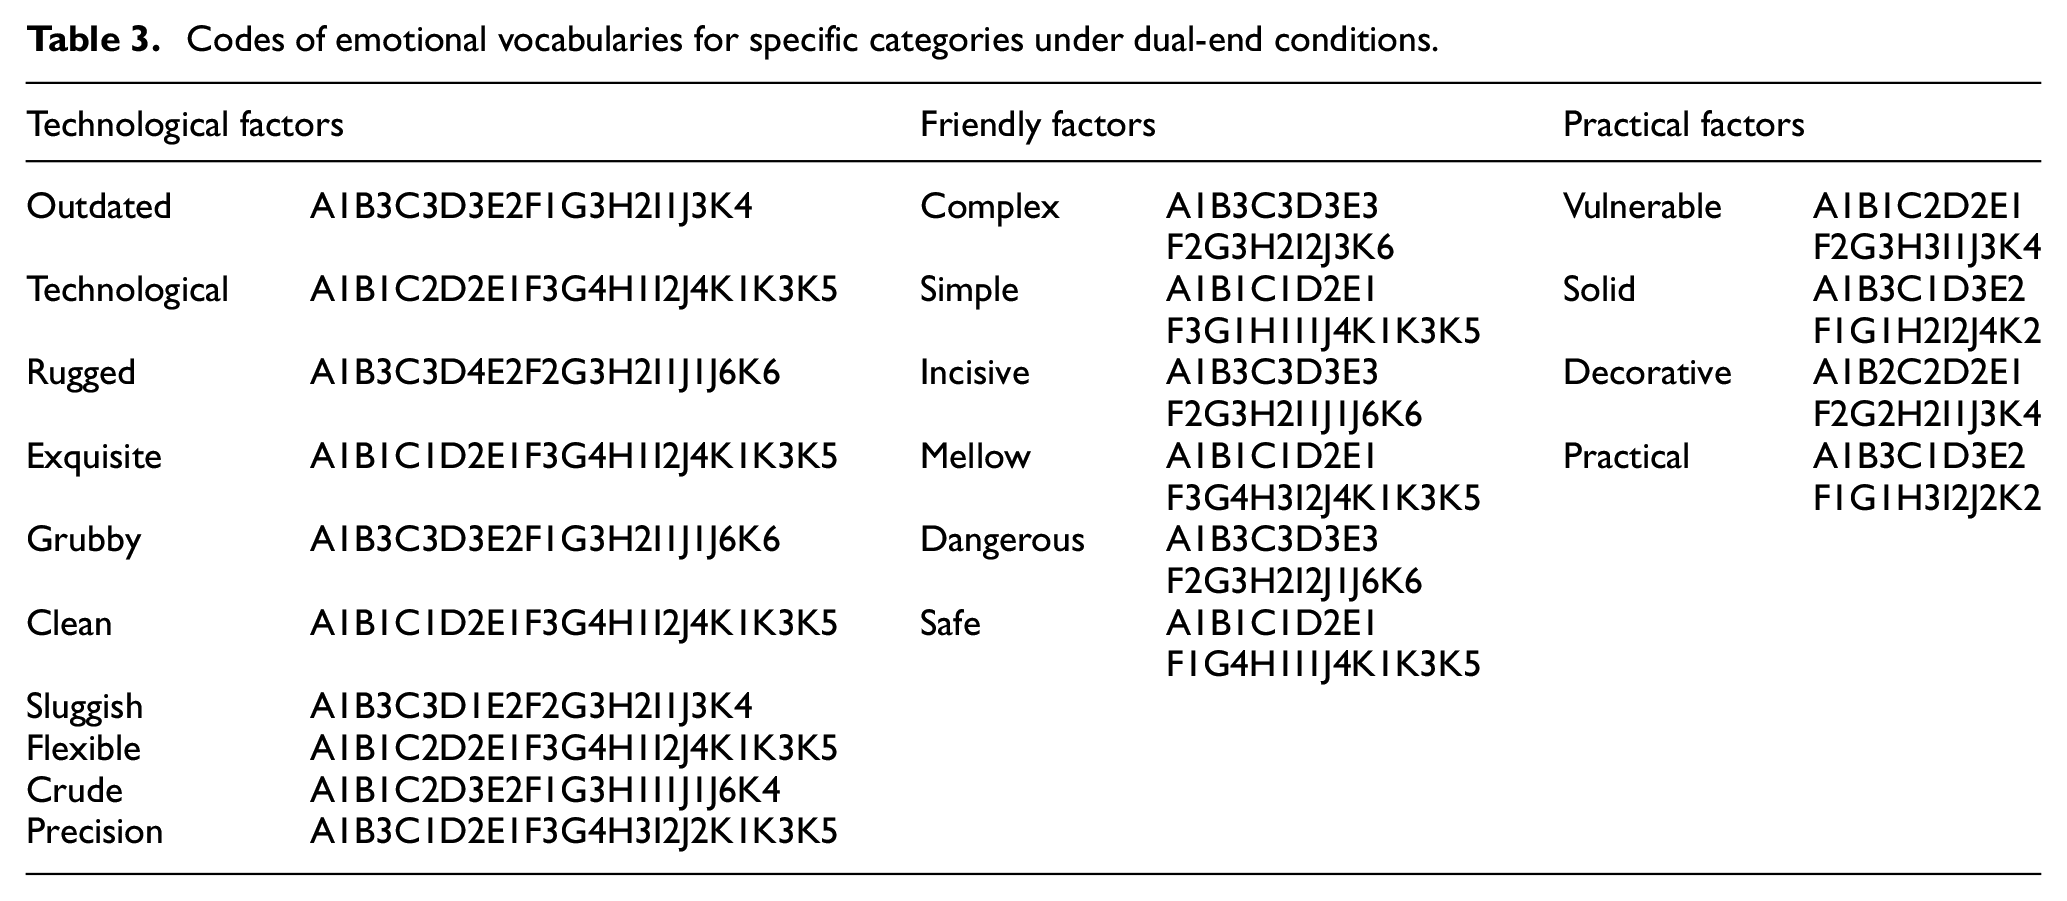
Following the results of earlier semantic factor analysis, a group of semantic image factors with the highest factor load were, respectively, chosen from three major factors, including the technological factor “backward-technological,” the amicable factor “complex-simple,” and the practical factor “fragile-hard.” As per the rules for developing design elements of industrial robots and combinations of codes, the schematic design elements were identified at last. From the form of design elements in the “backward-technological” scheme, it is known that design schemes for industrial robots which are in line with the “technological” image semantics shall show features of design elements shown in that form. In addition, to ensure that design schemes for industrial robots are not “backward,” features of design elements listed in the form shall be not used as far as possible.
In the above studies, the guidelines have been developed for designing schemes for industrial robots under semantic conditions of images. They are positive and negative. However, design schemes shall conform to the features of design elements under semantic conditions of a certain image; on the contrary, the features of design elements under semantic conditions of a certain image shall be avoided in a definite design scheme as far as possible. However, it is still inadvisable to adopt the guidelines as design schemes for industrial robots directly. Instead, designers should develop schemes for industrial robots under semantic conditions of images using their creativity, imagination, and professional competencies.
Key points for schematic design of industrial robots under semantic image conditions—a case of schematic design of collaborative robots with 6 degrees of freedom
Previous design studies have mainly concentrated on shortening the “distance” between the designers and design objects, so designers could examine in depth the design objects and relevant information, including the backgrounds for the existence of design objects, working principles, development status, competitive enterprises, and development trends. In view of limitations on the article length, they are not elaborated in this work. Designs are positioned for the research objects in combination with the previous design studies about collaborative robots with 6 degrees of freedom and in line with the guidelines for schematic design of industrial robots under semantic conditions of images. To position designs, users and products shall be positioned as well. Product positioning is associated with style, color, function, and material positioning. After earlier design research and positioning, designers need to conceive extensively creative ideas through group discussions, brainstorming and divergent thinking following the guidelines for schematic design of industrial robots under semantic conditions of images. The style elements of the industrial robots are extracted pursuant to the users’ Kansei images from three perspectives of user perceptual cognition. 31 In the meantime, many creative ideas are visualized by drawing design sketches by hands. In this article, about 100 design sketches of collaborative robots with 6 degrees of freedom are drawn, and some of them are indicated in Figure 2.

Sketch designs of a 6-DOF cooperative robot drawn by hand.
Design sketches of collaborative robots with 6 degrees of freedom were obtained by conceiving creative ideas in line with the guidelines. The final scheme was confirmed through substantial work, including group discussions, selection, extraction, comparison, and optimization. Next, the 3D modeling, re-rendering, and processing were conducted to finalize the scheme using Rhino or 3DMax to obtain the final schematic design rendering, which is shown in Figure 3.

The final design of a 6-DOF cooperative robot.
Perceptual design methods for smart industrial robots based on VR and synchronous quantitative physiological signals
Experimental design scheme for evaluating synchronous physiological signals based on VR
Hypothesis
This VR experiment is aimed to explore the subjects’ cognitive process in watching the industrial robots, to analyze their observation process of robot images such as styles and colors, to understand their feelings about designated industrial robots in combination with the perceptual image spaces of the robots, and to verify if the product designs of industrial robots satisfy user perceptual, psychological demands based on the subjects’ eye movements, physiological signals, total scores, and sequencing of samples. Different images of industrial robots led to different physiological and psychological changes. Superior creative industrial robots brought the subjects good perceptual experiences, including psychological and physiological pleasure and comfort.
Independent variable
Independent variable includes the images of industrial robots, 3D models of eight representative samples, and one creative sample. Make nine experimental samples by building the eight representative samples in Figure 1 and the innovative design samples in Figure 3 into 3D models.
Dependent variables
Dependent variables (indicators) include the eye movements (direction, duration, and track of eye gaze), physiological signals (indicators for electrical conductance of skin and heart rate (HR) variability), and electroencephalography (EEG) signals.
Experimental equipment
In this study, the ErgoLAB, which represents a man–machine synchronization platform developed by Beijing Shenzhou Jinfa Technology Co., Ltd, and the ErgoLAB 3.0, which denotes software for man–machine synchronization, were used in combination with the WorldViz VR helmet system. The experimental equipment also included aGlass (a VR-based device for tracking eye movements), wearable wireless physiological recording modules such as ErgoLAB PPG/BVP (a wireless pulse sensor for blood volume) and ErgoLAB EDA (a wireless electrical design sensor), nine channels of wearable wireless EEG measurement system, wireless EEG/ERP/BCI system with a dry active electrode, and functional modules for data analysis (including Eyetracking, General, HRV, EDA, and Statistic).
Selection and number of subjects
Subjects included the designers, researchers and developers of industrial robots, university students, design professionals, and psychology professionals. A total of 20 subjects were included in the experiment.
Stimulus materials
Stimulus materials included the three-dimensional models of eight representative samples and one creative design sample (which used the Unity design scenes and developed programs).
Experimental procedures
Preliminary experiments were performed before the formal experiments according to the experimental design scheme. First, the subjects were informed about the experimental processes and tasks. They made different physiological and psychological responses to samples of industrial robots observed by experimental wireless equipment under VR conditions to record the signals. Subsequently, they filled up the perceptual questionnaire form for each sample, and questionnaires were collected and stored. After all 20 subjects completed the test successfully, the experiment finished.
Experimental results and data analysis
Data processing and analysis regarding indicators of eye movements
By observing and analyzing nine heat maps of industrial robots, which are presented in Figure 4, the hot points were statistically analyzed. Thus, it can be initially inferred that in watching sampled industrial robots, respondents mostly concentrated on the following parts of the industrial robots: small arms, elbow joints connected to arms, and waist where the lower parts of upper arms were connected to the base. In the heat maps, the parts of industrial robots on which the respondents focused could be qualitatively and intuitively observed. To study more quantitatively, the extent to which parts of industrial robots on the pictures received the attention of the subjects, the industrial robots were zoned into several areas of interest (AOIs). The industrial robot was divided into three AOIs, namely AOI 1, AOI 2, and AOI 3. Besides, by counting the fixation frequency, it was statistically analyzed how much each part was concerned. The fixation frequency of samples was statistically analyzed, and the results are shown in Table 4.

Hot-spot graph of the industrial robot sample.
The frequency of the average number of fixations in the AOIs.

AOI: area of interest.
The data provided in Table 4 were analyzed. After the analysis, it was found that the waist at which the lower part of the upper arms was connected to the base, and which was denoted as AOI 3, was observed most frequently both on average and in total. In combination with the quantitative type I analysis results, it was concluded that the respondents paid the most attention to the following three parts of industrial robots: wrists, elbow joints connected to arms, and the waist where the lower parts of upper arms were connected to the waist. Namely, the waist at which the lower parts of upper arms were connected to the base received the greatest concerns, so it should be especially designed.
The data analyses on the visual scan paths, heat maps on the overall scene model of the eye tracking experiment, the AOI obtained by dividing the model, statistical forms on mean fixation frequency of the AOIs, and statistical forms about mean fixation duration of AOIs suggest that the creative design models were relatively rich in details and attracted the respondents’ attention better. The respondents were relatively interested in creative sample models. According to the experimental results, the respondents were more interested in sample No. 9 and No. 4.
Data processing and analysis regarding indicators of skin electroconductivity
Skin conductance is one of the common indicators in experiments regarding emotional responses. 32 In this study, a sensor was employed for measurement at fingers. The Environmental Dataset Gateway (EDG) data were smoothed, denoised, and filtered by a low-pass filter according to the skin conductance curve of a respondent. The silicon-controlled rectifier (SCR) data were extracted based on the SCR conductance response, as shown in Figure 5. After the preliminary data were denoised, and qualitative parameters were processed, the baseline time-domain analysis results of the skin conductance before and after the irritation were obtained. Galvanic skin response was positively correlated to the excitement of sympathetic nerves. To be specific, the subjects got excited when the nerves had been excited. The above analysis results indicate that compared with the baseline resting state, the mean (μS) and maximal (μS) skin conductance of the subjects generally increased during the experiment, so they were excited in watching the experimental materials.
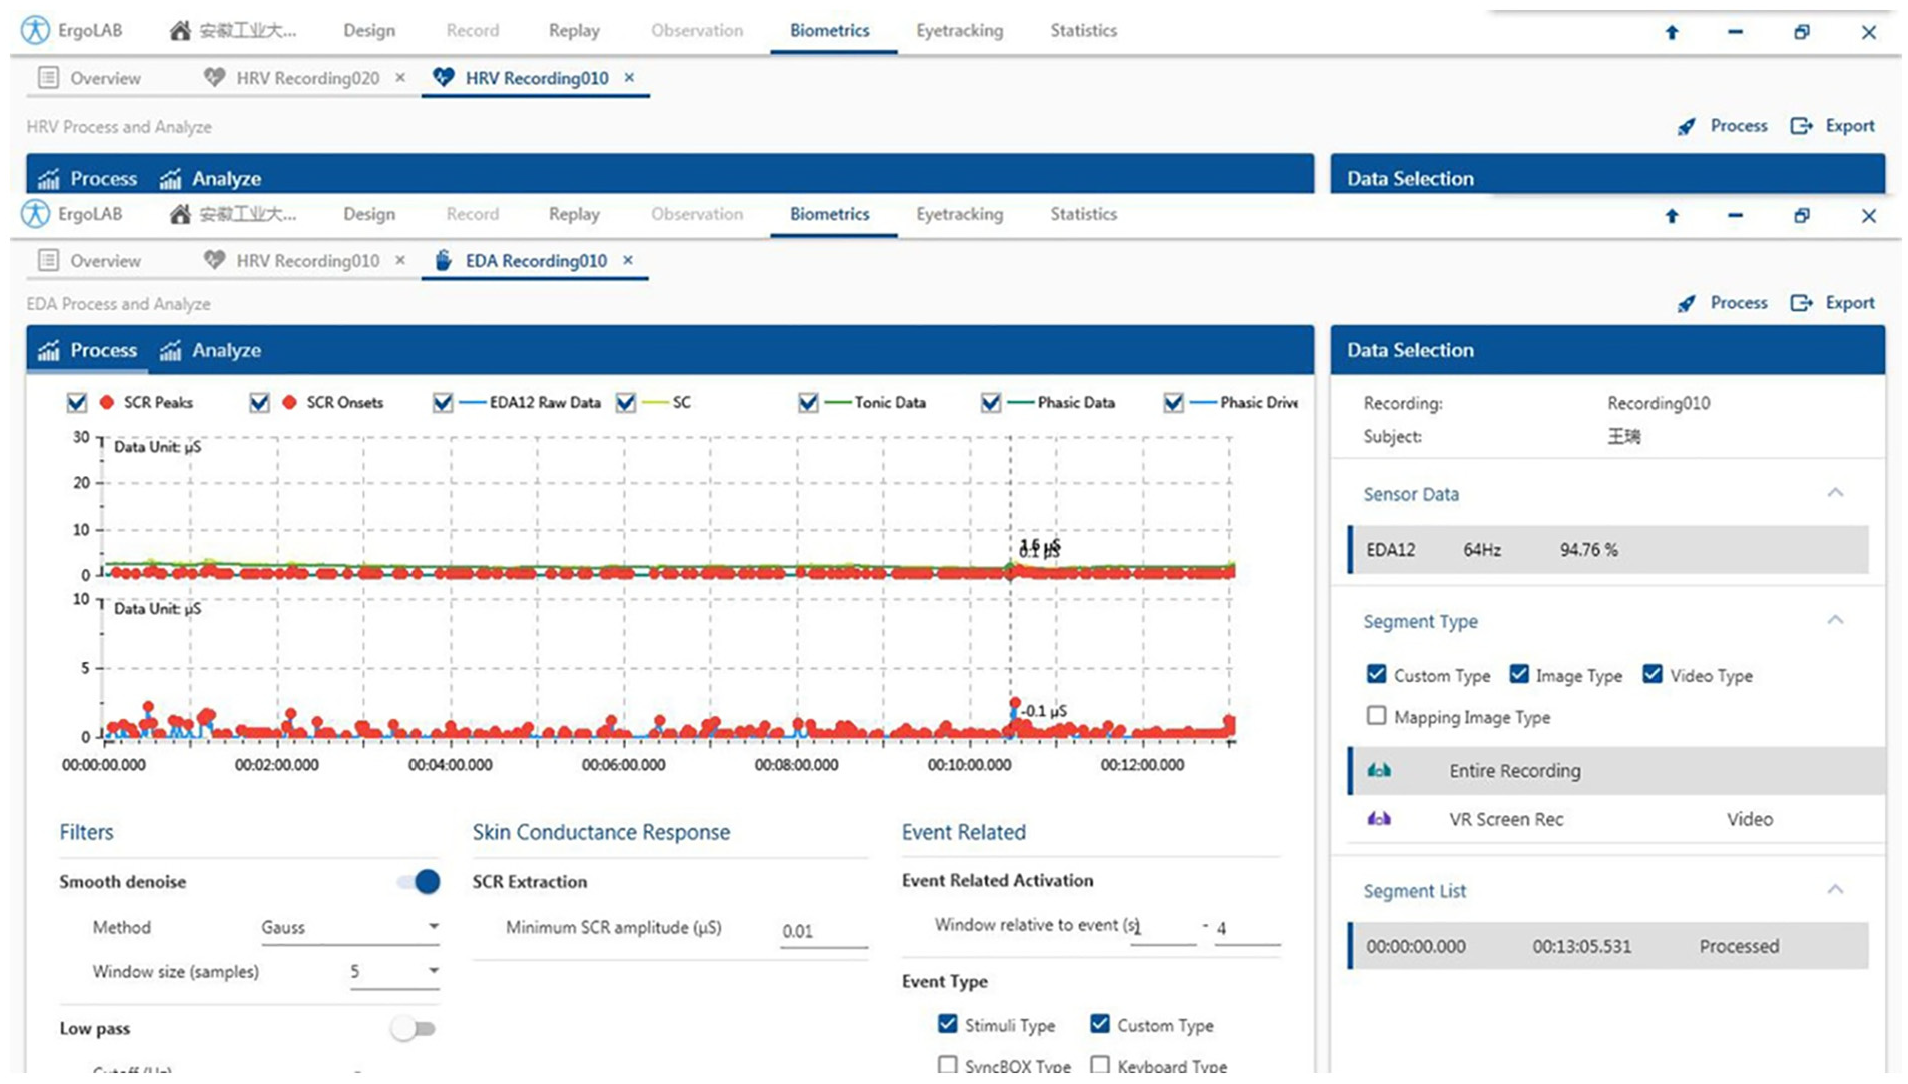
The EDA data noise reduction parameters.
Data processing and analysis regarding indicators of HR variability
To a certain extent, the analysis of HR variability studies analyzes the sympathetic nerves and vagus nerves. 33 Using the ErgoLAB3.0, a man–machine synchronization platform, the regular data helpful for further extracting valuable information were obtained. In the experiment, an increase was detected in the mean HR and PR SNDD, so the subjects became more excited during the experiment. The relative frequency distribution (low frequency (LF)/high frequency (HF)) reflected that nervous activities were mostly sympathetic, and the ratio increased from 1.06 to 2.05, as shown in Tables 5 and 6; thus, the subjects got excited in watching the experimental stimulus materials.
Analysis results of frequency domain index of the heart rate baseline.

LF: low frequency; HF: high frequency.
Analysis results of frequency domain index after the heart rate stimulation.

LF: low frequency; HF: high frequency.
Data processing and analysis regarding indicators of EEG level
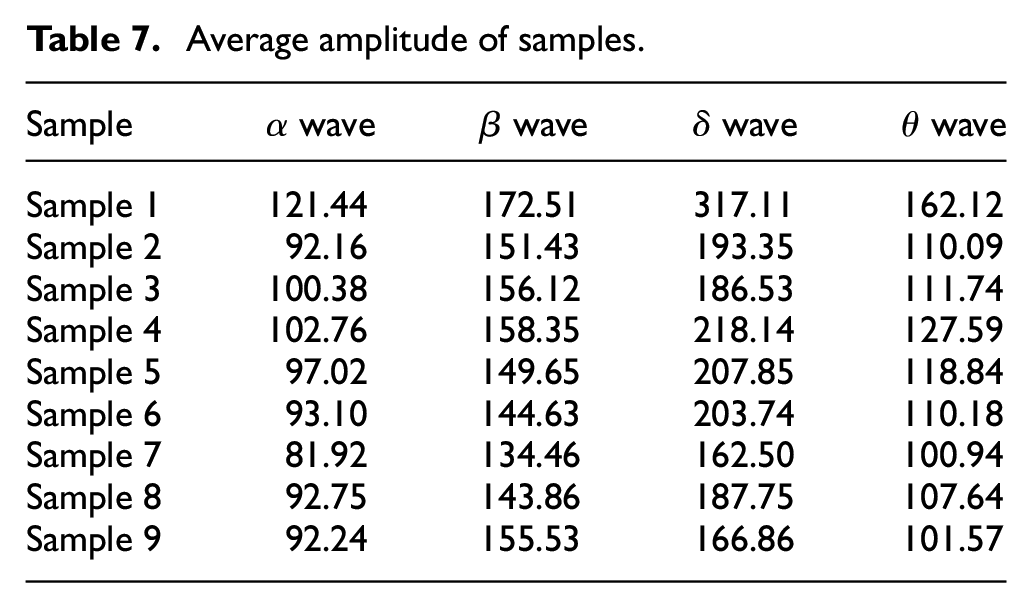
The effects of a stimulus upon brainwaves were analyzed based on the mean amplitude of different waves, especially α and β waves, as shown in Table 7. As samples changed, the wave amplitude of α waves was relatively high at the earlier stage, whereas the wave amplitude of β waves dropped significantly, which indicated that the subjects were relaxed and happy. When sample No. 9 was observed, α waves were suppressed, but β waves began to recover, which suggested that the respondents progressively concentrated on the observations. While observing sample No. 9, α waves were constantly suppressed without any significant change, but β waves bounced back fast, which indicated that the respondents were greatly stimulated when they were concentrated on the observations. Hence, sample No. 9, namely the creative sample, stimulated the subjects most significantly.
Average amplitude of samples.
Statistical analysis of questionnaire data
At two stages of the formal experiment, the chief examiner asked the respondents two questions. Nine different samples were scored with respect to their sense of technology, and sample models were sequenced according to the overall personal degree of preference in the overall scenes presented by nine sample models. The results were recorded by the chief examiner and statistically analyzed after the experiment. The results after sorting and scoring are given in Table 8.
Sample ranking scores.
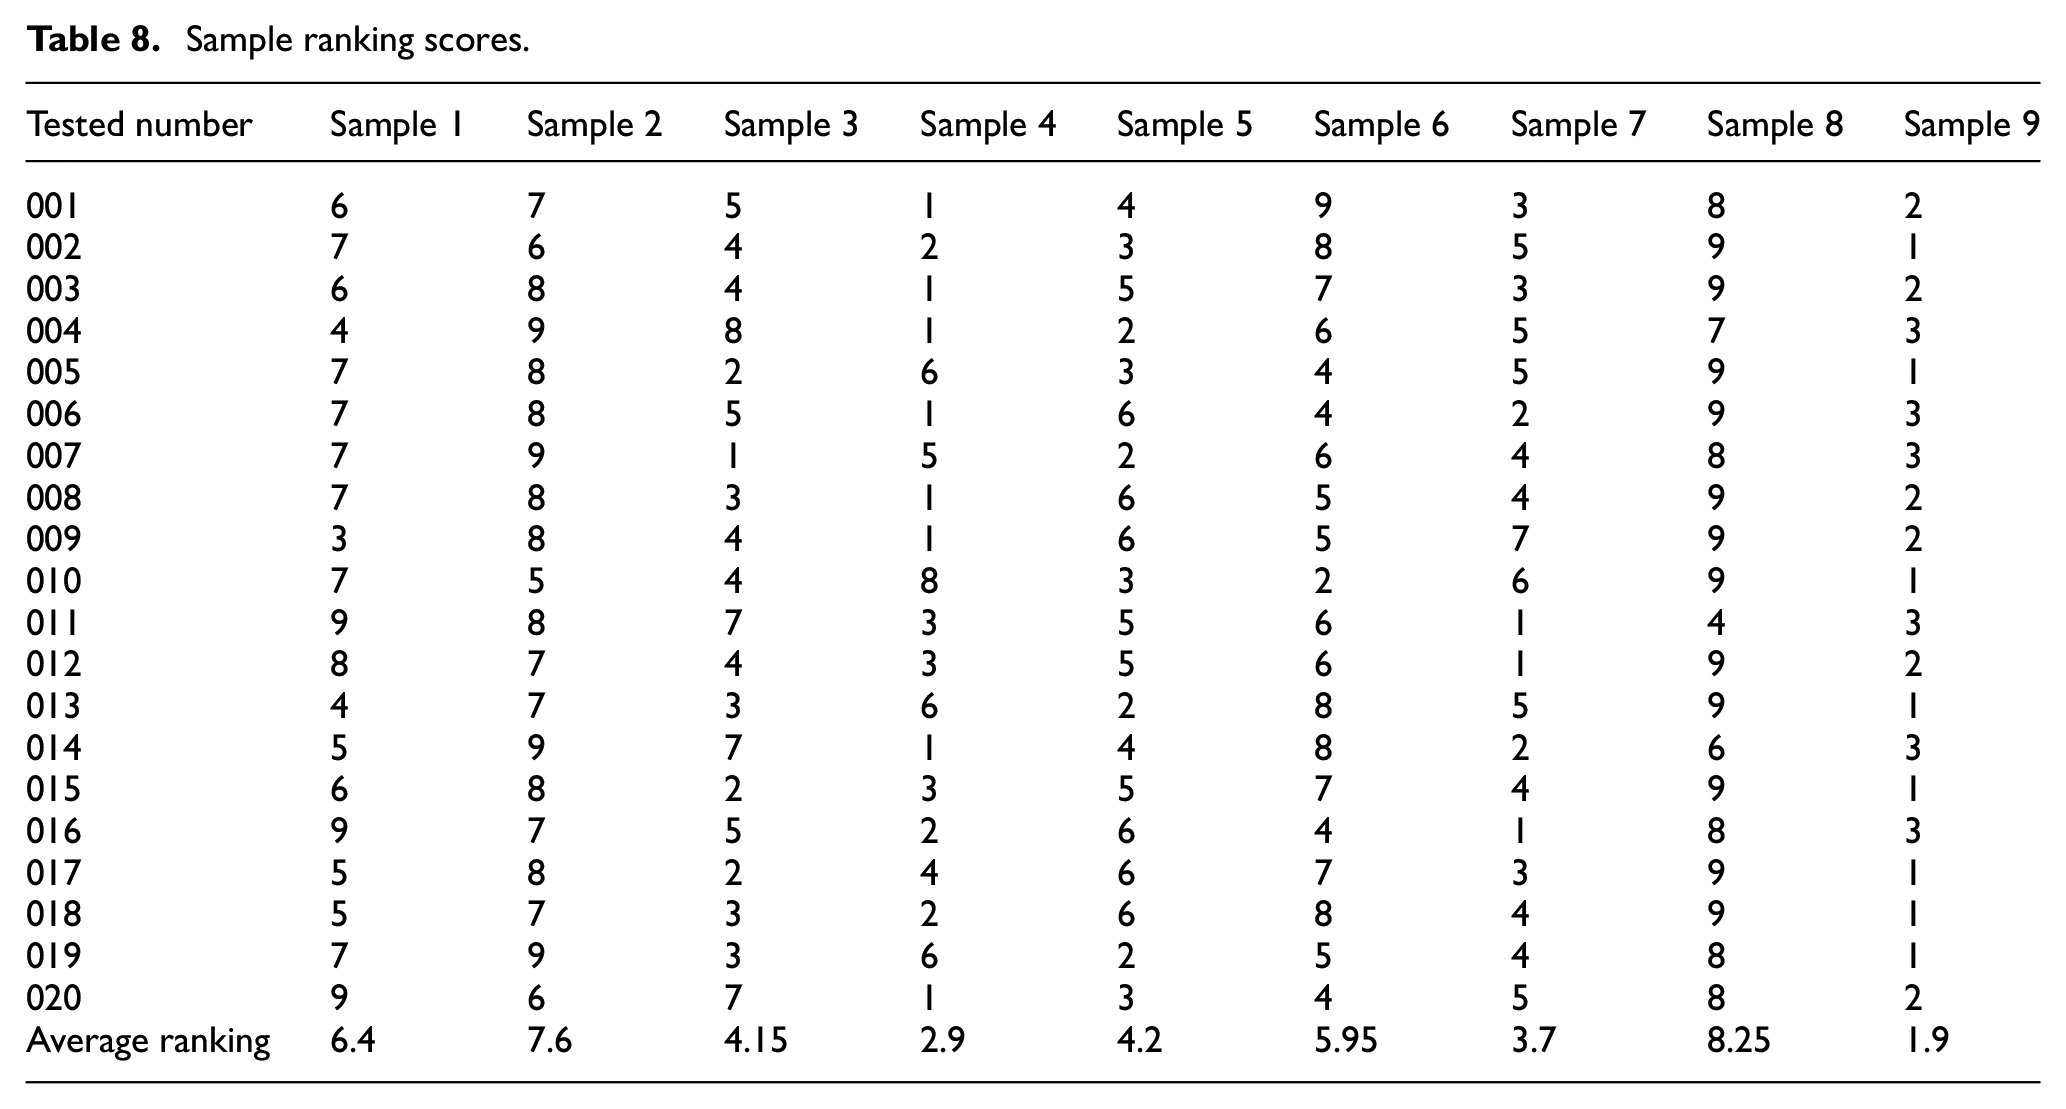
As shown in Table 8, all the subjects ranked sample No. 8 as a TOP3 creative design in accordance with their likes, and the average ranking of this sample was the highest. This suggested that all the creative designs were popular among all the subjects, which demonstrated that the creative design scheme was in line with the expected goal.
Experimental results
From the above statistical analysis of indicators of eye movements, HR variability, and skin conductance, as well as summary and statistical analysis of the questionnaire survey data, the following conclusions were drawn: by performing a subjective questionnaire survey in combination with the collection of physiological data, it was found that among the stimulated experimental samples, including eight representative industrial robots and one creative industrial robot, the creative industrial robot stimulated the subjects better and enjoyed popularity from more subjects.
Method extraction
Through the above extensive studies and experiments, the perceptual design method combining the physiological signals with VR for industrial robots was evaluated. First, an experiment was performed on perceptual image spaces of industrial robots to represent the spaces on the basis of semantics and pictures and to create the perceptual image spaces. Next, in the eye movement experiment, the perceptual design elements of the industrial robots were decomposed, and the experiment was performed to semantically assess final perceptual images to code style and color design elements of the industrial robots. The quantitative type I analysis was conducted to map the relationships between the perceptual image spaces and design elements of the industrial robots. Finally, the final design scheme for the industrial robots was drafted based on the schematic design outline under semantic conditions of images and essentials for designing the scheme under the same conditions. Next, it was quantitatively evaluated to examine whether the final design scheme satisfied the user perceptual, psychological needs through the experiment for evaluating synchronous physiological signals, in order to optimize the perceptual designs of industrial robots. The flowchart of the perceptual design of industrial robots is presented in Figure 6.

The perceptual design method for intelligent industrial robots based on the VR and physiological signal synchronization quantification.
Method validation
Through the above research, the ultimate perceptual design scheme for collaborative robots with 6 degrees of freedom was drafted and submitted to Anhui Hiseed Robot Company Limited (principal) for trial production. After the sample robots were commissioned and corrected, Anhui Hiseed Robot Company Limited put creative, collaborative robots with 6 degrees of freedom into mass production. In addition to good performances on the market, the robots have been recognized by users and received well within the industry. They were also granted the gold award at the Anhui Provincial Industrial Design Contest and the Red Star Design Award, which is an authoritative award within the industrial design industry of China. They were also exhibited on the China International Industry Fair (Shanghai), as shown in Figure 7. The collaborative robots with 6 degrees of freedom have verified that perceptual design methods proposed in this article are effective for industrial robots.
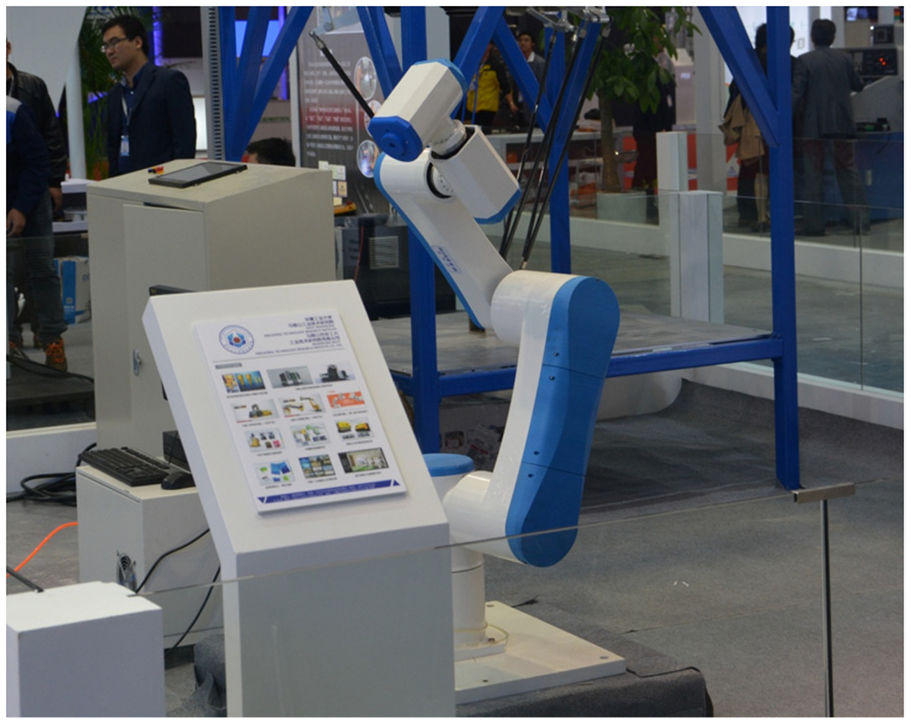
Exhibition at Chinese international industrial exposition.
Conclusion and prospects
Main conclusions
To research the design and development of industrial robots, it is unilateral to design the robots merely based on perceptual thinking and creativity of industrial designers, or lay too much emphasis upon quantitatively studying data about emotional cognition. In this article, industrial robots are studied from both perspectives. By combining the semantic differentials with the experimental collection of synchronous physiological signals such as eye movements, skin conductance, HR, and EEG, this article proposes a research method for perceptually designing artistic and scientific industrial robots.
A method is developed for jointly representing perceptual image spaces of industrial robots with pictures and semantics
During the research, 116 pairs of perceptual vocabularies on industrial robots were semantically collected from the perceptual images. After 80 subjects completed the questionnaire, 36 pairs of perceptual vocabularies were identified through the preliminary selection. In the beginning, 503 pictures of industrial robots were collected. After the initial selection, 127 pictures remained. Then, an eye tracking experiment was conducted, thus selecting 40 pictures and making them into samples; 8 representative samples of industrial robots were identified through the multidimensional scaling analysis and cluster analysis after 30 subjects were invited to take part in the experiment of clustering samples, in order to represent perceptual image spaces of industrial robots by pictures. Namely, 8 representative samples of industrial robots were separately combined with 36 pairs of perceptual vocabularies. The experiment was conducted to assess the perceptual images via the questionnaire survey to perform the factor analysis on 133 valid questionnaires. Finally, 10 pairs of representative perceptual vocabularies were extracted, and perceptual image spaces of industrial robots were semantically represented.
This article presents a method for mapping the relationships between the perceptual image spaces and design elements of industrial robots
By analyzing the structures of industrial robots, their perceptual design elements were decomposed into 11 groups and 37 categories from the perspective of style and color. An experiment was conducted to semantically evaluate the perceptual images of 27 selected samples using 10 pairs of representative perceptual vocabularies, thus determining the values for evaluating the semantic feelings about samples of industrial robots. By virtue of classification and coding, a form on codes of perceptual design elements was created for those 27 sampled industrial robots. Subsequently, the quantitative type I analysis was conducted to determine the quantitative relationships between each group of image semantics and design elements, that is, the relationships between the perceptual image spaces of industrial robots and design elements.
A perceptual design method for smart industrial robots based on VR and synchronous quantitative physiological signals is introduced, and its effectiveness is verified in practice
A form of design elements was created in combination with classification and coding, thereby identifying the guidelines for drafting schemes for industrial robots under semantic conditions of images. Based on the practical schemes for designing collaborative robots with 6 degrees of freedom, the essentials of the schemes were clarified under the semantic conditions, and the design scheme was finalized. Next, an experiment was conducted to evaluate the synchronous physiological signals based on the VR and in line with the final design scheme. The statistical results and analyses of the experimental data demonstrated that the final design scheme was better than the existing market schemes. Based on the research results, a perceptual design method was extracted for smart industrial robots based on the physiological signals and VR. Besides, this method was proven as effective by the successful design and development of collaborative robots with 6 degrees of freedom.
Prospects
The research on perceptual designs is associated with multiple disciplines, including design science, aesthetics, psychology, sociology, statistics, management science, mechanics, computer sciences, and technologies. Related studies are theoretically conducted across multiple fields and a big span. At present, researchers and scholars incorporate neurosciences into their studies about perceptual designs, providing cutting-edge scientific theoretical and technical support for making relevant studies more in-depth and novel. In spite of certain research outcomes from its relatively systematic research and some beneficial explorations concerning perceptual design methods for industrial robots and their applications, there is still some weakness in this article owing to the limitations upon the author’s personal theoretical knowledge and experimental conditions. In the future, it is necessary to perform further research and make improvements based on more practices. To be specific, further research is expected to be conducted from several perspectives as follows:
Although expressing perceptual image spaces of industrial robots by pictures and semantics is helpful for understanding common emotional features of industrial robots, it is still impossible to accurately understand people’s personalities and perceptual image spaces. Thus, further research shall be performed to figure out how to completely understand common features and personalities of industrial robots.
Compared with general products, industrial robots are characterized by bulk volume and complicated functions. This study focuses on features of static product images and their perceptual images. However, it rarely examines people’s interactions and affective experiences in operating the industrial robots, which shall be further explored in depth.
With the rapid development of neurosciences, vigorous development has been achieved in multiple branches of neurosciences such as neuroergonomics and neuroaesthetics. As for the combination of neuroscience and design science, some experts have proposed the concept of neural design science. How to study creative designs in combination with neuroscience and related research findings like neural mechanisms of related mental activities has become an inevitable development trend for future studies about perceptual designs.
Discussion
Kansei experiments for measuring eye movement typically incorporates two-dimensional (2D) images and forms such as web pages and photos as stimuli. However, the difference between the effects of abstract and product forms on people’s Kansei evaluations requires further investigation. We maintain that the form elements reported by Fann et al. 34 by affecting the Kansei evaluations of people in 2D image experiments also influence the Kansei evaluation of 3D forms. In this study, we use 3D modeling technology to transform eight experimental samples from 2D to 3D, combine them with innovative experimental samples of 3D modeling to form a group of comparable experimental samples, and then carry out the experimental study. The results show that the experimental results are more reliable.
Identifying the emotion-related product attributes (perceived by consumers) is a challenging task in the field of emotional design. Conventionally, this process relies profoundly on the researchers who conduct the Kansei experiments and select the product attributes such as color, form, and texture for Kansei studies. However, in that way, other product attributes that also play a vital role in product–emotion associations may be neglected. More importantly, the identification of product attributes should be based on user emotions. A product configuration analysis method for an emotional design using a personal construct theory was introduced by Y Huang et al. 35 AS JL Plass et al. have pointed out in JL Plass et al., 36 they sought to replicate these results with a different population and different mood induction procedure and examine individual emotions and to decompose the effects of the design elements of color and shape. In this article, the Kansei experiments include a large number of real users so that the experimental results can reflect the emotional needs of users better.
T Nomura and Y Mitsukura 37 found what kinds of emotions users have while watching TV commercials in the presence of words (lines, a jingle, a sound logo, and on-screen words) that were later remembered, by using the EEG and questionnaires. In their experiment on TV commercials, the EEG measurement and questionnaires were conducted. However, this research simulates the real scene in the VR environment and combines the EDA, electromyography (EMG), HRV, eye movement, EEG, and subjective questionnaires to carry out the experiments. Besides, it gives users an immersive experience while testing the subjective and objective emotional response data of users. Through the analysis and research, it finally draws mutually validated and accurate experimental results, which provides scientific support for further research in this field.
Footnotes
Handling Editor: Wei-Chiang Hong
Declaration of conflicting interests
The author(s) declared no potential conflicts of interest with respect to the research, authorship, and/or publication of this article.
Funding
The author(s) disclosed receipt of the following financial support for the research, authorship, and/or publication of this article: This study was financially supported by National Natural Science Foundation of China (51375014), Shanghai Design IV Top Subject (DC17013), and Ministry of Education Humanities and Social Science Youth Fund (18YJCZH197).