
Abstract
Building performance management requires massive data input; however, the relevant data are separated and heterogeneous; thus, it prevents a comprehensive building performance management. Building information modeling brings a new way to capture rich information of a building, and has great potential in data interoperability for building performance management. This article presents a scalable building information modeling–based cyber-physical platform for building performance monitoring to integrate heterogeneous data from different buildings. A smart sensor network based on Arduino and standard protocol is installed for data sensing and collection. A building information modeling–based sensing information model integrating heterogeneous data in a unified structure is proposed, and a scalable NoSQL database is established to store data in a cloud environment. A series of RESTful web services is developed to share data for building performance management applications. The proposed platform is developed taking the advantage of horizontal scalability of NoSQL database, and the data schema and services are generated automatically based on the unified data model. The platform has collected data from 77 buildings in China, and the results of a case study show the platform brings a new paradigm in collecting, storing, integrating, and sharing of sensor data and building information for building performance monitoring and analytics.
Keywords
Introduction
Buildings consume 40% of global primary energy, 1 and it’s the most energy consumer in many countries and areas including the European Union, 2 the United States, 3 and China. 4 Systematic building energy management can help save energy significantly to a range of 5%–30%. 1 The intention to reduce building energy consumption drives the installation of sensors for monitoring building energy use as well as the indoor environment. Evaluating and prediction of building energy consumption is crucial for improving decision-making toward reducing energy consumption by assisting building operation strategies.
Building energy consumption management can be achieved by physical modeling or data-driven approach, each requiring detailed, accurate, and massive data input. 5 By now, monitoring devices have been installed on many buildings and are continually collecting building performance data. However, a key problem associated with an effective building performance framework is the availability of performance data and the integration of data from separate data silos.6,7 Currently, building information model (BIM) provides a detailed description of a building, while building energy management systems (BEMSs) take the role of collecting data from sensors in the building on-site. 8 However, a data-driven approach often considers building property as a given parameter, so there is usually little interaction between islands of BIM and energy performance management, so the relationship between performance and the building itself are far from fully discovered. 9 Furthermore, providers define their own data schema for the BEMS on-site for each building. Therefore, the data silos of building information and energy consumption are separated, and the data from different buildings are heterogeneous and isolated.
Recently, some researchers are seeking to use the semantic web to enhance data interaction between information islands, and they handle the utilization of the data in existing systems.10–12 However, instead of compromise to the existing data schema, a better framework for data integration is desirable to integrate sensing data with building information. Therefore, a literature gap remains that heterogeneous from disconnected data silos, that is, building information and sensing data, from building to building, are not integrated to support a comprehensive building performance management and evaluation.
In this work, a scalable BIM-based platform for sensing, integrating, storing, and sharing separate and heterogeneous energy consumption data together with the building information is established. In the proposed framework, data are collected in real-time by a smart sensor network. The required information is stored in a NoSQL (Not Only Structured Query Language) database by a unified data schema. This framework also enables a various application to utilize the data by providing web services to support data analysis and data mining.
The rest of the article is organized as follows. In section “Related works,” a brief literature review is given and the research gap is identified. In section “Methodology,” the methodology of the research is presented. In section “BIM-based cyber-physical framework,” a BIM-based cyber-physical platform for building performance monitoring is proposed. The framework of the platform is also introduced in detail by each layer. In section “Implementation and case study,” the implementation of the platform and a real case is provided to validate the feasibility of the proposed framework. Section “Conclusion” summarizes the conclusions, limitations, and future research.
Related works
This study focuses on proposing a framework to collect, store, and share data for building performance management. Previous research of relevant aspects is reviewed as in the following sections.
Integration between energy data and building information
The major datasets for building operations are from the sensor-based systems. Sensors in buildings are utilized to constantly collect real-time information, including the following:
Energy consumption: electricity, water, gas consumption, and so on;
Device operation: operation status of air conditioner, heater, and so on;
Environment quality: temperature, humidity, the concentration of toxic gases, and so on.
Many buildings are equipped with building management systems, which consists of monitoring and control parts. They are utilized to monitor environmental quality and energy consumption throughout the building operation phase and control each device according to predefined strategies. 13
BIM is a process supported by various tools and technologies involving the generation and management of digital representations of physical and functional characteristics of facilities. 14 And information generated throughout design, construction, and operation stages can be integrated and represented based on Industry Foundation Classes (IFC), a major standard for BIM.15,16 Therefore, integration of building performance data into BIM has a promising future for delicacy management of building operation.
BIM makes it possible to have a better understanding of the spatial features of building elements and spaces, 17 and establishing linkage between energy consumption data and BIM can inform better building performance management. 18 Yalcinkaya and Singh 19 have identified performance assessment and simulation as a target of BIM application. However, several barriers and challenges are preventing effective data integration, such as the lack of information standards and coordination. 20
Current research utilizes different strategies to integrate BIM data and energy data. (1) Some use proxy entity or extends Industry Foundation Class (IFC) standard to support sensor data expression; (2) some combines IFC and SensorML model to express sensor data together with BIM model; (3) some stores sensor data in external files, such as text file or spread sheet, and develop plugins to present sensor data in a BIM model; (4) some stores sensor data in an external database and maintain the linkage between BIM model and the data and develop an application based on the database; (5) and some develop an ontology-based semantic web to represent the data and their linkage. Relevant literature can be classified as in Table 1.
Current strategies to integrate BIM data and sensor data.

BIM: building information model; IFC: Industry Foundation Class.
Using proxy entity or model extension does not guarantee data interoperability, and external storage may cause inconsistency between different data silos. Hence, this article devotes to establishing an ontology-based standardized data model to integrate energy consumption monitoring data with BIM for further utilization and analyze.
Database for building energy data management
Big data storage is the basis of its application, and all big data management relies on the accumulation of the data. Databases for big data storage can be classified into relational databases and NoSQL databases. 37 Energy data are commonly stored in relational databases because they support Structured Query Language (SQL) so that data can be retrieved using simple query statements. However, studies have suggested that relational databases face difficulties dealing with expanding big data where deadlock can frequently happen, read and write efficiency can be intolerable, and horizontal scalability is not supported. 38 Furthermore, the data needs of today’s applications including texts, images, videos, BIM cannot be effectively processed by relational databases. 39 NoSQL databases have been proposed to overcome the performance and scalability issues of relational databases and have become desirable alternatives for the cloud-based environment. 37 NoSQL databases take the advantage that they support flexible data model, horizontal scalability, and read and write response; thus, they outperform relational databases in big data management. 40
A few researchers have explored ways to utilize a cloud environment to store massive BIM data in NoSQL databases. For example, Das et al. 41 proposed a Social-BIM structure to collect and store data from different participants based on the Cassandra database provided by Amazon Cloud. Jeong et al. 32 designed a double-layer storage structure for the bridge sensor, where Cassandra database stores real-time stream data from sensors and MongoDB collects data for future application. Cheng and Das 42 proposed a data model for BIM storage in Cassandra and realized sub-model retrieval. Lin et al. 43 designed a data model based on IFC format for BIM storage in MongoDB which supports massive BIM storage and efficient query. These studies show advantages to make use of a NoSQL database and cloud environment to store massive BIM data. Despite all these research studies, the linkage between information from BIM and from sensor network still remains incomplete because of the lack of integration of data from separate silos.
Web service for building energy data interoperability
Building performance applications rely on the access to relevant data, and a data service is necessary to provide data interfaces with a good interoperability. Data need to be transformed into string or byte array for transmission through the network, which is called serialization. In web services, XML and JSON are widely used for serialization. As a simple light-weighted format, JSON format is becoming mainstream in data interchange.
Some web protocols and interface designs have been developed to build web services. For example, remote procedure call (RPC) is a protocol that allows programs on one computer execute procedures on other computers through network, which is usually used between services. Simple Object Access Protocol (SOAP) is a protocol for exchanging structured data in XML format between web services, and it has rich features and standards. Representational State Transfer (REST) is also a web service interface style proposed by Roy Thomas Fielding in 2000. Every resource has a URL, and HTTP method indicates the operation. Moreover, there are some protocols for industrial domains like Open Platform Communications (OPC), and some designed for high performance, but they are weaker in scope of use and human-readability. In these protocols, REST has the simplest and friendly design to data users.
There are some cases mentioning their application programming interface (API) design for building data. Zhao et al. 44 developed an energy monitoring system for large public buildings, in which the sensors send data in XML format and the transmission between the sensors and the server is based on SOAP protocol. Y Agarwal et al. 45 proposed an architecture for building data storage, access, and sharing, and this system provides REST API for getting data in JSON format or HTML. The related research shows that RESTful API and JSON format is simple and enough for a data service; therefore, this research utilizes this combination to provide data API based on comparison.
Methodology
The overall methodology for BIM-based cyber-physical platform for building performance monitoring is shown in Figure 1. The entire platform aims at sensing, integrating, storing, and sharing data from BIM and collected by sensor network. A BIM-based cyber-physical framework is first designed based on demand analysis. This framework is consisted of four layers, accomplishing the complete data flow from generation to utilization. A prototype platform is then developed based on the framework. This platform is developed in C# and the database is built upon HBase which is distributed in a private cloud environment. The whole platform is deployed by Docker, a container platform for cost-effective application deployment and management. In order to make comparison between buildings in various environments, this platform is connected to existing sensor platforms of 77 buildings to collect electricity consumption data, and smart sensor network based on Arduino is installed in two of the buildings as a supplement to collect indoor environment data, including temperature, humidity, and lighting. Several application scenarios are implemented as case studies to verify the total workflow of the platform.

Methodology.
BIM-based cyber-physical framework
The BIM-based cyber-physical platform is to facilitate collecting, storing, integrating, and sharing sensor data and building information to support building performance analyze application. A scalable cloud-based platform is proposed as in Figure 2 which is composed of the following four layers:
Sensing layer is made up of a sensor network which consists of sensors installed in different places in a building. In this research, an Arduino-based sensing network is realized to collect energy consumption data and environment data continuously. The Arduino microcontroller periodically gets data from sensors, and sends data in JSON format through a wireless network connection provided by Wi-Fi module.
Storage layer is a database to store all data from the sensor network in a unified schema. In this research, a cloud-based NoSQL database is utilized to deal with the expanding massive big data. According to the data requirement, this research established a BIM-based sensing information model for building performance and a unified data schema is designed based on the information model. This research selects HBase as the database, and the schema of the database is generated automatically based on the information model.
Service layer provides several web services to enable data access to various building performance application. In this research, RESTful web service is utilized to provide lightweight services. The services utilized gzip format to compress data and in-memory database as cache service to improve performance. The basic API and documentation are also generated automatically based on the model, and the deployment of the services can be executed automatically based on containerization engine. The data service provides data pushing, downsampling calculation for time-series data, and user permission control.
Application layer is data users including data analysis and data mining. In this research, data requirements are straight from the data application scenarios, including what, how often, and to what detail to collect.

Overall framework of BIM-based cyber-physical framework.
Sensing the data: smart sensing network based on Arduino
The stream data for building performance analysis like energy consumption, environment, and occupancy data should be collected by a sensing network deployed in buildings. This research proposed a smart sensing network design based on Arduino, and developed a system used with the platform. The framework represented as Figure 3 consists of three parts: monitoring devices, network, and server system. This framework first collects various stream data with the sensors in each monitoring device, then transmits them through the network by Message Queuing Telemetry Transport (MQTT) protocol, and finally processes them in the server system and stores them in the database of the platform.

Monitoring framework.
Sensor
In the sensing layer, appropriate sensors and microcontrollers are selected according to the data requirements. According to application demands, building performance analysis requires energy consumption, environment, and occupancy data, and the device consists of sensors for these requirements. The microcontroller periodically fetches information from the sensors, and then sends the data to the server which stores and processes the monitoring data through wire or wireless network. In this research, Arduino is selected as the microcontroller because it supports programs development on Arduino and connects it with a variety of sensors, servo motors, and many electronic components. The structure of the monitoring devices as shown in Figure 3 consists of a microcontroller and several sensors connected to it. The main code running on Arduino to get and send data is shown in Figure 4, and controlled by the code, the microcontroller reads data from sensors via its digital and analog I/O interface, and it organizes the data in JSON format, and sends the data through the network.

The main code running on Arduino which gets and sends data.
Network
The network for data transmission between the server and monitoring devices can be wired, wireless, or mixed. For wired transmission methods, Ethernet and some serial interfaces are widely used, and for wireless network types, Wi-Fi, ZigBee, and Bluetooth are common options. In this research, a wireless network based on Wi-Fi is implemented with Wi-Fi module. On the application layer of the network, MQTT protocol is selected to control communication, which is optimized for high-latency and unreliable networks (Figure 3). These features make it ideal for the Internet of things (IoT) environment and mobile communication environment with low bandwidth and limited computing power.
Server system
The server utilizes a message queue service which takes the responsibility for managing the communications with the sensor network by a certain protocol such as MQTT and transmitting data between monitoring devices and web services as a broker. When the controller uploads the monitoring data, the message queue server listens and receives the data and distributes it to all the subscribers of this topic. A script program is written to register as a subscriber at the message queue service, working to receive data from the message queue, parse and process data, and write it to the database. After these procedures, the monitoring data are continuously written into the database, and becomes available to big data applications. If other application needs real-time data from monitoring devices, the application can subscribe the broadcasts from the message queue service to access the data. Figure 5 shows the major part of server script which receives data and sends it to data service.
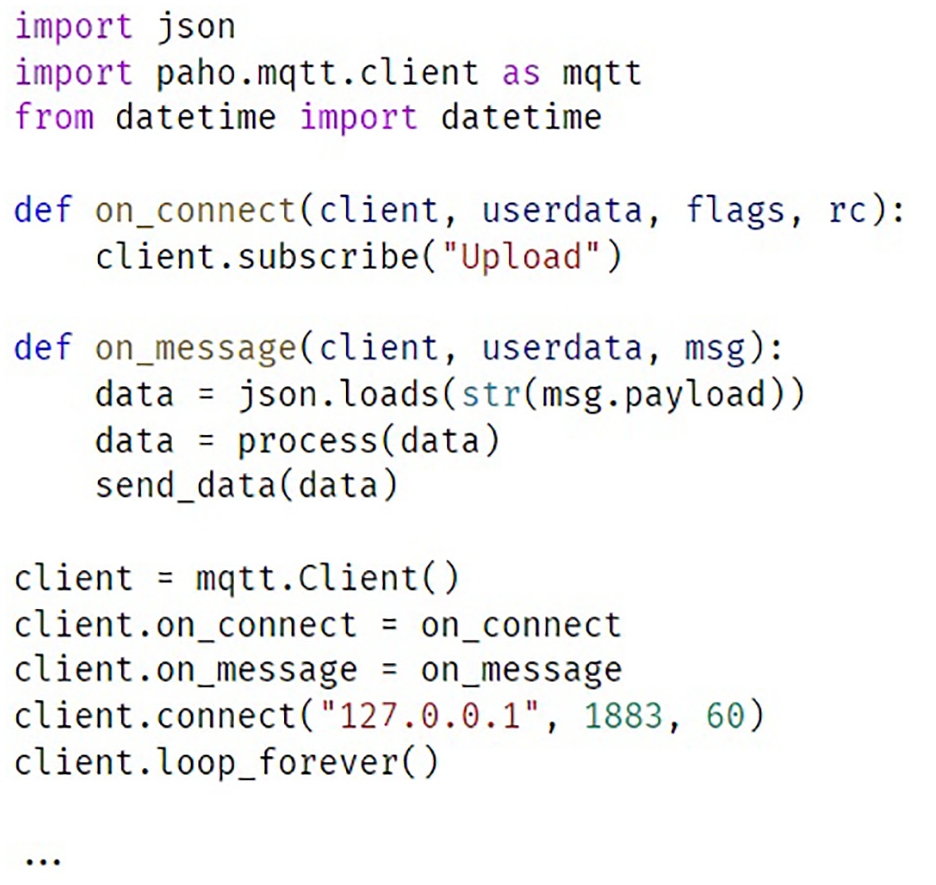
The major part of server script which receives data and sends it to data service.
Integrating the data: BIM-based sensing information model for building performance
Data requirement
Building energy consumption monitoring and evaluating mainly require information from various data sources, including information about building, sensor, energy consumption, and so on. These data could be divided into two main categories, that is, relatively static data and stream data. Relatively static data are those that don’t change with time or remain constant in a relatively long period of time. Stream data are those which highly rely on time, and are often a constant flow of information. The relationship between data is shown in Figure 6. Relatively static and stream data are correlated to each other, and a building performance assessment or management requires the understanding of the linkage between data silos.

Information requirement for energy consumption monitoring and evaluation.
Relatively static data include the following:
Building basic information. The information describing the building nature, including an identifier, type, usage, completion time, and so on. This type of data generally requires manual input; however, some existing building monitoring system may provide some related information.
Building geometry and topology. The information describing the geometry and topology property of the spatial distribution of a building, including area, adjacency, and hierarchy of spaces. This type of data can be obtained from a BIM model.
Sensor network. The information describing sensor networks in a building to collect energy consumption and environment property, including type, position, accuracy, and collection frequency of each sensor. This type of data can be obtained from a sensor platform; however, the correspondence between sensors and spaces may require some manual work.
Stream data include the following:
Energy consumption. The information describing electricity, water, and gas consumption in different spaces and of different sources. This type of data is automatically and periodically collected by the sensor network and is often stored in a monitoring platform.
Environment information. The information describing the environment status, including temperature, humidity, CO2 concentration, and so on. These data can be collected by a sensor network. Moreover, human activity is also an important factor influencing energy consumption; therefore, space occupancy should also be collected.
The information above is often stored in separate data silos, for example, building geometry and topology information can be retrieved from a BIM file, energy consumption information is stored in a sensor network or building automation platform, while environment information may come from external sources like meteorological observation related to the location of the building. However, when conducting an evaluation of energy consumption, the linkage of these data must be established and be understandable by the computer. For example, to evaluate the electricity utilization efficiency of a space, we first need to know properties including the area and function of the space. We then need to collect data from the sensor that sensing the electricity consumption of the space. Furthermore, we may also want to include weather data of the space to achieve a fair evaluation. Building topology is also important when we want to dive into different granularities of the analysis. Thus, a comprehensive data management platform with a careful design is crucial to facilitate the integration and utilization of relative data. Considering the stream data is generated continuously, and it can boom into a large volume in a short time, a distributed cloud-based platform is preferred in this study to effectively data utilization.
Data model
In order to establish a data model, semantic web technologies were found useful to help improve data interoperability, link across domains, and realize logical inference. 46 Semantic web technologies provide an opportunity to represent information in structured graphs to integrate information from different sources. There are a number of available ontologies that are aimed at sharing and connecting cross-domain data in the building domain, for example, the ifcOWL ontology is defined as a Web Ontology Language (OWL) representation of IFC data and serves as an alternative representation of the EXPRESS schema of IFC. 47 The semantic sensor network (SSN) ontology is accomplished to enable the expressive representation of sensors, their observations, and knowledge of their environment.48,49 The Building Topology Ontology (BOT) is a minimal ontology for describing the core topological concepts of a building. 49 A comprehensive data model can be established by reusing these data models as references. The major part of the data model is as in Figure 7, and the model is composed of relatively static data and stream data where BIM belongs to a part of the relatively static data.

Major part of the data model for energy consumption monitoring.
From the E-R diagram, relatively static data, stream data, and BIM are related to each other. The core of the relationship is the building topology, which forms a recursive pattern. A site, a building, a story, and a room can all be regarded as a zone, and they form a topology tree through the containing relationships. The topology tree is consistent with BIM, where a building is decomposed into stories. Thus, space can be linked to the corresponding entity by globalID. Each zone may contain several mechanical, electrical, and plumbing (MEP) equipment and sensors which has observations or running status linked to each entity.
Storing the data: NoSQL database schema design and automation
NoSQL database selection
Relational databases are revealed to have key challenges that are rigid, expensive, and less scalable. 31 To overcome these challenges posed by relational databases, NoSQL databases are proposed to overcome the performance and scalability issues of relational databases 39 and researchers have concluded that NoSQL databases take the advantage that they support flexible data model, horizontal scalability, and read and write response; thus, they outperform relational databases in big data management. 40 To achieve stream data collection from distributed sensor networks simultaneously and continuously, a NoSQL database has advantages over a relational database that it is horizontally extendible and has a relatively flexible data schema, thus suitable for massive and heterogeneous data storage and management requirements. A comparison between relational and NoSQL database 51 is shown in Table 2. In big data era, stream data can explode into a large volume, so the volume of a single data node is not adequate, so the database has to support scalability to expand its storage space within a short period of time. On the other hand, the data schema comes from application demand, which may change over time. So the data schema is preferred to be flexible to easily modify with this demand change. Therefore, NoSQL databases are more suitable to manage building energy data in this research.
Table groups in the platform.

NoSQL: Not Only Structured Query Language.
There are various NoSQL databases available, and this study selects HBase which is a widely used NoSQL database. HBase is a distributed, scalable, and NoSQL database for big data store based on Hadoop environment, and it provides high efficiency of reading and writing data and provides high availability and horizontal scalability, 52 which is suitable for real-time stream data and massive BIM data integration and management.
NoSQL database schema design
Based on the data requirement of building energy management stated in section “Sensing the data: smart sensing network based on Arduino,” tables can be classified into eight groups as shown in Table 3.
Table groups in the platform.

BIM: building information model.
A NoSQL database is often used with no schema design beforehand because of its flexible schema; however, this study aims at providing a platform to integrate heterogeneous data from separate data sources, an agreement of data format is necessary to enable data interoperability. HBase is a column family-oriented database, with a data model consisting of “column family” and “column” instead of “tuple” and “attribute” in a relational database. In HBase, each table consists of several column families and each column family consists of several columns, where columns are not explicitly defined when creating a table. Each row represents a record, and a row key is the identification of the record. 53 The schema of the NoSQL database can be expressed as

where R is the row key, C is the column family, CQ is the column qualifier, T is the time stamp, and V is the value.
In the schema of HBase, a row key can map to several column families, and each column family consists of several columns. Each cell is determined by row key, column family, column qualifier, and time stamp. The schema is similar to relational databases, each row representing a record. But unlike predefined fields in relational databases, columns are relatively flexible and can be added according to demand change without modifying the column family schema of the table. Tables in HBase are sparse and stored by column family, where empty columns are not taking up storage.
One part of relatively static data is the metadata of the building and can be retrieved from the BIM model or relevant documents, for example, the height, footprint area, and type of the building. Basic information of the building includes location, type, geometry, design, and energy usage strategy according to energy management and assessment demands. This part of relatively static data of each building can be expressed in key-value pairs, where keys can map to column qualifier and values can be mapped to the value of each cell. The data schema of building basic information can be expressed as in Table 4.
Data schema for building basic information.

BIM model is also a part of relatively static data. Not only the building topology and geometry information, but also the information of the MEP system can be extracted from a BIM model. But BIM model faces the most difficulty storing into a NoSQL database because the expression of IFC is inconsistent with NoSQL database schema. Jeong, 32 Cheng and Das, 42 and Lin and et al. 43 have explored ways to transform BIM data to match NoSQL database schema and support efficient data retrieval. This research follows the previous studies, and the schema can be expressed as in Table 5, where each row represents a model entity in BIM and each column represents a property of the entity. The row key is composed of the code of the building and the globalID of each entity, where the entity code is the globalID of the entity.
Data schema for BIM.
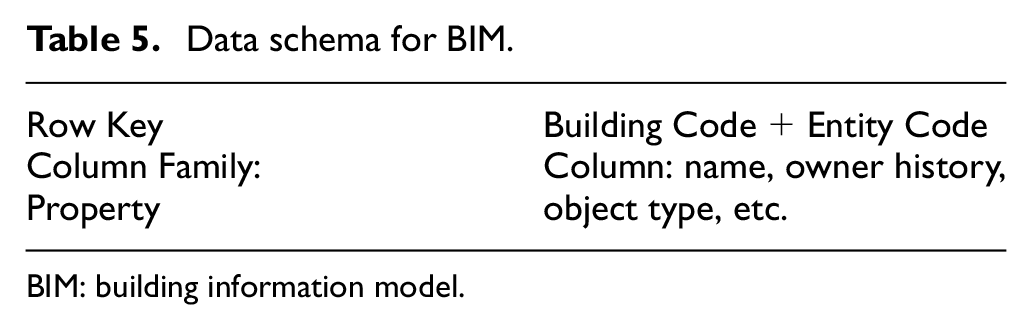
BIM: building information model.
Geometry and topology is an important part of the relatively static data. Though the information is embedded in BIM model, application often requires rapid query of the relationship of spaces. An individual table is necessary to store pre-processed topology and geometry information in order to avoid complicated query into BIM. The topology of a building can be expressed in a tree as in Figure 8(a), where a building consists of several stories, and each story consists of several rooms, which is consistent with IFC format. Stories and rooms can be abstracted as spaces; therefore, the topology of a building is a tree of different levels of spaces. A tree can be transferred into a key-value structure by referring to the code of each node’s father. The code of each space corresponds to the code in BIM. The data schema of building topology and geometry information can be expressed as in Table 6. MEP system is also the case. As in Figure 8(b) is an example of MEP system which also forms a tree like the topology tree where each system of the building can be divided into subsystems and consist of several pieces of equipment. The codes for the space and MEP system are consistent with the globalID of the corresponding entity in BIM (see Table 7).

Topology tree and MEP system tree example: (a) building topology tree and (b) MEP system tree.
Data schema for building topology information.

Data schema for MEP system information.

MEP: mechanical, electrical, and plumbing.
Stream data are another major part of data utilized in energy management, and they are mostly collected by sensors and are generated continually in the form of time-series data. Each datum observed consists of two parts: the observation and the observer. The observer is the sensor that makes the observation and can be treated as relatively static data. The metadata of each sensor not only includes the property of the sensor itself, for example, the code, type, manufacturer, and accuracy of the sensor, but also the feature of interest that the sensor is observing, which can be expressed by the code of the space which the sensor is observing. The data schema for the sensor network can be expressed as in Table 8.
Data schema for sensor network.

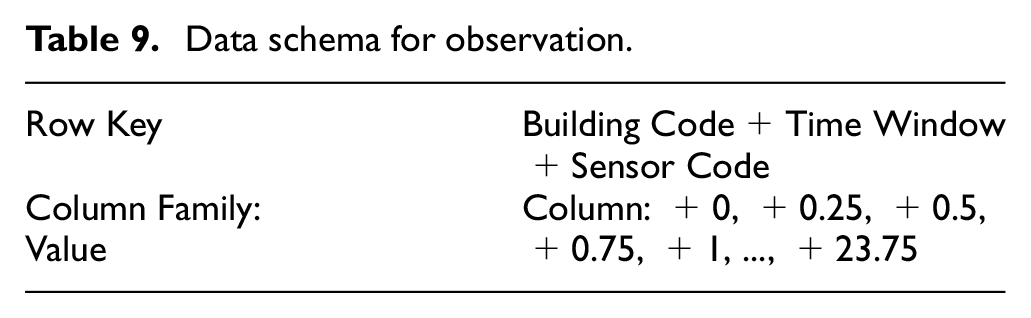
The observation is the result the sensor observes, and energy usage assessment and management often utilizes continuous time-series data collected within a certain period, efficient range query performance for time-series data is needed. There are two main ways to store time-series data using HBase, (1) each row represents one observation and (2) each row represents several observations in a time period. The first way performs a row insert on each datum arrival and returns a lot of rows of data on a range query, but it is suitable for data collected at random. In this study, sensors are collecting data in a predefined sampling rate, so the advantage of the second way can be obvious because it performs a row modify on each datum arrival and returns much fewer rows on a range query. Specifically, a 15-min sampling rate is agreed based on energy usage management demand, and each row stores data within 24 h a sensor collects. The data schema for observation can be expressed as in Table 9. Each row represents several observations of one sensor within a time window, and the row key is composed of the building code, sensor code, and the time window. For example, the time window in the row key can be 20190629 and the value in column “+0.75” stands for the data collected at 00:45:00 on 2019.06.29. In this way, one record can store observations in 1 day can reduce the rows of result in one query. Furthermore, building performance assessment application is more frequently querying all data collected in a certain time window rather than data collected by one sensor, time window comes before sensor code. If an application requests all data on 2019.06.29, one row of record including 96 pieces of data with time window of “20190629” in the row key is retrieved, instead of 96 rows of records, thus accelerates the query process.
Data schema for observation.
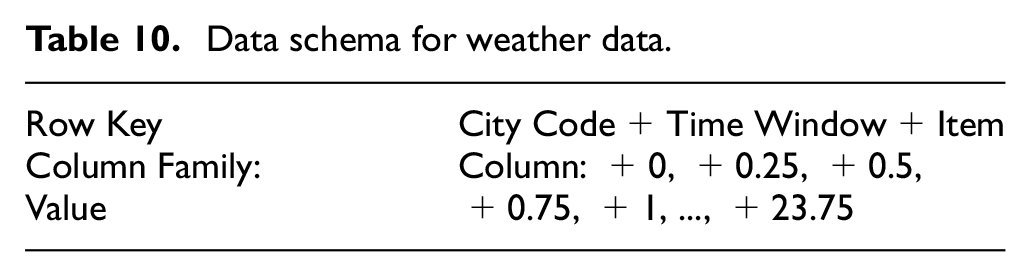
Besides, there are some data collected from an external source, for example, weather data, temperature, humidity, wind, and so on, can be obtained from service observatory provides. The data schema resembles that of the observation. Because each observatory provides the weather data of a site, all buildings on the site will share the data, the building code in the row key is substituted by city code, and the sensor code is also replaced by the name of the item. The data schema can be expressed as in Table 10.
Data schema for weather data.
Row key design
The row key is the identifier of each row and is like the primary key of each record in relational databases. Row key has to be carefully designed according to data characteristics and application scenario since HBase maintains data in lexicographic order by row key, 54 and scan a continuous segment of records would be more efficient than random records when executing a query.
In the table of building basic information, each row records the property of a building, so the row key is the building code which is composed of city code and serial number. Thus, the records will be sorted by place, which is beneficial when comparing buildings from the same place.
In the table of geometry and topology, BIM entities, and sensor network, each row records the property of an object, that is, space, a BIM entity, or a sensor. The row key for these tables consists of the building code and the code for the object. Thus, the records will be sorted by building, which is beneficial to extract information in a building.
In the table of observations, each row records the observation data from a sensor in a time window. The building, sensor code, and time window are all necessary to determine a row. The application often needs to extract the observation from multiple sensors of a building in a period of time. Therefore, the order of the three factors should be building code, time window, and sensor code.
NoSQL database automation
To cope with the problem that data requirement may change continually and eliminate the redundant work to generate data schema based on a new design, an automation process to generate a table in the database from data schema design is desirable. Taking this as a starting point, an XML file is maintained to represent the data schema. As is stated above, the data model in HBase follows the pattern of table → column family → column, each column identified by a row key, so the data schema XML file follows the form as in Figure 9. Tables can be generated by “create” statement in HBase shell, and the statements can be generated by analyzing the XML file.

Table creation command generated from data schema XML file.
Sharing the data: RESTful web service design and automation
Service design
REST style API design is becoming widely used in web services. REST is considered to be resource-oriented, in which each resource has a URL. It abstracts all interfaces to resource operations, and standard HTTP methods are used to represent operation methods. It has some advantages: simple unified interface, friendly to cache, so it has good interoperability. By making URL with the table name and the key of each row, every data row in the database can be well abstracted as resource, so we decided to design the APIs following REST design.
As a column-oriented key-value database, HBase process data by row keys of data rows. It doesn’t support SQL-like query, and can only retrieve a row by row key quickly or scan by a key range. For more complex get query, HBase provides some filters used with scan. According to the database schema design, row key consists of several parts in some table, so interfaces for getting all rows by a row key prefix are necessary. For time-series data, interfaces for getting data of a period are also necessary, and the service supports optional downsampling parameters. The web service can implement the two types of interfaces by scanning the database with prefix filter. In addition, the service provides interface for heating degree day (HDD) and cooling degree day (CDD) of a period based on weather data. As the result, the interfaces are expressed as in Table 11.
Basic interfaces.
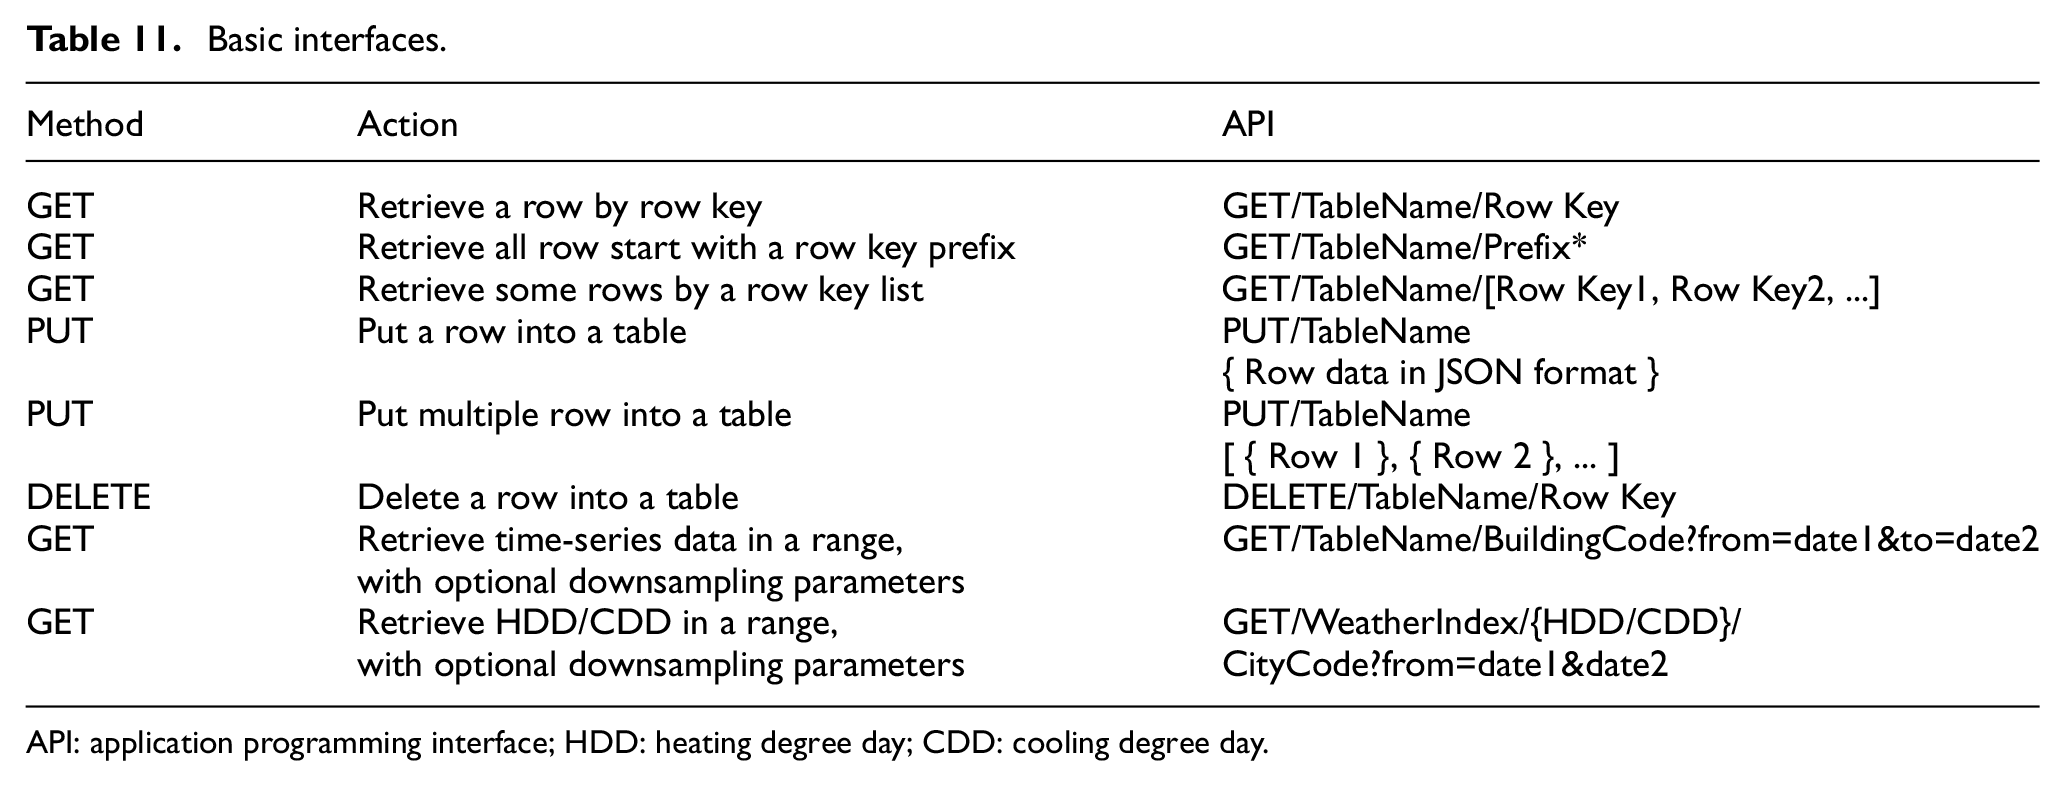
API: application programming interface; HDD: heating degree day; CDD: cooling degree day.
Cache
Cache is an important method to improve the performance of web services and reduce latency by saving data at faster place to prevent unnecessary slower I/O. At server-side, in-memory databases like Redis and Memcached store data in memory, which are much faster than disk-oriented database and usually used to build implement cache system. The web service in this research selects Redis as cache database and simply write data into cache database when writing into or reading from HBase. For time-series data, in-memory key-value database doesn’t utilize the time information of time-series data, so a cache manage policy is designed to improve the performance of cache system. If a service needs data of a period, the service checks the cache database first. If not whole period is hit, the service requests HBase for the part which is not hit.
Client-side cache is controlled by server through the cache control mechanisms provided by the HTTP protocol: by expire time, by the tag of the resource, and the last modified time. The web service can validate cached resource with the data and write time information maintained in in-memory database.
Data compression
Data compression can effectively improve performance in data transmission process, because encoded information will occupy fewer bits than its original form, which will reduce bandwidth requirements for network and transmission time. Compression can be either lossy or lossless, according to whether compressed information can be decompressed without distortion. Both lossless and lossy methods are utilized by the data service in this research.
Services in this research utilize JSON format to transfer data, but this format contains great quantity of duplicate words, so compression can save a lot of space. For web services, gzip is a good lossless compression format, widely supported by web browsers. Compressing data to gzip format is a widely used lossless method to compress HTTP responses. Tested with BIM data and stream data, in general, data length can shrink to 10%–20% if transferred in gzip format without changing the data. The service can adaptively compress response according to data type, data length, and whether client supports gzip.
Down sampling is a lossy compression method, which can reduce the amount of time-series data with loss of time resolution. For example, a 15-min sampling rate time-series data contains 96 points in 1 day, and about 2880 points in 1 month. By aggregating many points into one point for 1 day or 1 month, the amount of data points in a month can be reduced to 30 or 1. If user’s demand on stream data has a low time resolution, the service should conduct down sampling process with aggregation function to produce a much shorter response than the original data, which can both compress data and fit the user’s demand. In the post-processing flow shown in Figure 10, the data are first compressed by down sampling if the data are time-series and have a low frequency requirement. If the data are larger than 4 kB and the client accepts gzip format, the data will further be compressed with gzip to improve the transmit efficiency.

Data compression process.
Automation
Similar to the database, web service also needs an automation process to handle the changing data requirement. Metaprogramming is a programming method where programs can process other programs, which provides higher flexibility and work efficiency. With the XML files representing the data schema, a command-line generator is able to generate data model, basic web API code, type definition file for TypeScript, and API documentation. According to the process shown in Figures 11 and 12, the generator is developed to parse the XML files, extract data schema information, and generate target files. Basic APIs are for all users of the data service, and these APIs and data model are also used by other functions of the service. Type definition file can help with type checking in front-end development, and API documentation containing the description of API is necessary to API users.

Service generation process.

API documentation generation.
The deployment process of the web service can also be automated with containerization method. Containerization is a software development and deployment approach in which the application and its dependencies and configuration are packaged as a container image, which can simplify the deployment and improve its efficiency. By writing build commands into a Dockerfile script, Docker engine can automatically execute the commands to build the web service and pack all resources as a container image. When building a container image with the Dockerfile shown in Figure 13, Docker engine executes the build processes of the data service, then it produces a new container image with the target files based on a runtime image including dependencies. Applications in container run in isolated environment. Furthermore, the web service applications have good scalability. The web service can be quickly horizontally scaled by running many containers from the container image on any host operating system with Docker.

Dockerfile for containerization.
Implementation and case study
Implementation
This platform is implemented in a B/S (browser/server) architecture, and the server is deployed on a private cloud based on a Linux distribution called CentOS. The server side consists of quite a few nodes, part of them are for database service based on HBase database, and the other part is for data services, web services, and data analysis scripts. Main data services are developed in C# language based on a .NET Core platform. The front-end user interface provided by the data service is developed with TypeScript language. Some components for data relaying and data analysis are written in Python and JavaScript language because of plenty of library and high development efficiency.
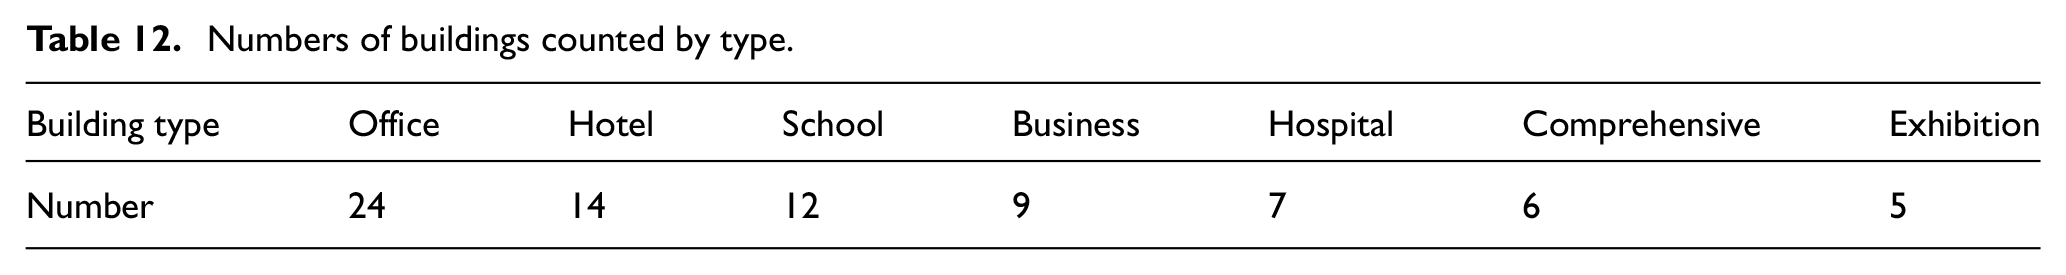
The platform is designed to support end user query rather than representation in real-time, so the user interface is updated on response; however, it is simple to modify into refresh itself by triggering at regular intervals. This platform has completed deployment and put in use in 2019. Relatively static and stream data from 77 buildings in 11 different cities in China have been collected in succession (see Table 12), and the electricity consumption data are from the existing sensor platforms that are already running in these buildings, and the smart sensing network based on Arduino is working as a supplement to collect indoor temperature, humidity, and lighting in two of the buildings. The home page of the platform is as Figure 14, showing a summary of the number, area, places, and sensors of these buildings. In addition, this platform is also collecting meteorological data provided by China Meteorological Administration.
Numbers of buildings counted by type.
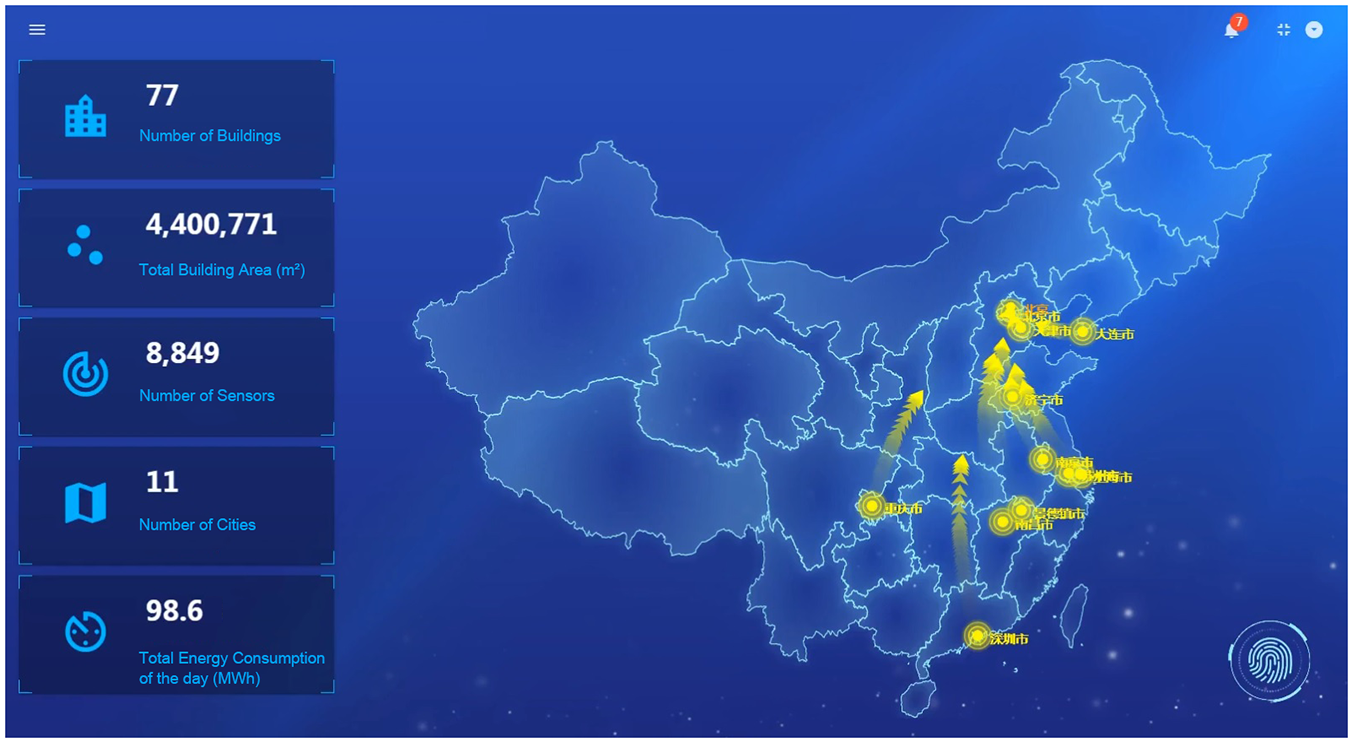
Home page of the monitoring platform.
In order to investigate and demonstrate the engineering value of the approach in a practical context, several case studies have been developed for several buildings on the platform.
Scenario 1: energy consumption summary
Shenzhuang multifunctional building is a commercial and office building located in Shanghai. This building has seven floors above ground and one floor underground with a footprint area of 9992 m2 and a height of 22 m. The sensor network in this building is distributed on each floor, collecting lighting, socket, and air-conditioning electricity consumption for each floor regularly. Stream data, including electricity consumption in total and of different usage, have been collected with an interval of 15 min since 2018. This building does not have a BIM model to be utilized, so building information, topology, and geometry are input manually.
The very first scenario for building performance management is to summarize the energy consumption in a period of time. After a user selects a building and a time period, the server processes the query, and the data are retrieved and plotted on a web page with Apache ECharts, a charting and visualization library for browser. Energy monitoring items can be selected in a combo box. Figure 15 shows the total electricity consumption from January 2018 to June 2019 of the building. Winter and summer are the electricity consumption peak because of air-conditioning, while spring and autumn consume less electricity relatively.
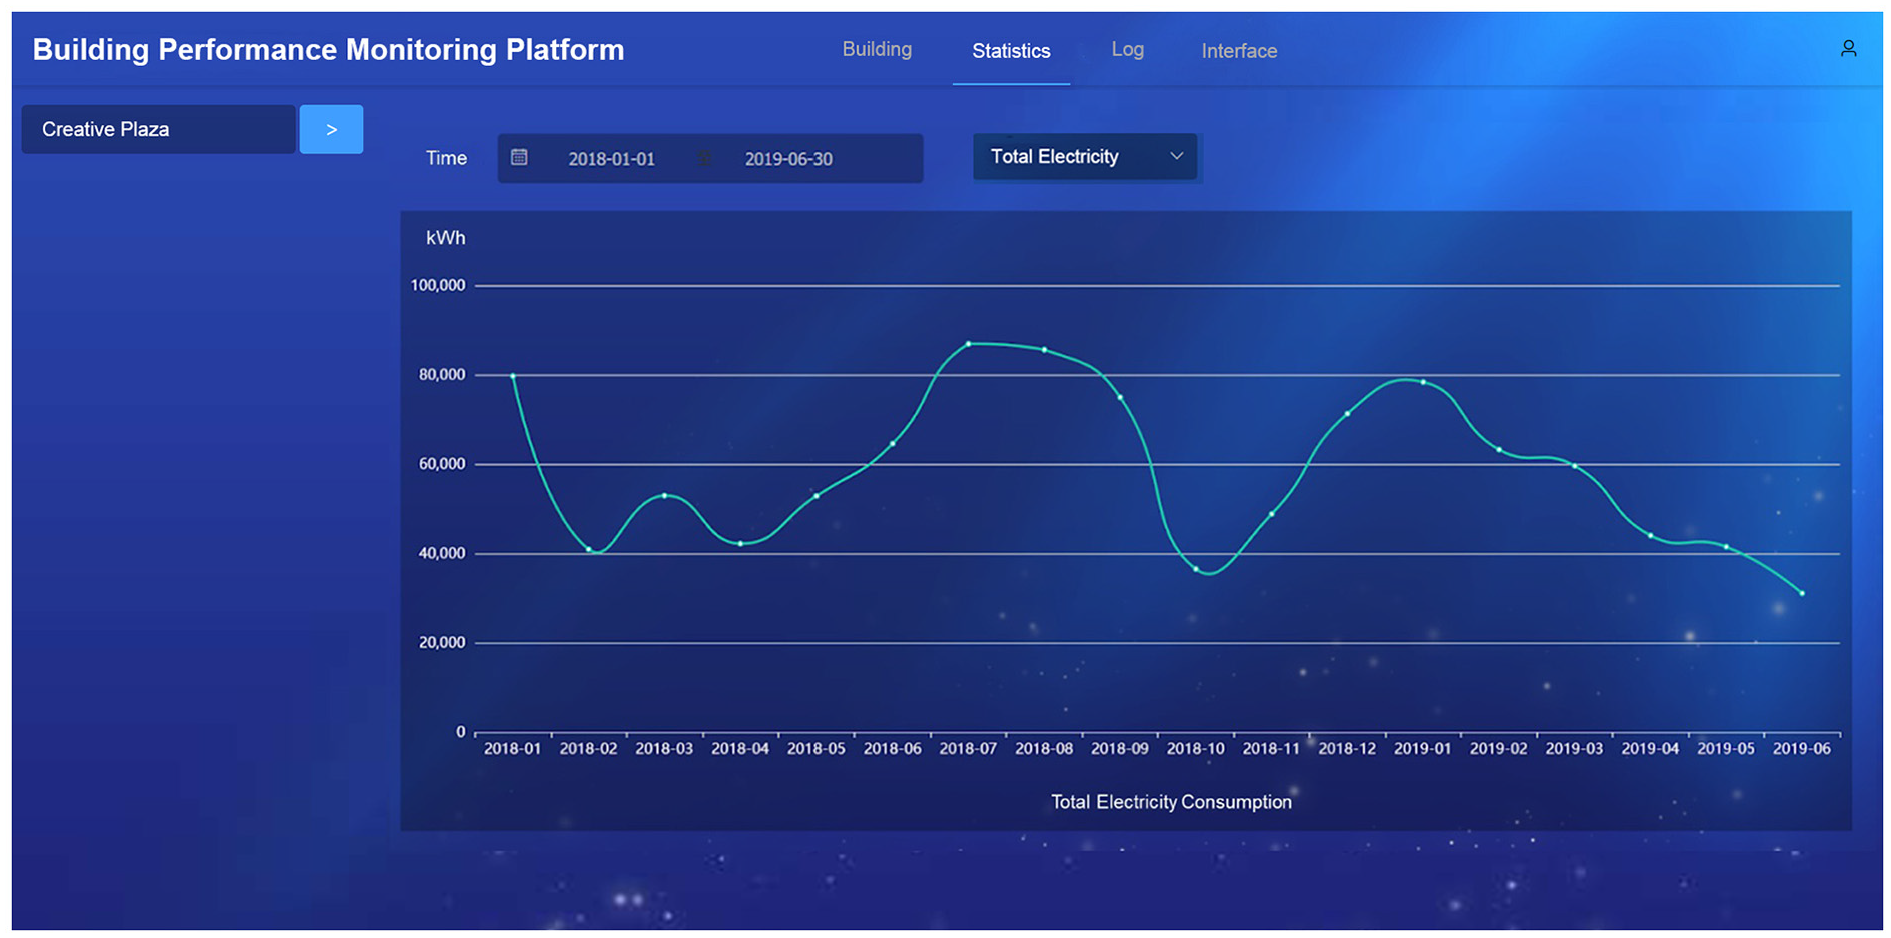
Energy consumption summary.
Scenario 2: interactive query of each space
Creative Plaza is an office building located in Dalian. This building has 16 floors above ground and 2 floors underground with a footprint area of 36,500 m2 and a height of 85 m. Sensors are installed on each floor to collect electricity consumption in total and by item, including lighting, socket, and air-conditioning, with a total of 54 sensors in the network. Three chiller systems are running in the building, and each has sensors collecting the running data. Stream data, including electricity consumption of the whole building and each story, have been collected every hour since 2018. This building has a BIM model for both the building and the MEP system. Therefore, the building information and topology tree were extracted from the BIM model.
Another scenario for building performance management into detail is to grasp the energy consumption in different spaces, and find out improvement solutions. This platform first parses BIM file into OBJ files, each representing the geometry of a building entity, including walls, slabs, curtain walls, windows, columns, and spaces. The web page then visualizes the building with three.js, a JavaScript library for three-dimensional (3D) display. Space entities in BIM file are related to energy consumption data of the space. In this case, users can take advantage of BIM and query electricity usage in a time period interactively by clicking corresponding space in the BIM model interactively. Figure 16 shows the lighting electricity consumption of the underground floor in December 2018.

Energy consumption interactive query with BIM.
Scenario 3: comparison between buildings
Another scenario is to make full use of the data of different buildings in the database and make a comparison on key performance index (KPI) to know how well is the building performance. In our case, the two buildings mentioned above are both office buildings, an energy consumption comparison can be made to indicate management efficiency of each building. The area of the two buildings is different, so the total electricity consumption per area per day can be an indicator to make the comparison. In the platform, energy consumption data are correlated to the geometry information, so a KPI calculation can be performed automatically without query manually. Figure 17 shows the comparison of total electricity consumption per area per day between the two buildings mentioned above in a week in July 2019. In the graph, Shenzhuang multifunctional building outperforms Creative Plaza. Besides the factor of energy management, these two buildings locate in different places, so meteorological factor may also lead to different energy usage.
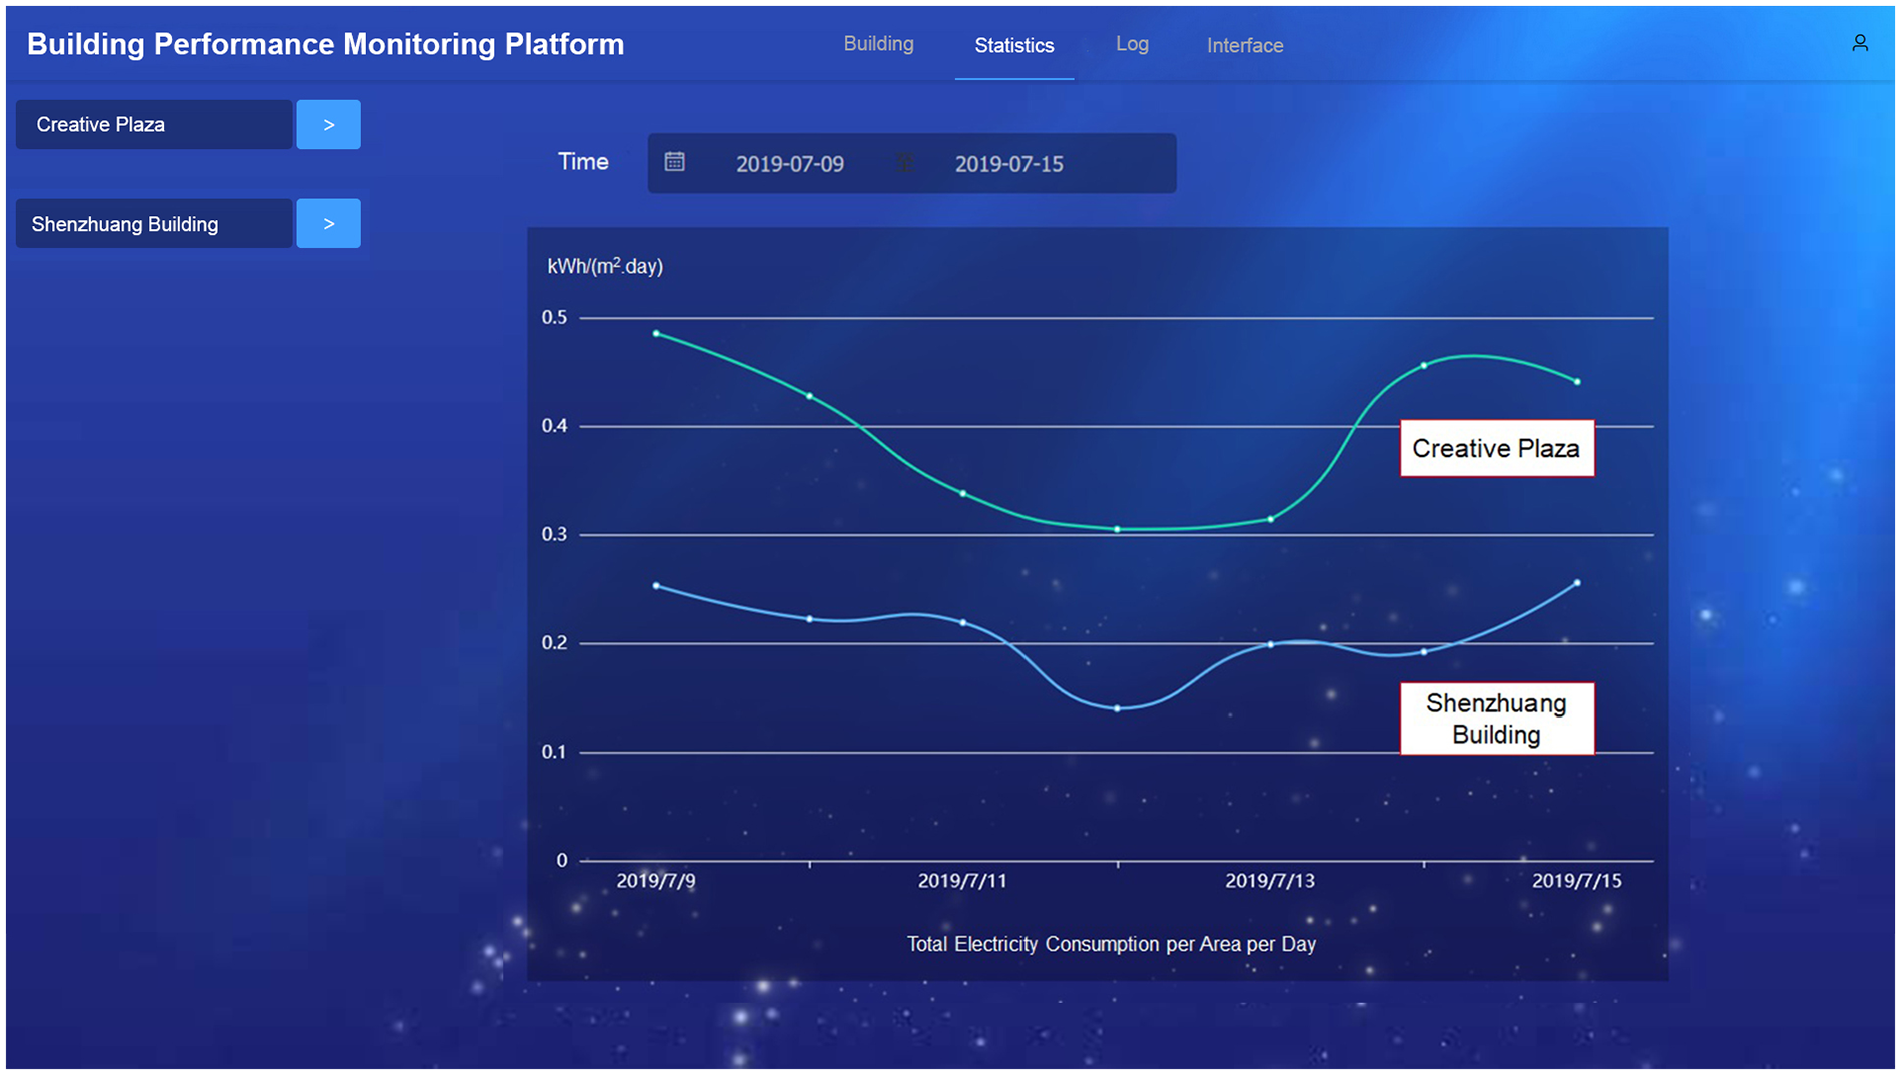
Energy consumption comparison between two buildings.
Scenario 4: data analysis support
To make full use of the big data in the database, data analysis, data mining, and machine learning can give more insight to the data. The platform can also provide data through web services as the input to train these models. For example, energy consumption prediction is seen as an important part of building performance management and there is already some research aimed at establishing models to describe and forecast energy consumption for buildings in different conditions.55,56 The service of this research can provide data input for the model training. Figure 18 shows an electricity consumption forecasting for July and August 2019 using a modular regression model, 55 where the data input is the electricity consumption from March to June 2019 and is shared by web service provided by the platform. The result shows a periodical change weekly and is seeing a rising trend in July and August.

Energy consumption forecasting application.
Discussion
In the cases above, four typical scenarios, summarizing, querying, comparing, and analyzing, are demonstrated with real project data. In each case, monitoring data related to selected building in a given period of time are retrieved from the database by RESTful web service and further processed and finally represented with a user interface.
The platform provides scalability in both software and hardware. Building energy monitoring requires different data for various demand and traditional database construction costs much time designing data schema and the schema is prone to changes afterward. In this research, NoSQL database HBase is adopted to support a flexible data schema. A relational database requires a detailed schema on table creation and schema changes are not recommended because it may cause data loss, conflicts between new data and old data, and application connected to the database may also cause errors. However, HBase only requires the definition of column family when creating a table, while columns are not defined and can be added afterward during application; thus, the minor change of data schema does not affect the table structure of the database.
Moreover, HBase can be deployed in a cloud environment—both private cloud or public cloud—to support horizontal scalability. In a single-node database, developer can only replace the hard disk of the current server when data volume surpasses the storage capacity. However, this can be expensive, and the server has to pause to finish the update process, and old data need to be transferred. Data loss and inconsistency may occur during the update. In this research, the platform based on cloud environment can simply add more servers in the cloud to store more data, and the cluster does not need to pause to finish the extension and old data also do not need to migrate to new servers.
The smart sensing network based on Arduino realizes the scalability in the aspect of hardware because it can be put into utilization after plugging in without complicated configuration. Current building monitoring or automation systems are mostly customized to connect a certain building project with the platform. While in this research, standardized web service for data collection is provided; thus, the sensor can be integrated into the sensor network without reforming the whole system.
System automation accelerates the process of both development and deployment in this research. This platform is deployed by Docker in the cloud environment, where the Docker contains the web service together with its dependencies. This also supports horizontal extension by simply copying the container to the added server without repeating the whole installation on each server.
The data schema in this research comes from application demand; however, the requirement may change over time, and the data schema has to change accordingly. Metaprogramming is adopted in this research to generate data table creation script, web services, and its documents automatically. Traditional development process requires developers to modify the whole platform according to the data schema change manually, which is time consuming and easy to cause system inconsistency. In this research, developers only change the data schema file, and the data table and the web service will be modified correspondingly, not only accelerating the whole process, but also avoiding the inconsistency between data schema, data table, and services.
The sensor network in this research consists of not only our smart sensor network based on Arduino, but also existing sensor platforms running in each building. To collect as much data as possible, the energy consumption data all come from existing sensor platforms, where our Arduino smart sensor network is deployed in two of the buildings to collect indoor environment information, including temperature, humidity, and lighting. Further work still remains to install our smart sensor network in more buildings to test the robustness of the sensor network working in a large scale.
Conclusion
Buildings consume a large proportion of energy in many countries and building performance monitoring has attracted extensive attention and data-based performance analysis requires the storage and sharing of big data. This research proposed a scalable BIM-based cyber-physical platform for building performance monitoring. Specifically, this platform is deployed in a cloud-based environment to store, manage, share, and utilize a wide variety of big data including relatively static data and stream data generated in real-time.
This research establishes a comprehensive BIM-based sensing information model for building performance based on ontology where the linkage of relatively static data and stream data are represented and understandable by a computer in the model, breaking the barrier between separate data silos of BIM and sensor network while maintaining the consistency and interoperability. The platform in this research provides scalability in both software and hardware to cope with the challenge in big data era. NoSQL database is adopted to realize flexible schema, and the platform is deployed with Docker to achieve horizontal scalability. The smart sensor network is also extensible to add more sensors to a building and the sensor network without reforming the whole system.
System automation simplifies the process of development. In big data era, application demand may change over time and the data requirement and schema may also change accordingly. This research utilizes Metaprogramming technique to produce table generation script, web service, and its document automatically based on a data schema. Developers solely change the data schema file, the data table and the web service will be modified correspondingly, avoiding the inconsistency between data schema, data table, and services.
In this research, the storage and sharing of the data are emphasized, but the analysis and mining of the large scale data can provide more knowledge and wisdom for building performance management. Data mining applications 57 as well as integration of spatio-semantic analytics 58 with sensing data are needed to make full use of the data collected.
Furthermore, the security of the data set is of great concern of the owner of the buildings, and BIM data often belong to the architect who designs the building in real cases, 59 while the owners of the case study projects are willing to share data for this research. Therefore, there might be an issue in terms of acquiring BIM data for building performance monitoring and the proper use of cryptography and authentication is also an important extension of the system.
Footnotes
Handling Editor: Hai Nguyen
Declaration of conflicting interests
The author(s) declared no potential conflicts of interest with respect to the research, authorship, and/or publication of this article.
Funding
The author(s) disclosed receipt of the following financial support for the research, authorship, and/or publication of this article: This work was funded by the National Key R&D Program of China (grant no.: 2017YFC0704200). Dr. Lin was also supported by the Beijing Natural Science Foundation (no.: 8194067) and the Natural Science Foundation of China (no.: 51908323).