
Abstract
Objective:
Vertebral stenting is a valid treatment for posterior stroke. However, the outcome and prognostic factors in the Asian population of vertebral stent are not clear. This study was performed to investigate the quick effect and plasticity alterations of left vertebral artery stenting treatment and to explore the underlying electroencephalogram biomarkers for the prognosis.
Method:
Electroencephalogram default mode network activity, serum brain-derived neurotrophic factor, and basic neuropsychology estimations were obtained from nine male left vertebral artery stenosis patients who underwent left vertebral artery stenting 24 h before and after left vertebral artery stenting therapy.
Result:
The beta-1 (13–24 Hz) electroencephalogram field power of the pre–left vertebral artery stenting group was significantly higher compared to that of the post–left vertebral artery stenting and control group (p < 0.05). The significant different standardized low-resolution brain electromagnetic tomography brain areas of beta-1 band Brodmann areas are 17R, 17L, 18R, 18L, 22R, 22L, 37R, and 37L. The nonliner lag ratio–based functional connectivity analysis showed global increase of connectivity in beta-1 standardized low resolution brain electromagnetic tomography network. Serum brain-derived neurotrophic factor did not show statistically significant changes during groups.
Conclusion:
Electroencephalogram default mode network provided a functional aspect of left vertebral artery stenting patients, and the beta-1 band power and distribution alterations could be candidate measurements for the plasticity alterations and prognosis evaluation.
Keywords
Introduction
Vertebral and/or basilar artery stenosis occurs in approximately 20% of patients with posterior circulation ischemic. 1 There is a lack of accumulated knowledge on the optimal treatment for vertebral stenosis compared to symptomatic carotid stenosis. The synthesis of international trials, such as stents and active medical management to prevent recurrence of intracranial artery stenosis (Stenting and Aggressive Medical Management for Preventing Recurrent Stroke in Intracranial Stenosis (SAMMPRIS)), elucidated the advantages of therapies as endarterectomy, and stent could be adopted for selected patients. 2 Even group studies showed stent does not reduce the risk of stroke but still could not exclude a benefit from stenting for vertebral stenosis patients for the long term.3,4
Neuroimaging methods such as magnetic resonance imaging (MRI) and computerized tomography (CT) are the primary methods used to evaluate brain injury as stroke. 5 However, the use of these technologies is limited by time resolution, patient collaboration needs, and high cost. Electroencephalogram (EEG) is an effective alternative: a noninvasive, easy-to-use technique characterized by high temporal resolution but low spatial resolution. The patient’s subcortical stroke has an asymmetrical distribution of alpha-power activity and delta-activity. 6 EEG was positively associated with post-operative stroke. 7 However, the conclusion was in a lack of exclusion of the effects of anesthesia.
Ongoing EEG interference has been confirmed in the electroencephalogram default mode network (EEG-DMN) from closed eyes to closed eyes. EEG-DMN 8 refers to the stationary state of the spatial distribution of the spectral EEG power field. Raichle 9 proposed the original concept of hemodynamic DMN, which produces a brain that consciously rests when the individual does not care about the outside world. There is sufficient evidence that no separate EEG band analysis can reveal neurophysiological information on EEG activity. 10 Besides EEG, DMN is further used for cerebrovascular reserve assessment and using hypercapnia such as CO2 to manipulate a. 11 In this study, the vertebral stenting–related changes of brain function in EEG-DMN were examined. The spectrum-specific analysis and standardized low-resolution brain electromagnetic tomography (sLORETA) connectivity construction could screen the neuronal plasticity alterations in the left vertebral artery stenting (LVAS) patients. Also serum brain-derived neurotrophic factor (BDNF) could be used to explore the underlying neuronal plasticity alterations and EEG biomarkers for the prognosis.
Method
Subjects
Patients with post-circulating transient ischemic attack (TIA) or non-disabled stroke and VA stenosis were considered to have >50% aneurysm with stenosis. Nine patients with ischemic stroke were enrolled in the Department of Neurology, Hainan Provincial General Hospital, (male 57.2 ± 10.3 years old, male 57.2 ± 10.3 years old) who underwent LVAS. The inclusion criteria were as follows: (1) LVA >50 and (2) stenosis over 21 days of onset. Exclusion criteria were (1) anti–central nervous system (CNS) drugs, (2) diagnosis of epilepsy, (3) post-operative radiotherapy for nasopharyngeal carcinoma, and (4) history of heartbeats or severe complications.
Nine age-matched male volunteers were identified as controls because of vertebral artery stenosis and recent cerebral infarction. If the subject has any physical/mental problems or medication, they are excluded from the study. According to the Helsinki Declaration, each subject is subject to written informed consent and ethical recognition; the local ethics committee approved the study. Routine screening for risk factors for stroke, including hypertension, hyperlipidemia, hyperhomocysteinemia, diabetes, and history of alcohol and tobacco were screened. Carotid ultrasound and transcranial Doppler (TCD) were used to detect atherosclerosis and intracranial artery stenosis.
Neurological and psychometric tests
Before EEG, all subjects completed Edinburgh’s hand questionnaire. The right-handed subjects were enrolled. In addition, subjects were tested 24–48 h before and after the interventional stenting for the neurological function (National Institutes of Health Stroke Scale (NIHSS)), 12 cognition (Montreal Cognitive Assessment (MoCA), 13 Mini-Mental State Examination (MMSE)), 14 Personality by means of State-Trait Anxiety Inventory (STAI), 15 Simplified Coping Style Questionnaire (SCSQ), General Self-Efficacy Scale (GSES) 23, and Fear Survey Schedule (FSS).
LVAS
The possible presence of vertebral artery stenosis must be radiographed and confirmed by two experienced neuroradiologists. The following imaging methods are acceptable: magnetic resonance angiography (MRA) (based on the North American Symptomatic Carotid Endarterectomy (NASCET) Preferred Enhanced Scan as digital subtraction angiography (DSA)), enhanced CT angiography, and intraarterial digital subtraction of blood vessels. In intra-arterial DSA, the vessel diameter (R) is separated by the normal vessel diameter (d) at the distal end of the normal vessel diameter. The following formula is used to calculate the degree of VA constriction. Thrombolytic therapy for Thrombolysis in Myocardial Infarction (TIMI) grade. 16 The LVA access was obtained in these nine patients through the femoral artery approach. After femoral artery access was obtained, heparin was administered according to the standard protocol (100 U/kg). A guide catheter through the support of a 0.035-inch stiff guidewire was placed in the vertebral artery with fluoroscopic visualization and applicable roadmap guidance if necessary. 4 After carefully maneuvering the soft guidewire past the lesion and balloon angioplasty, a self-expanding bare stent was delivered to a proper position under the guidance of roadmap. Endovascular procedures were performed on nine patients under local anesthesia with continuous hemodynamic monitoring according to the standard hospital protocol for carotid artery stenting (CAS) procedures. The diameter of a stent could be the same as or bigger than that of the normal artery but no more than 1 mm. 17
The recommended antiplatelet therapy during surgery is to use clopidogrel and aspirin at least 12 h prior to surgery. It is recommended that clopidogrel and aspirin were continued for at least 1 month after surgery and “post-standard” antiplatelet therapy to prevent stroke.
EEG protocol
All EEG recording measurements were taken in the EEG collection room (temperature: 22°C–28°C), which was also quiet. The patient and control group were placed in a semi-sitting position and were asked to close their eyes during EEG recording. EEG recordings and BDNF samples were collected 24–48 h before and after the LVAS. All the participants were asked to remain completely relaxed.
EEG recordings
EEG is recorded between 8:00 and 10:00 a.m. 8 Place the patient and control group in a semi-sitting position and ask to close your eyes when recording the EEG. During the experiment, 32 channels of EEG recordings were continuously collected using an Ag/AgCl electrode and continuously collected for 2 min using the A.N.T. EEG system (A.N.T. Enschede, the Netherlands). The electrode is fitted with an electrode cap and a 10/20 montage system. All EEG channels are recorded in the average reference, but all EEG channels are re-referenced on both sides of the line (mean M1 ± M2, connected to the earlobe reference). The EEG data acquisition frequency is 512 Hz, and the electrode impedance is kept below 5 kΩ. 8
Offline and region of interest connected network analysis of EEG data
Offline analysis of EEG data and regions of interest (ROI) have been previously described in detail by Chen et al. in Fujisawa et al., 18 and Yu et al. 19 The EEG data are sampled at 512 Hz, and the electrode impedance is kept below 5 kΩ. The EEG data were filtered offline using a 0.5–100 Hz bandpass filter and subjected to travel time (2 s each), linear removal, and artifact rejection pre-processing. The artifact suppression method is excluded in a period having a large (greater than ± 80 μV), DC offset, and flicker. The “bad electrode” is replaced by an extrapolated virtue value from an adjacent electrode. After rejecting artifacts, fast Fourier transform (FFT) analysis on each set of EEG data (3-sepoch) were performed. Seven EEG band power (μv 2 ) included delta (0.5–3.5 Hz), theta(4–7 Hz), alpha-1 (7.5–9.5 Hz), alpha-2 (10–12 Hz), beta-1 (14–24 Hz), beta-2 (24–34 Hz), and gamma(35–45 Hz). EEG was analyzed 60 times every 2 min. Under each study condition, approximately 50–58 expiration periods were further analyzed, referred to as “average.” Calculate the effective period using Letswave 7 software under MATLAB environment (ANT After (FFT)). Calculate the total mean of the FFT topographic map on the three-dimensional “quasi-reality” using the spline interpolation function 20 but not according to individuals’ spectral characteristics. 21 Calculate the effective period using ASA 4.9 software (ANT After (FFT)). Calculate the total mean of the FFT topographic map on the three-dimensional “quasi-reality” using the spline interpolation function.22,23 The median (not mean values, due to non-normality of the samples) values of seven absolute band powers was calculated.
sLORETA and functional network analysis
sLORETA was used to estimate the intracerebral electrical sources that generated the scalp-recorded activity in specific bands. sLORETA computes electric neuronal activity as current density(A/m2) without assuming a predefined number of active sources. The sLORETA solution space consists of 6239 voxels (voxel size: 5×5×5mm). Beta-1 band sLORETA signals were compared between post-LVAS and pre-LVAS patients, p < 0.01 was considered statistically significant. sLORETA and functional network analysis were performed by sLORETA software. ROI making 2 of Brodmann areas 84 in beta-1 band were selected for connectivity analysis. The nonliner lag ratio was adopted for the connectivity. 24 According to the statistical significance analysis of the Brodmann region, the Brodmann area ROIs 25 and connectivity analysis 26 were selected. BrainNet Viewer software was used to visualize the functional connections of the brain network 27
BDNF examination
Serum BDNF was detected by (BDNF) (enzyme-linked immunosorbent assay (ELISA), ELISA kit and AMOKO), 48 h before and after interventional treatment at −20°C. The human BDNF level in the sample was determined by a kit. The BDNF antibody was added to the well of the microtiter plate, and after incubation, biotinylated anti-BDNF antibody was added, and then combined with streptavidin–horseradish peroxidase (HRP). After complete incubation and washing, the 3,3′,5,5′-tetramethylbenzidine (TMB) substrate solution was added. The TMB substrate turned blue, a sulfuric acid solution was added at the end of the reaction, and the color change was measured under a photometer placed at a wavelength of 450 nm. The BDNF concentration in the sample is then determined by comparing the dose of the sample to a standard curve. 28
Statistic analysis
Statistical analysis for each of the seven EEG bands from 32-ch of EEG and the site/electrode of power was isolated with its value calculated. The raw values, that is, without logarithmic transformation of EEG values, 29 were used for a straightforward interpretation of EEG values. Repeated measures analysis of variance (RM-ANOVA) was used to assess the variation of EEG spectral powers in the pre- and post-LAVS only if the data sets were confirmed to have a normal distribution. If not, the Friedman RM-ANOVA on ranks was applied. In the post hoc comparisons, the paired t-test was used to analyze differences between the pre- and post-LAVS study parameters including the BDNF level. EEG spectral powers and dependent t-test was carried out to compare differences between groups (the LAVS in the experiment group and healthy control group) and to study parameters whether the data sets were confirmed to have a normal distribution. If not, the Wilcoxon test for nonparametric comparison of ranks was performed. A value of p < 0.05 was considered statistically significant for all tests. The statistical program SigmaStat (SPSS Inc., Chicago, USA) was used for statistical measure. A value ofp < 0.05 was considered statistically significant for all tests.
Result
Subjects
As shown in Table 1, nine male patients with LVA stenosis were enrolled in the study. Two patients showed chronic dizziness, one patient reported neck pain, one patient presented as TIA, and five patients had stroke. All the patients showed multi-artery stenosis, and six of them had the right vertebral artery stenosis or physical small. Eight patients were diagnosed of atherosclerosis, the risk factors ranked in hypertension, hyperlipidemia, hyperhomocysteinemia, diabetes mellitus, and personal history as smoke and alcohol. One patient had stroke recurrences at 24 months post-LVAS. In the control group, there were no obvious stenosis tested by TCD examinations.
Patient demographic information.
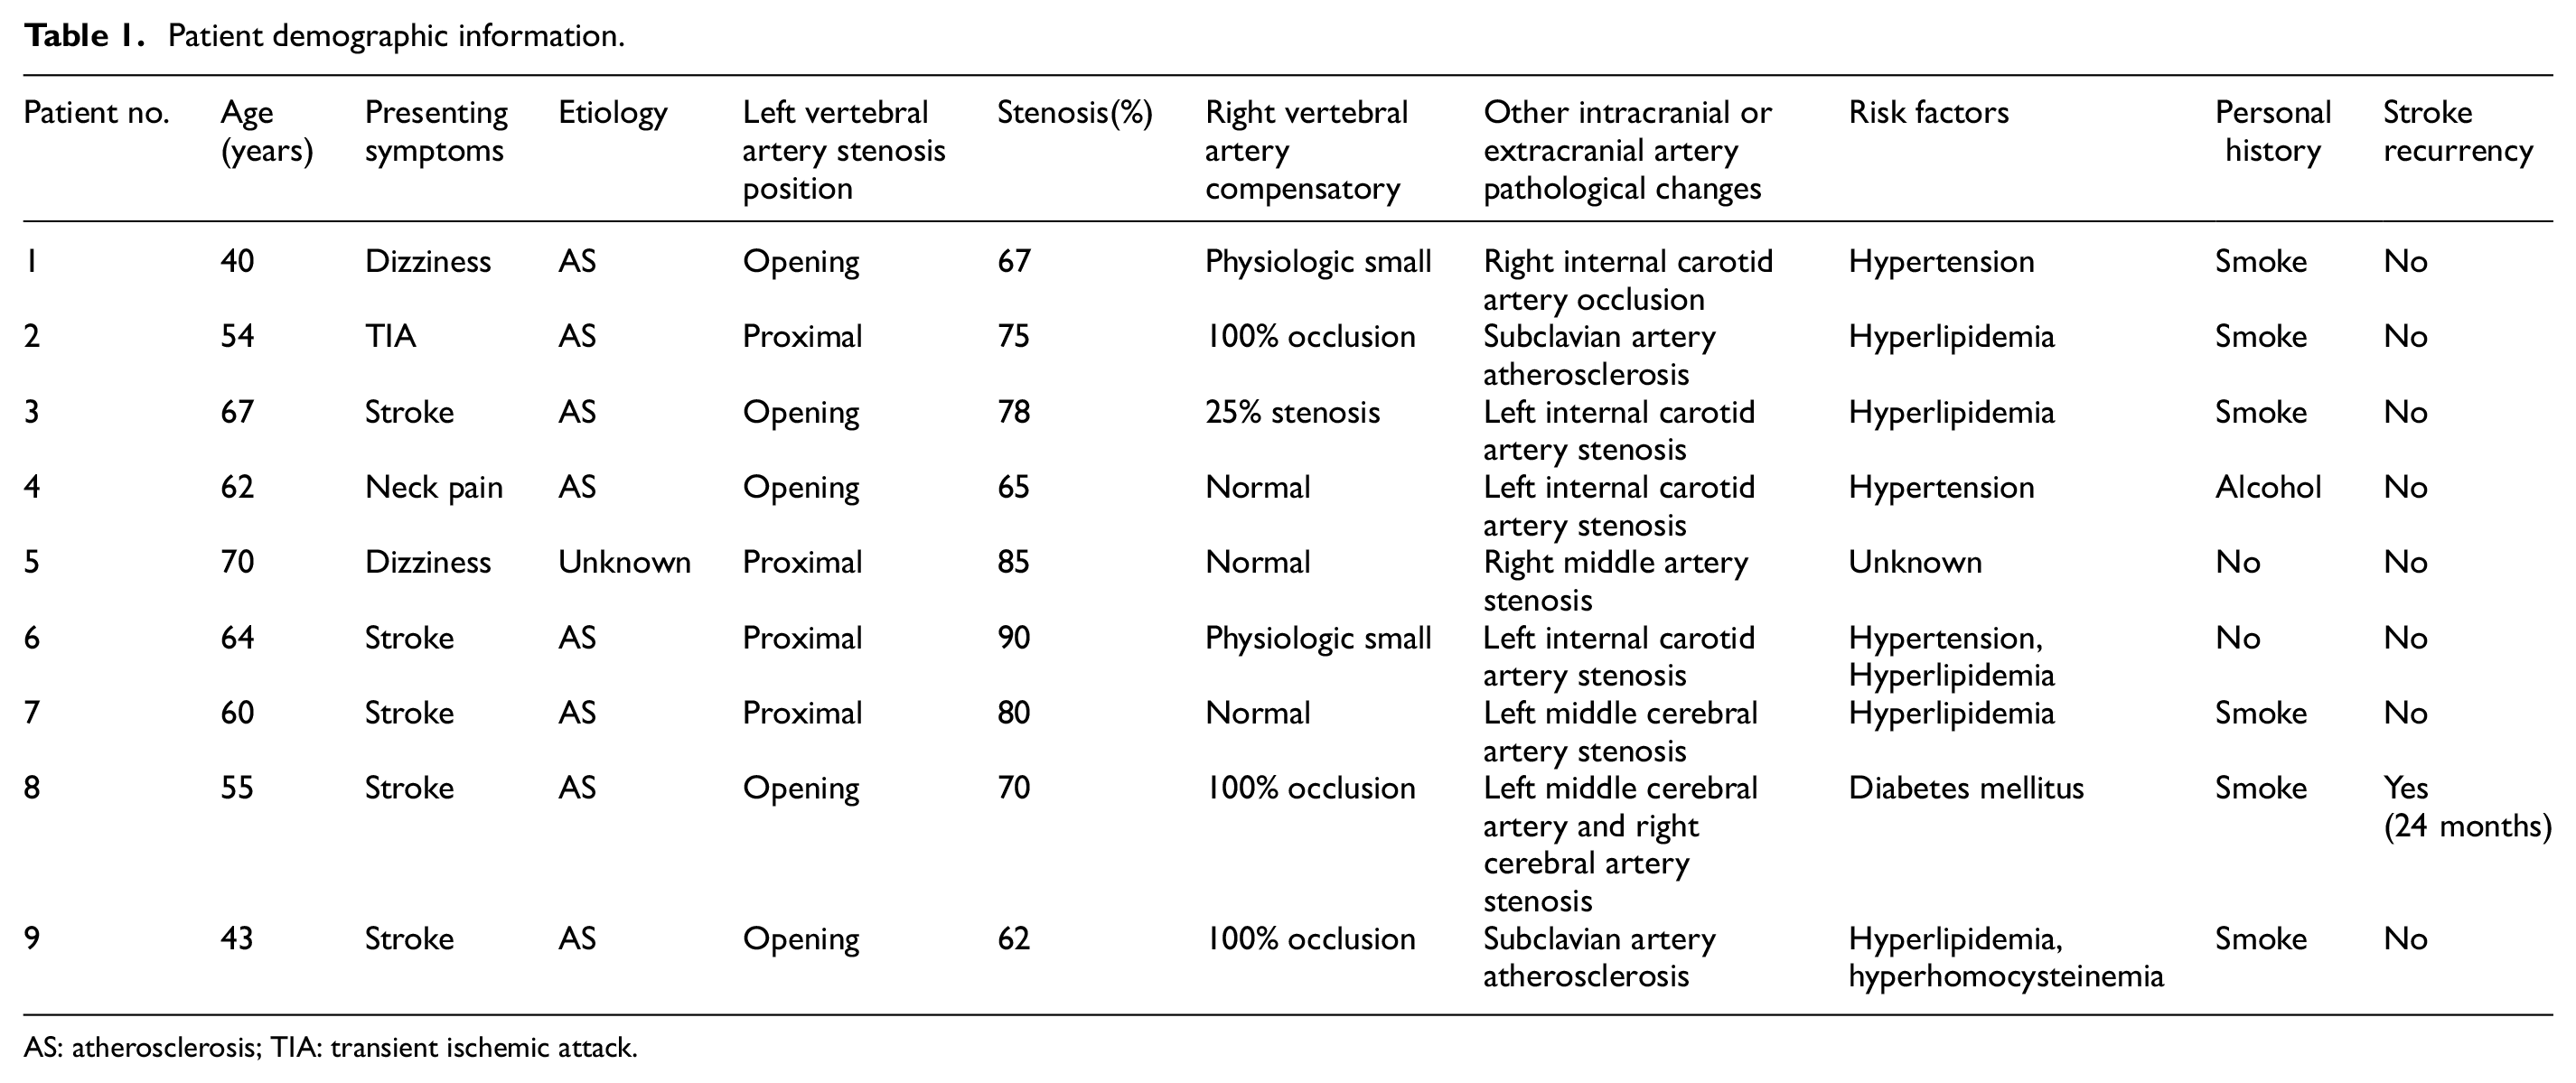
AS: atherosclerosis; TIA: transient ischemic attack.
Neurological and psychometric tests
All nine patients and nine age-matched control subjects were right handed. There were significant differences(p < 0.05) between pre- and post-LVAS patients and control group with respect to neurological test including NIHSS, MoCA, and MMSE. There were no significant differences (p > 0.05) between pre- and post-LVAS patients and control group with respect to psychometric tests as STAI, SCSQ, GSES, and FSS performed in this study. Table 2 presents the demographic characteristics of the subjects.
Demographic characteristics of subjects during groups.

SD: standard deviation; LVA: left vertebral artery.
NS indicated no significant difference between groups.
Pre-LVA stent, Post-LVA stent and control group were significantly different.
LVAS
Endovascular revascularization was performed on nine patients on the opening or proximal of LVA by LVAS. Recanalization was complete in five patients (TIMI Grade III) and partial in four patients (TIMI Grade II). The DSA pre-LVAS showed the stenosis on the opening of LVA, which was recovered post-LVAS (Figure 1). The LVAS can improve the cerebral blood supply as showed in Figure 1((a), (c) presents LVA stenosis under DSA; (b), (d) presents after the LVAS under DSA, which achieved the revascularization TIMI Grade III).
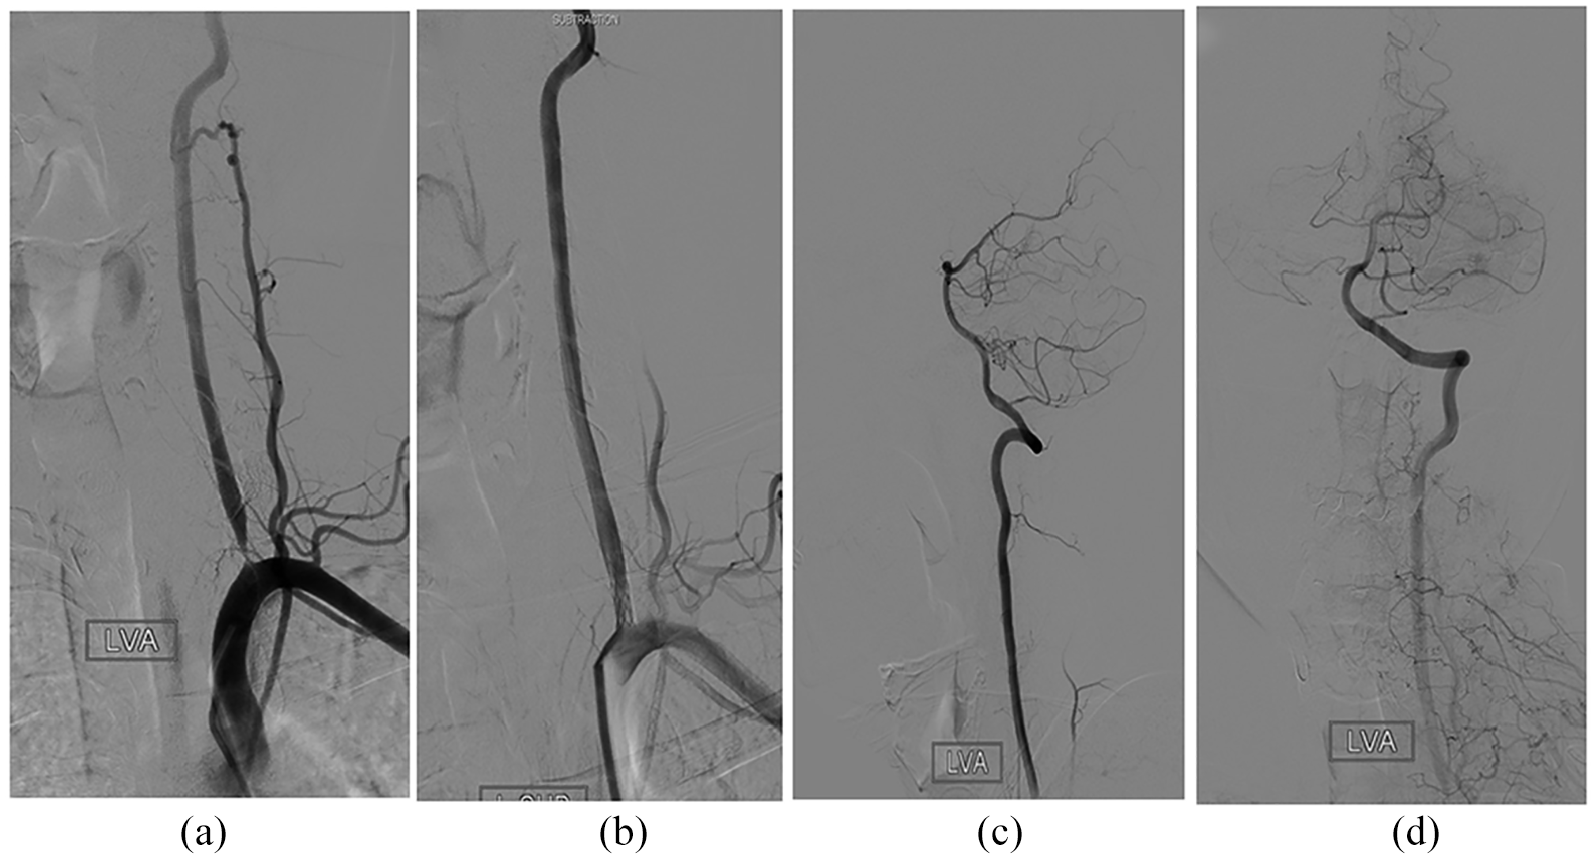
DSA presentations of LVAS. The procedure of LVAS could improve the cerebral blood supply. (a, c) presents left vertebral artery stenosis under DSA and (b, d) presents after LVAS under DSA.
EEG data
The median (not mean values, due to non-normality of the samples) values of seven absolute band powers were shown in Table 3. Apparently, theta, alpha-1, alpha-2, and beta-1 bands showed the discrepancy between groups; however, only beta-1 bands power achieved statistical significance. The field power of beta-1 EEG field power in pre-LVAS group was significantly higher compared to that of post-LVAS and control group (p < 0.05); the beta-1 EEG field power of pre-LVAS was significantly higher compared to that of control group (p < 0.05).
Friedmann’s results for each of the three measurements for EEG 7 bands absolute spectral powers (median, IV).

EEG: electroencephalogram.
NS indicated no significant difference between groups.
Pre- and post-stent group significantly different.
Pre-stent and control group significantly different.
Post-stent and control group were not significantly different.
sLORETA of beta-1 band
In addition, topographic spectral mapping (shown in Figure 2) directly indicated that beta-1 field power was found to be over the posterior area, temporal lobe. The significant alterations in pre- and post-LAVS Brodmann areas were 17L,17R, 18L, 18R, 19L, 19R, 22L, 22R, 37L, and 37R (p < 0.01).

Significant altered beta-1 sLORETA distribution in post-LAVS compared with pre-LVAS. The significant different sLORETA brain areas of beta-1 band Brodmann areas 17R, 17L, 18R, 18L, 22R, 22L, 37R, and 37L in post-LVAS compared with pre-LVAS (p < 0.01).
Functional connectivity
sLORETA based functional connectivity network analysis showed. ROI making 2 of Brodmann areas 84 were selected for connectivity analysis. Nonliner lag ratio was adopted for the connectivity analysis (shown in Figure 3). The result showed global increase of brain areas in beta-1 sLORETA (shown in Figure 4). Meanwhile, for the significant altered sLORETA brain areas in beta-1, the connectivity showed increased connectivity between left and right occipital lobes but decreased connectivity between left and right temporal lobes.

Beta-1 sLORETA functional connectivity of post-LVAS compared with pre-LVAS patients. The result showed global increase of brain areas in beta-1 sLORETA. Red line indicated increased connectivity, while blue line indicated decreased connectivity.
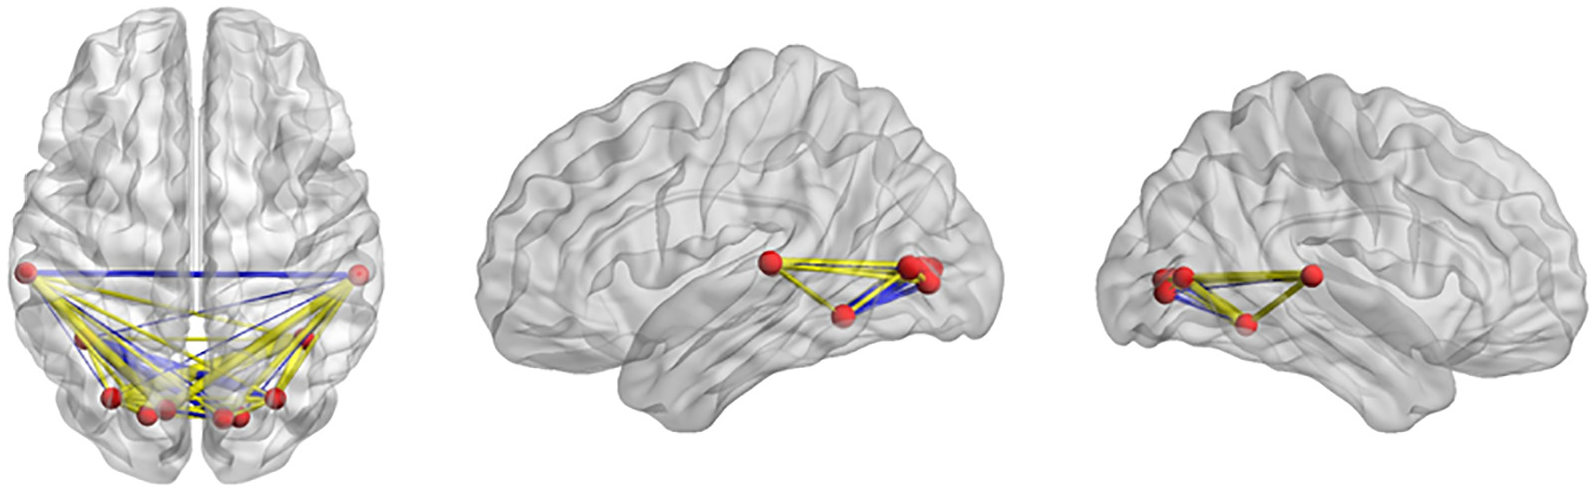
Functional connectivity in beta-1-specific altered sLORETA areas. For the significant altered sLORETA brain areas in beta-1, the connectivity showed increased connectivity (yellow line) between the left and right occipital lobes but decreased connectivity (blue line) between the left and right temporal lobes.
BDNF
For the LVAS group, pre-LVAS serum BDNF increased compared with that of post-LVAS decreased and control subjects; post-LVAS serum BDNF decreased compared with control subjects, the pre-LVAS BDNF values (p > 0.05; shown in Figure 5).

Serum BDNF alterations after LVAS. Serum BDNF increased compared with that of post-LVAS decreased and control subjects; post-LVAS serum BDNF decreased compared with control subjects, the pre-LVAS BDNF values (p > 0.05).
Spearman correlations
The post-LVAS theta band field power was significantly negatively correlated with post-stent MMSE scores (r = −0.773, p < 0.05). As shown in Figure 2, all the other bands’ field power were not significantly related to different parameters of the patients and control subjects.
Discussion
Carotid endarterectomy (CEA) and CAS is the mainstay of therapy, with the aim of relieving stenosis and preventing thromboembolism. Few studies were carried out to examine the EEG characteristics for the stenting patients. Throughout the literature, periodic lateralized epileptiform discharges (PLEDs) were observed to be related to intraoperative stroke due to reperfusion after stenting in a previously damaged brain area in a 58 male CAS. 30 Similarly, the significance of EEG changes at CEA, the changes presented as asymmetric changes and delta attenuation; however, those changes had great individual variations and did not exclude general anesthesia influence. 30 No literature had reported vertebral stenting EEG alterations. In this study, we investigated the quick alterations in DMN-EEG 24 h before and after vertebral artery stent instead of before and during the operations. In this group, nine patients underwent local anesthesia instead of general anesthesia according to the operation requirements, which substantially decreased or avoided the synchronous intervention of consciousness and EEG alterations. Moreover, psychological tests, including STAI, SCSQ, GSES, and FSS, were used to evaluate and exclude the transient intervention factors caused by mood fluctuations.
Beta-1 alterations both in field power and distributions attained statistical difference for the pre-LVAS group compared with the post-LVAS group, and the post-LVAS group compared with the control group. The beta-1 intensity increased in the pre-LVAS group compared with the control group and was attenuated in the post-LVAS group, but still did not back to normal in the control group, which indicated the beta-1 alterations in both aspects in intensity and distribution were caused by blood supply alterations. Our previous study showed during blood donation, alpha-1 at the parietal–frontal area on human EEG-DMN transiently with no lasting effect at the post-donation period. 31 In this study, the reverse process of cerebral blood supply did not observe alpha-1 alterations but alpha-2 changes, even alpha-2 did not attain statistical differences. Similar changes existed in delta band spectra, delta intensity was increased in the pre-LVAS group compared with the control group, and the changes were attenuated in the post-LVAS group, which were in accordance with previous cerebral stroke patients EEG alteration. 6 In the distribution aspect, high-frequency bands of beta-1 (14–24 Hz) are distributed at bilateral temporal and prefrontal areas in young DMN-EEG that our previous study had established. 8 In this study, the prefrontal areas beta-1 intensity decreased in the pre-LVAS group compared with the control group; however, the occipital lobe beta-1 intensity was higher in the pre-LVAS group compared with the control group. The distribution changes could not be explained by cerebral blood supply since the decrease of beta-1 in occipital lobe was following vertebral supply recovery. The redistribution and improvement in other EEG band spectra might be a candidate explanation. However, the truth is more complex than it appears. The significant alterations in pre-LAVS and post-LAVS Brodmann areas were 17L,17R, 18L, 18R, 19L, 19R, 22L, 22R, 37L, and 37R (p < 0.01). The beta-1 sLORETA Brodmann area ROIs were put into functional connectivity analysis (Figures 3 and 4). The result showed global increase of brain areas in beta-1 sLORETA. Meanwhile, for the significant altered sLORETA brain areas in beta-1, the connectivity showed increased connectivity between the left and right occipital lobes but decreased connectivity between the left and right temporal lobes. Even the underlying mechanism of the phenomenon is not clear, the independent temporal lobe function might be a beneficial reaction of blood supply recovery. Compared with MRI-based functional networks, EEG-based functional network developed much latently, for the complexity and ambiguity of the sensory cortical coordinates. 32 The MRI combined EEG scalp electrodes position analysis shed great light in this research field 33 along with the calculated method, most of them are derived from MRI.25,34,35 In our analysis, we also put those well-defined ROIs into the functional analysis 26 to trace the changes beyond the underlying blood supply alterations. However, the beta-1 alterations did not show tight correlation with classical DMN regions (i.e. posterior cingulate cortex (PCC) and anterior cingulate cortex (ACC)). The reasons for this result could be partially derived from the patients’ selection of special treatment, which means the arterial supply alteration weighed more in the EEG alterations. Another reason for the mismatch is from the restriction of the EEG recording and the current analysis method.
In this study, we further examined the serum BDNF level in the pre-LVAS stenting group, post-LVAS, and control group. The result is on the contrary of the expectation, since after the cerebral posterior blood supply, the BDNF level was thought to be increased; however, in the examination, the BDNF level was increased in pre-LVAS compared with the control group, and the changes were attenuated in post-LVAS, but still did not back to normal. The changes did not attain statistical differences but could be taken into account; statistical difference is expectable for the larger amount of the subjects. Rhythmic amplitude changes reflect rhythmic changes in the excitation of a population of neurons. The result indicated that in the cerebral ischemic state as vertebral stenosis, or pre-LVAS, the cerebral raised its neuronal tension level like increased BDNF, when the blood supply recovered, the tension decreased as the BDNF. The increased tension level could lead to irregular neuronal oscillations like beta-1 increase in occipital lobes in the general background of whole-brain blood supply decrease related pathological changes of delta and alpha-2 changes. This result is in accordance and not in the contrary of circulating BDNF increase in stroke patients leading to better improving the long term 28 which indicated the protection mechanism generated by our brain. At the same time, we noticed that instead of beta-1 alterations, the theta band field power were post-stent MMSE scores (r = −0.773, p < 0.05); this is in accordance with slow wave including delta- and theta-related severity and poor outcome of cerebral low metabolism caused by cerebral ischemia or other etiologies.
In conclusion, EEG-DMN provided a functional aspect of vertebral artery stent patients, and the beta-1 and theta band energy and distribution alterations could be a candidate measurement for the neural plasticity alterations and prognosis evaluation. Based on the present findings, future research should include larger group to attain statistically significant changes, the comparison of right vertebral artery stent and specific carotid as right and left internal carotid artery stent or CEA could provide a whole screen of the cerebral plasticity alterations detected by DMN-EEG and circulating BDNF levels.
Footnotes
Acknowledgements
This study was supported by multidepartment cooperation, including Dr. Xia M, Prof. Xun Lei for their instruction for the data analysis.
Handling Editor: Xing Chen
Authors’ contributions
All authors listed have contributed sufficiently to the project to be included as authors, and all those who are qualified to be authors are listed in the author byline. Y.L. helped in acquisition of data, analysis, and interpretation and critical revision of the manuscript for important intellectual content. X.H. helped in surgical treatment management of the patients, analysis, and interpretation of the manuscript for important intellectual content. E.Z. helped in analysis and interpretation of data analysis and interpretation of data. Y.D. helped in surgical treatment management of the patients. Y.H. helped in analysis and interpretation. A.C. helped in study design, conceptual guidance, analysis, and interpretation and critical revision of the manuscript for important intellectual content. S.H. helped in analysis and interpretation. T.L. helped in study concept and design, analysis, and interpretation of data. G.W. helped in study concept, acquisition of data, analysis, and interpretation, critical revision of the manuscript for important intellectual content, and study supervision.
Declaration of conflicting interests
The author(s) declared no potential conflicts of interest with respect to the research, authorship, and/or publication of this article.
Ethical approval and consent to participate
Written informed consent and ethical approval were obtained from each subject in accordance with the Helsinki Declaration; the study was approved by the local ethical committee.
Funding
The author(s) disclosed receipt of the following financial support for the research, authorship, and/or publication of this article: This work was supported in part by grants from the Key Science and Technology Project of Hainan Province (ZDYF2018141). The funding supported the collection, analysis, and interpretation of data. The funders had no role in the design and conduct of the study; collection, management, analysis, and interpretation of the data; preparation, review, or approval of the manuscript; and decision to submit the manuscript for publication.