
Abstract
This work is aimed at studying the mechanics characteristics of the self-anchored suspension bridge with extra-wide concrete girder during girder erection and system transformation. First, the determination and implementation processes of reasonable completion state were introduced briefly, taking the Hunan Road Bridge as the background project, which is the widest concrete self-anchored suspension bridge in China currently. Then, the ANSYS beam-type finite element model and field monitoring data were integrated to investigate the cable system evolutions during system transformation. Finally, the global refined finite element model was established using solid element to consider the shear lag effects in extra-wide girder. The measured data show that the cable displacements in tensioned domains were characterized by weak coherence and contraflexure characteristics. The longitudinal and transverse stresses of extra-wide girder distributed unevenly along transverse direction. The maximum shear lag coefficients of girder at completion state reached to 1.3. Moreover, small transverse compressive stress, or even the transverse tensile stress reaching to 1.80 MPa, appeared in the top plate segments. The measures including the arrangement optimization of transverse prestressed tendons and monitoring point redistribution were given. The research can provide references for the structural designing and safety control of the similar bridges.
Keywords
Introduction
The development potentials of self-anchored suspension bridge in practicality and landscape were just paid attention in China until 2001. Then, the construction of self-anchored suspension bridge developed rapidly in China along with the accelerating urbanization process and growing traffic demands. More than 50 self-anchored suspension bridges were built, including the Lize Bridge, Sanchaji Bridge, and Pingsheng Bridge.1,2 In addition, the competitiveness of concrete self-anchored suspension bridge is becoming more significant among the bridges of medium-span because of the concrete economics and elegant appearance.3,4 More than 30 concrete self-anchored suspension bridges were built since 2002, which usually work as the city transportation hubs. The girder width might be increased to 50 m or even more to meet the traffic volume growth. The spatial forced state and shear lag effect of the extra-wide box girder should be fully considered. Moreover, the bridge safety during life cycle is related to the lives of thousands of people and important social impacts. The mechanics behavior evolutions of cable and extra-wide girder during construction are necessary to be studied, which can provide important feedback and references for the structural design, health monitoring, and construction control.
The tower and girder of self-anchored suspension bridge are first erected during construction, the cables are anchored on the girder ends, and then the completion state can be achieved through system transformation. To date, researchers have widely investigated the hanger tensioning schemes relying on actual bridges.5,6 However, there are few studies on the feedbacks provided for the determination of hanger tensioning scheme through analyzing the mechanics characteristics of cable system during system transformation. 7 As for the spatial mechanics behaviors of wide box girder, the main research methods on the shear lag effects include the classical analytical method based on elastic theory, analogy-bar method, functional variation method based on the minimum potential energy principle, 8 numerical method based on finite element (FE) simulation, 9 model experiment method, and state space method.10,11 Rao, 12 Ebeido, 13 and Takahashi et al. 14 studied the influences on the concrete box girder bridge brought by the stiffness and interval of crossbeam, web thickness, and girder bending curvature based on the FE analyses. The results showed that the plane beam-type model is not suitable for the structural design compared with the spatial beam-type and solid FE models for wide box girder. Lertsima et al.15,16 proposed the empirical calculation formula of the girder deflection at middle section considering the shear lag effects. Hua et al. 17 studied the shear lag effects in wide box girder under construction state and vehicle loads based on the beam-type FE model and solid FE model, respectively. In summary, the abovementioned researches were concentrated in the influences on the single-box continuous girder bridges with single room or multi-rooms brought by the crossbeams, transverse prestressed tendons, and shear lag effects; and the girder widths were smaller than 40 m. There are few studies on the spatial mechanics behaviors of the extra-wide concrete self-anchored suspension bridge during construction. Moreover, usually, only the separate refined FE model of wide box girder was established in present researches to study the longitudinal and transverse girder stresses of self-anchored suspension bridge. The cable system was simulated by applying the equivalent external forces at the anchoring points. However, the external cable forces obtained by the calculation results of beam-type FE models contain errors during the application on the separate FE model of girder. Moreover, the self-balancing and non-linear characteristics of self-anchored suspension bridge during system transformation were ignored.
In this article, the ANSYS FE simulation and filed monitoring data of Hunan Road Bridge were integrated, which is currently the widest concrete self-anchored suspension bridge in China. The implementation process of reasonable completion state was introduced. The cable displacement characteristics and hanger force evolution during system transformation were studied. Moreover, the global refined FE model of the bridge was established. The extra-wide girder, crossbeams, and anchorage areas were simulated using the solid elements. The connections of cable system and prestressed tendons with girder were simulated accurately through establishing the anchoring plates. The monitoring data were combined to study the spatial mechanics behaviors of the extra-wide box girder during the prestress tensioning process, system transformation, and completion state. The transverse distribution laws of the longitudinal and transverse girder stresses were analyzed. The shear lag effects in the extra-wide box girder at completion state were evaluated. The conclusions and reference basis beneficial for the structural design, determination of hanger tensioning procedure, distribution of health monitoring point, and structural safety control of the similar extra-wide concrete self-anchored suspension bridges were drawn.
Hunan Road Bridge and structural health monitoring system
The Hunan Road Bridge18–22 is located in Shandong Province in China. The bridge layouts are shown in Figures 1 and 2. The cross sections of the key components are shown in Figure 3. The cube hole with the edge length of 0.45 m at the middle of bottom girder plate is the anchoring area of hanger. The 37 pairs of hangers are numbered as DS1N–DS37N and DS1S–DS37S on the north and south sides, respectively. In addition, the hangers DS1 and DS37 are rigid. The hangers DS8, DS9, DS29, and DS30 belong to the flexible hangers of type B. The remaining hangers belong to the flexible hangers of type A. 22
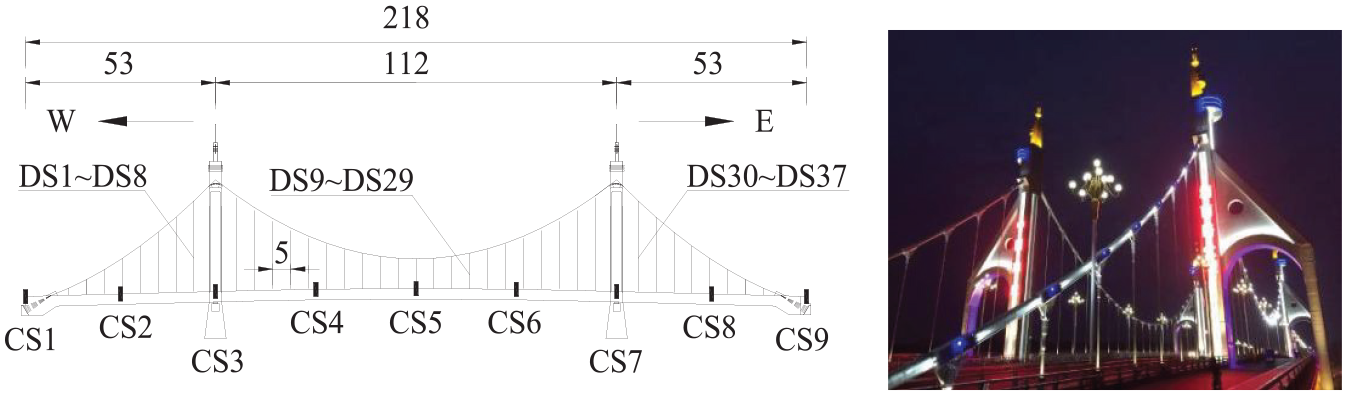
Layout of the bridge (unit: m).
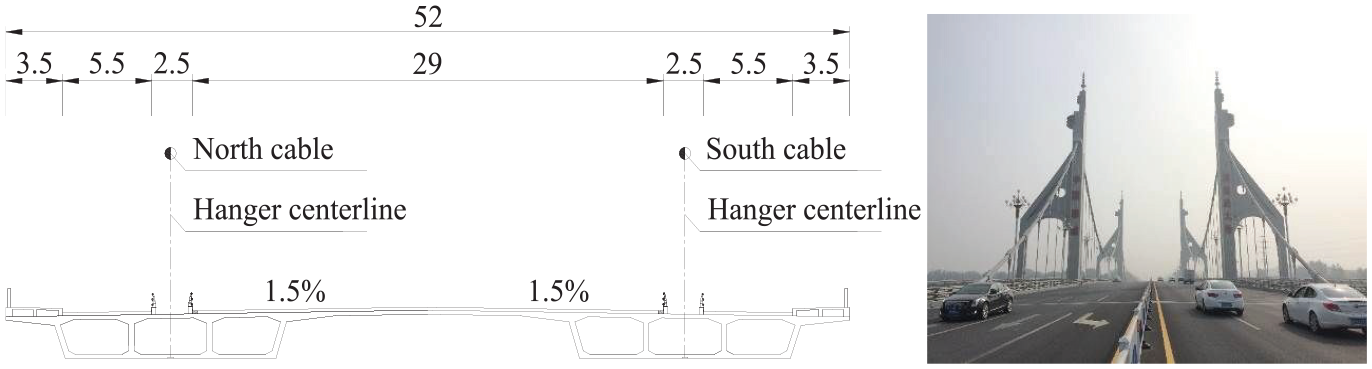
Extra-wide girder (unit: m).

Cross section of key component: (a) main girder, (b) tower, (c) hanger, and (d) cable (unit: cm).
The structural health monitoring (SHM) system for Hunan Road Bridge was established during construction and after completion,23–25 as shown in Figure 4. The sensing variables contained the ambient temperature, structural temperature field, and structural responses. The structural responses included the deformations, stresses, and vibration characteristics of key components. 19 The measuring points of longitudinal girder stress, adopting the vibrating wire strain gauges, were fixed on the top and bottom longitudinal reinforcements of girder webs. The distances from the measuring points to the upper and lower edges of the section of the girder are 65 mm. The measured data of structural deformations and stresses will be used in the following chapters.
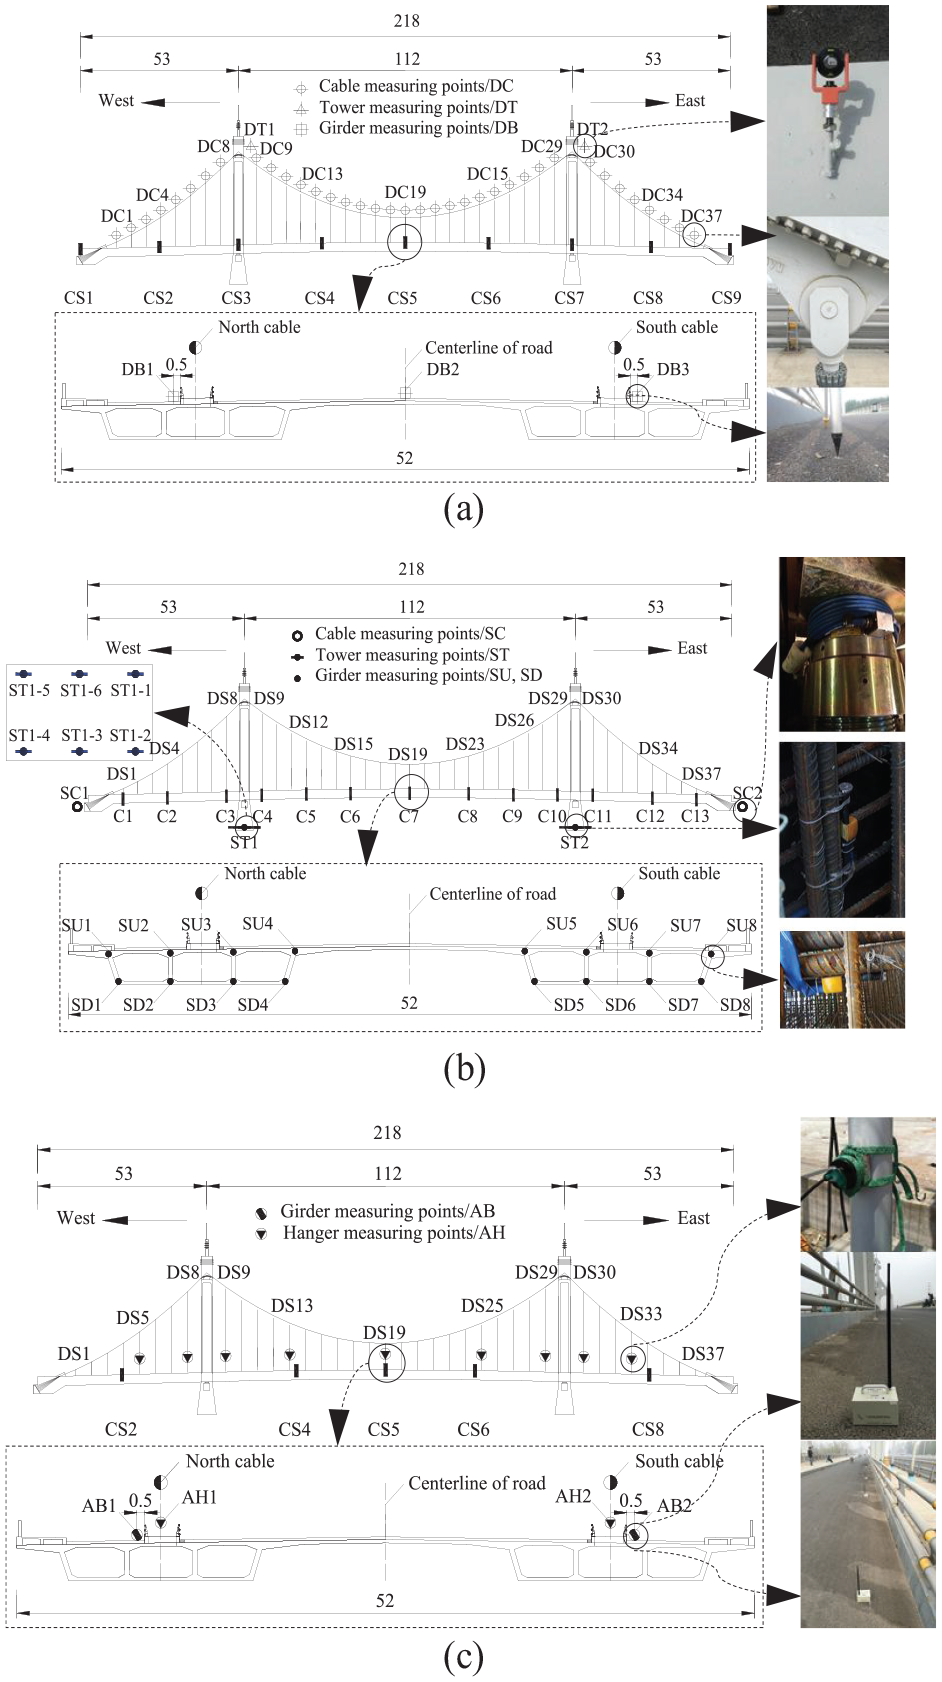
SHM system of Hunan Road Bridge: (a) deformation, (b) stress, and (c) vibration characteristic (unit: m).
Determination and implementation of reasonable completion state
The reasonable completion state is the basis of safety and construction control for Hunan Road Bridge. However, the determination of reasonable completion state is complicated and affected by the unique force transmission and geometric nonlinearity in cable system. Moreover, the influences on the structural internal force and alignment brought by concrete shrinkage and creep should be calculated precisely. The synthesis algorithm for the reasonable completion state determination was proposed 22 through integrating the cable analytic program BNLAS SGKZ2000 developed by Southwest Jiaotong University 26 in China and beam-type FE analysis using ANSYS software.
Beam-type FE model
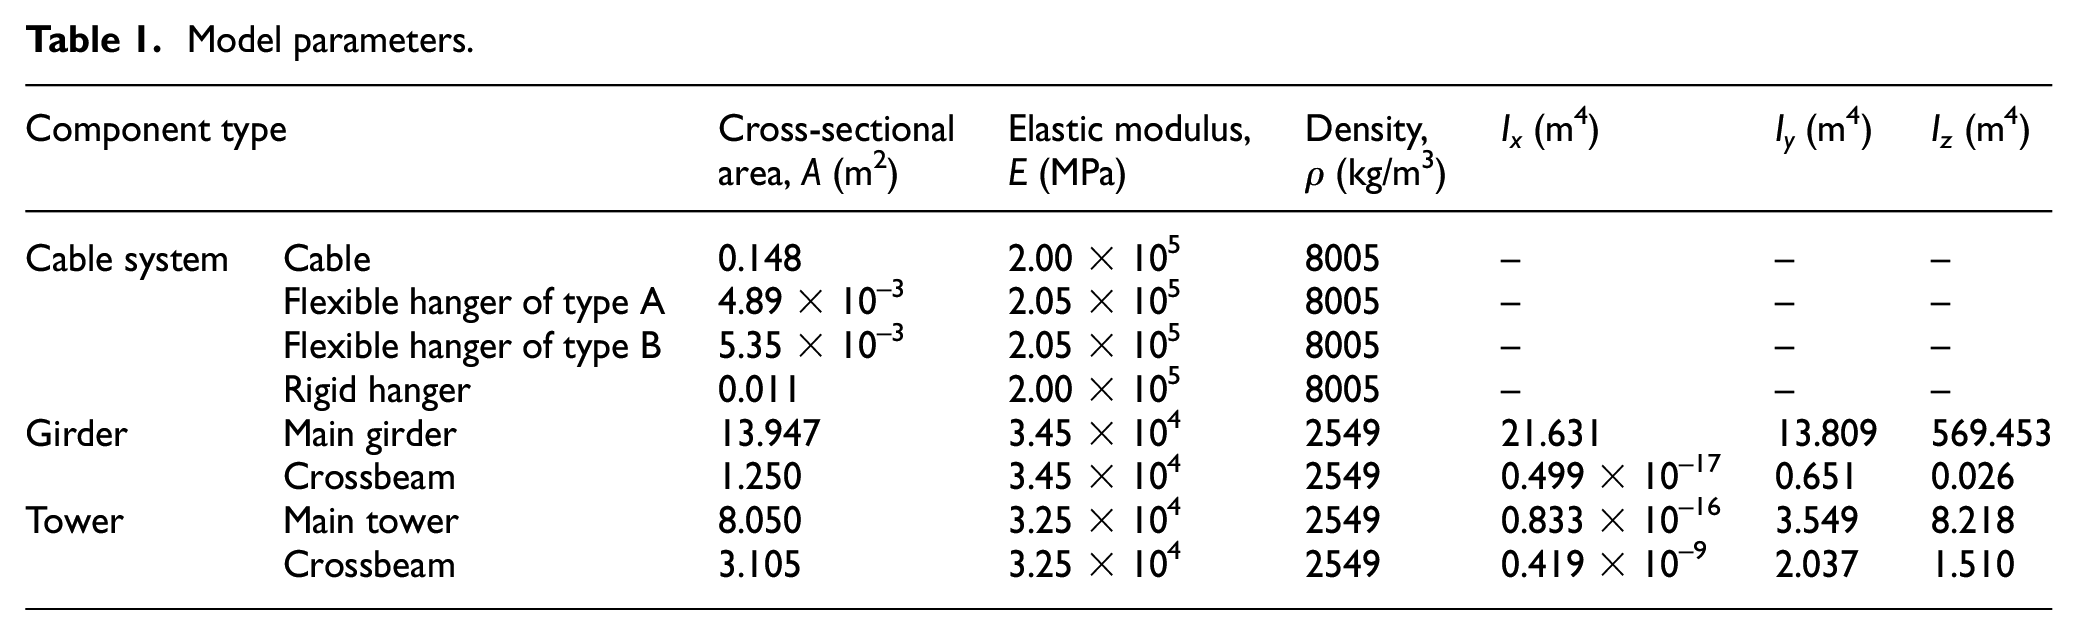
The beam-type FE model of the bridge was established using ANSYS software as shown in Figure 5. The structural sectional properties and material parameters are shown in Table 1. The Timoshenko beam element (BEAM188) in ANSYS was adopted to simulate the tower, crossbeam, and girder. The tension-only link element (LINK10) was used to simulate the cable, hanger, and prestressed tendons. The internal forces of the cable, hanger, and prestressed tendons were applied by defining the initial strains. The additional quality element (MASS21) was adopted to simulate the weights of deck pavement, saddle, clip, and approach bridge. The nodes of tower bottoms were consolidated completely. The degrees of freedom (DOFs) between the girder, tower, and the approach bridge were constrained according to the actual bearing types. As shown in Figure 8, the arrows represent the sliding directions of bearing. The bearings between the girder and the crossbeams at west and east towers are transverse unidirectional sliding bearing and bi-directional sliding bearing, respectively. 22 The refined simulation method for cable saddles were proposed.22,27

Spatial beam-type FE model of the bridge.
Model parameters.
Determination of reasonable completion state
The CEB-FIP 90 model and age-adjusted effective modulus method were integrated to predict the concrete shrinkage and creep effects. The determination method of reasonable completion state can be referred to Zhou et al. 19 The relationship between the initial instantaneous elastic deformation and final concrete creep deformation is approximately linear when the stress of concrete does not exceed 40% of the ultimate strength. The superposition principle can be used to calculate the strain caused by the stress applied step by step. The relationship between the strain increment and stress increment during the time interval of (ti, ti − 1) caused by concrete shrinkage and creep is shown in equation (1)
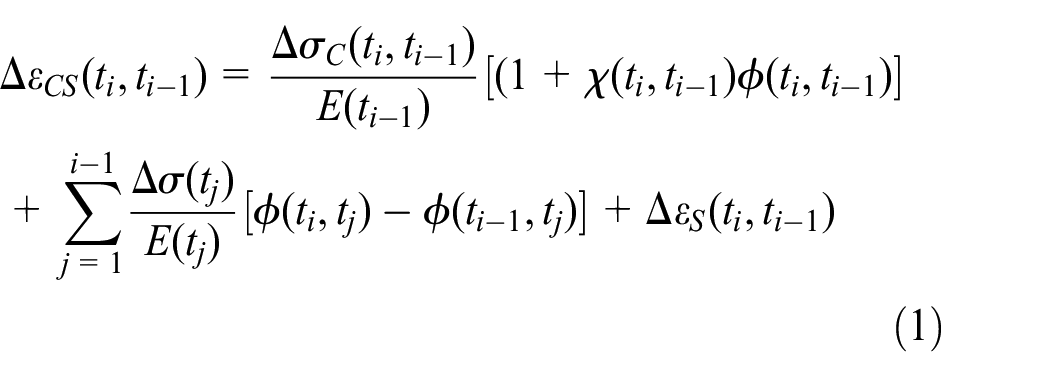
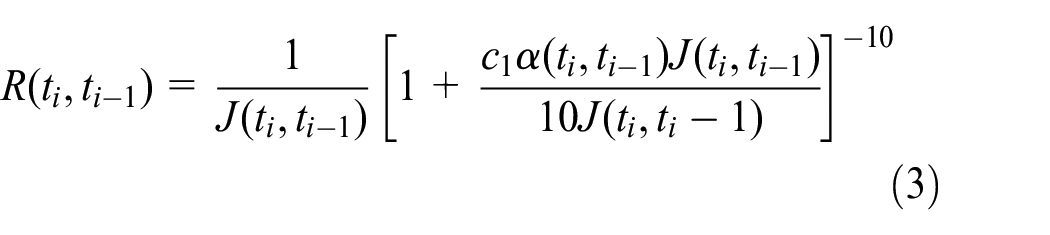
where C and S represent the creep and shrinkage effects, respectively. ΔσC(ti, ti − 1) is the stress increment caused by creep. ΔεS(ti, ti − 1) is the strain increment caused by shrinkage. E is the elastic modulus of concrete. χ(ti, ti − 1), ϕ(ti, ti − 1), and R(ti, ti − 1) are aging coefficient, creep coefficient, and relaxation coefficient, respectively, which are detailed as follows

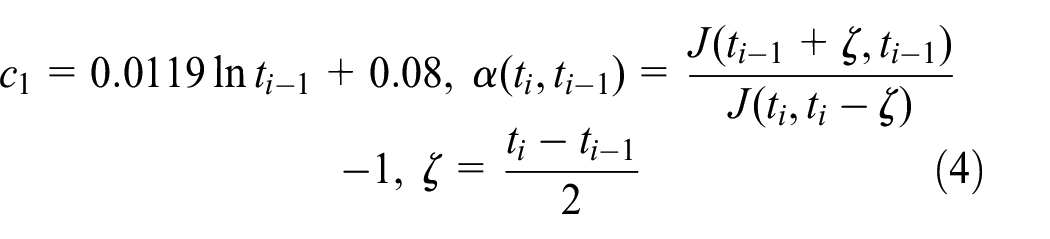
The age-adjusted effective modulus

The stepwise analysis method of concrete shrinkage and creep effect is shown in Figure 6. First, the elastic modulus of concrete during each time interval of (ti, ti − 1) was replaced by the age-adjusted effective modulus
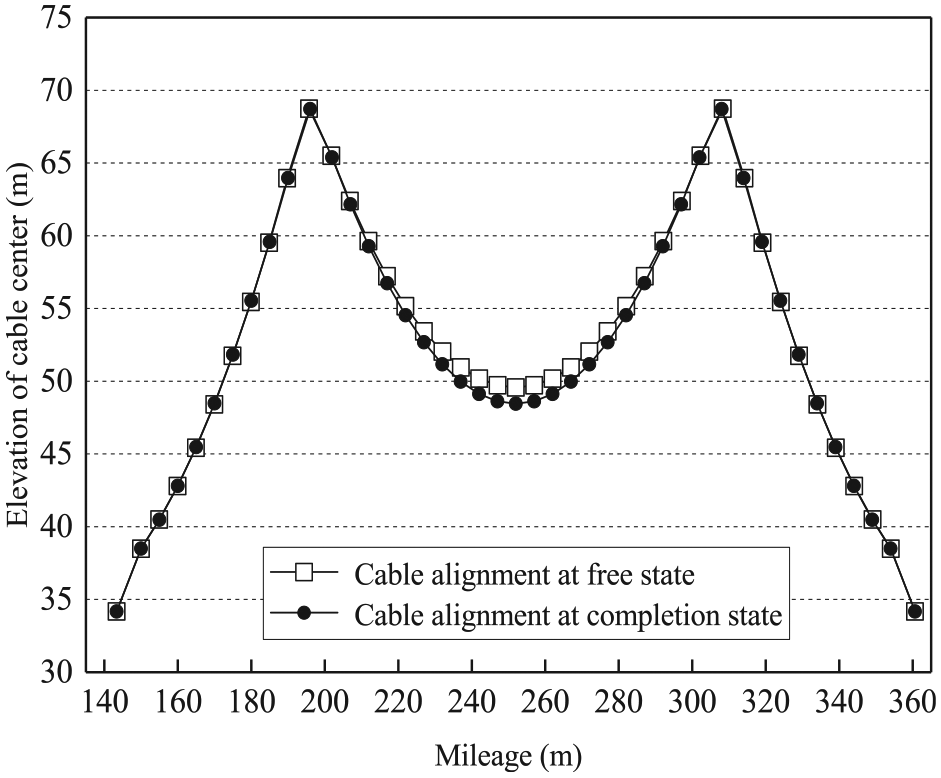
Cable alignments at the erection and completion states.
The cable alignments at different states are shown in Figure 6. The final hanger forces are shown in Table 2. For the sake of brevity, the internal forces of hangers DS1–DS19 are listed, and the ones of hangers DS20–DS37 are symmetrically equal.
Target hanger force at completion state (unit: kN).

System transformation scheme
The main construction procedures of Hunan Road Bridge are shown in Table 3. 22 The specific steps in each hanger tensioning stage are shown in Table 4, where the tensioned hangers of each step and the pushing amounts of main saddles on towers toward mid-span are described.
Description of the construction procedure of Hunan Road Bridge.

System transformation scheme of Hunan Road Bridge.

Cable displacement characteristics during system transformation
Measured cable displacement
The maximum values of measured cable displacements at three directions during each hanger tensioning stage are shown in Table 5, taking the north cable as an example. The vertical and longitudinal displacements of cable during the initial tensioning state were significant because of the small cable stiffness, which could help the hanger connection by prebiased clamps with cable to entry into the tubes smoothly. The Hunan Road Bridge was transformed to the self-balancing suspension system at the end of initial tensioning stage. The side-span hangers were tensioned to the state that the target exposed amounts of hanger anchor cups at completion state were achieved. The mid-span hanger were anchored on the girder through the extension rods. In addition, the measured vertical displacements of cable during each hanger tensioning stage are shown in Figure 7, taking the north cable as an example. The maximum errors relative to the target values are 0.020, 0.019, and 0.018 m, respectively. Thus, the stressed states of tower roots at the end of each tensioning stage were in good condition. The measured longitudinal offset amounts of tower tops toward the side-span were 0.01, 0.02, and 0.01 m, respectively. Moreover, the cable displacement during the initial tensioning state was characterized by significant geometric nonlinear feature as shown in Figure 7(a). The contraflexure points appeared at the hangers of DS4, DS34, DS12, and DS26 reflect the catenary characteristics of cable.
Maximum measured cable displacement during each hanger tensioning stage (unit: m).

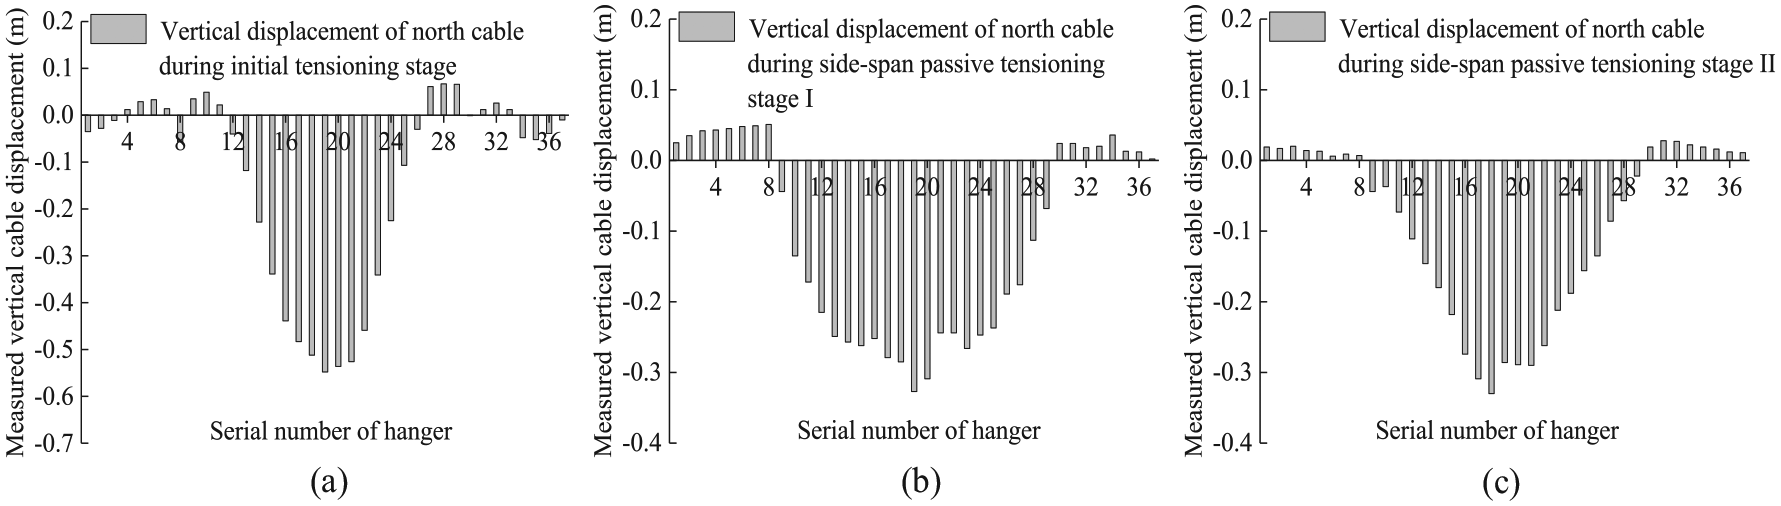
Measured vertical cable displacement during each hanger tensioning stage: (a) initial tensioning stage; (b) side-span passive tensioning stage I, and (c) side-span passive tensioning stage II.
The comparisons of the alignments of north cable and girder at bridge completion state are shown in Figure 8, and the errors are within ±2 cm and ±1 cm, respectively. The measured data reflect that the actual completion state of the bridge is in good agreement with the target value. In addition, the results show that the error percentages of cable alignment at girder ends and middle mid-span are relatively higher because of the catenary characteristics of cable.

Comparison of final alignments: (a) cable and (b) girder.
Weak coherence of cable displacement
The calculation results of vertical cable displacements during each step of side-span passive tensioning stages I and II are shown in Figures 9 and 10, respectively. The displacements of cable segments within the tensioned domains were characterized by weak coherence and contraflexure characteristics when the bridge has been provided with certain stiffness.2,7 The cable segments at the tensioned hangers and the nearest hangers dropped, and the cable segments at the hangers a little bit farther away from the tensioned hangers rose slightly. Moreover, the rising amount of distant cable increased gradually along with the increase in distance. Then, the rising amount decreased once beyond the critical range. In addition, the cable displacements during the side-span passive tensioning stage II were smaller compared with the ones during side-span passive tensioning stage I, but performed more significant contraflexure characteristics at mid-span.

Calculated results of vertical cable displacements during side-span passive tensioning stage I: (a) step 2-2, (b) step 2-4, (c) step 2-6, (d) step 2-8, (e) step 2-10, and (f) step 2-12.

Calculated results of vertical cable displacements during side-span passive tensioning stage II: (a) step 3-2, (b) step 3-4, (c) step 3-6, (d) step 3-8, (e) step 3-10, and (f) step 3-12.
Measured cable force
The measured cable forces at girder ends under hanger tensioning and bridge completion states are shown in Table 6. The error ratios relative to target values are within ±3%. In addition, the structural gravity stiffness was enhanced along with the increase in cable force, and the geometric nonlinear degree of cable reduced gradually.
Measured cable force under hanger tensioning and bridge completion states (unit: kN).

Hanger force evolution during system transformation
Measured hanger force
The comparison of measured hanger forces with target values at the end of initial tensioning stage is shown in Table 7, and those of side-span passive tensioning stage and bridge completion are shown in Figure 11. The error ratios relative to the target values are within ±4%, which reflects that the accurate control of hanger tensioning was achieved through adopting the proposed multiple-control method.
Comparison of hanger force at the end of initial tensioning stage (unit: kN).

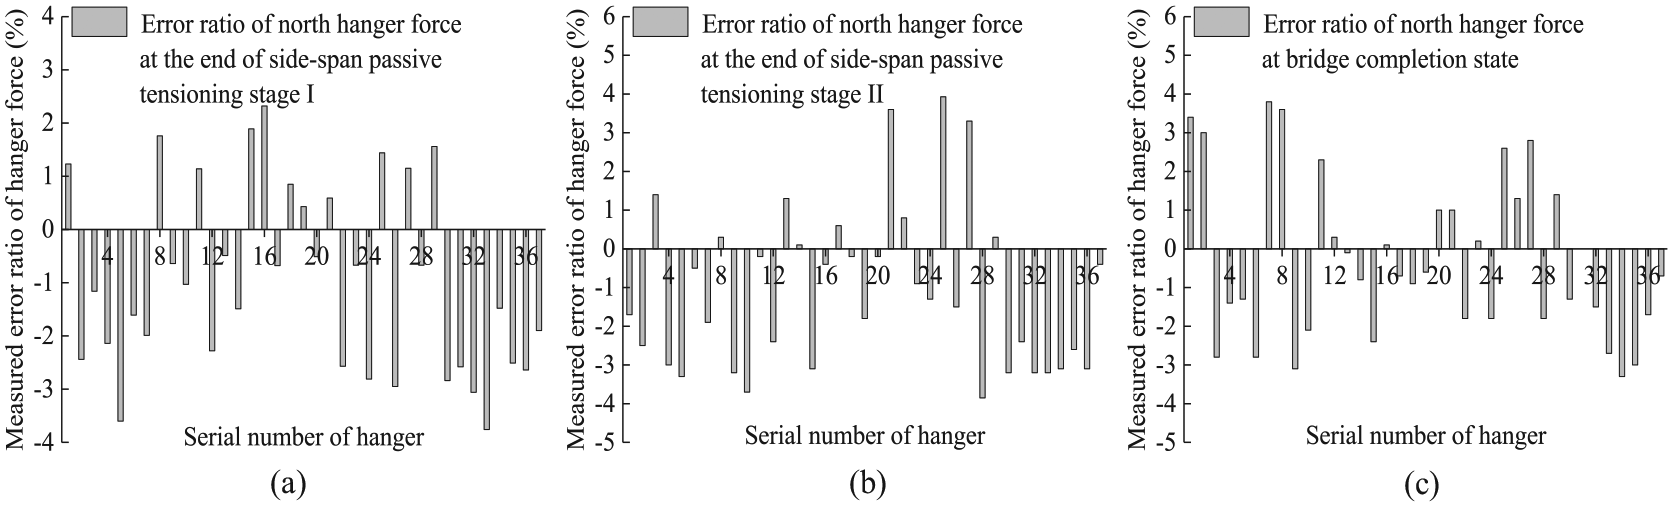
Comparison of north hanger force at the end of side-span passive tensioning stage and bridge completion state: (a) side-span passive tensioning stage I, (b) side-span passive tensioning stage II, and (c) bridge completion state.
Adjacent influence law of hanger force
The measured internal forces of tensioned hangers when the target values of control parameters were achieved during each step of initial tensioning stage are shown in Figure 12, taking the north hangers as examples. The target hanger forces at the end of initial tensioning stage are also shown in Figure 12 to compare. During the early steps of initial tensioning stage, including the steps 1-1 to 1-7 encircled by the dotted frames as shown in Figure 12, the target vertical displacement of cable could be achieved through applying small hanger tensioning force because of the small cable stiffness. Moreover, the hanger tensioning forces were smaller than the target hanger forces at the end of initial tensioning stage. In addition, the significant contraflexure points appeared at the hangers of DS4, DS34, DS12, and DS26. As for the later tensioning steps 1-8 to 1-12, which were conducted for the hangers on the other side of the contraflexure points, the tensioning forces required were bigger than the target hanger forces at the end of initial tensioning stage. At the same time, the internal forces of the tensioned hangers previously increased correspondingly.

Adjacent influence of hanger force during initial tensioning stage.
The measured hanger forces during each step of side-span passive tensioning stages I and II when the target control parameters were achieved were compared with the target hanger forces at the end of side-span passive tensioning stages as shown in Figures 13 and 14, respectively. As the cable displacement during hanger tensioning process was characterized by the weak coherence. The hangers closest to the tensioned hanger were unloaded during hanger tensioning process, while the internal forces of the farther hangers increased. 2 For this reason, the peaks of hanger tensioning force Pij and the internal forces of the farther hangers should be decreased during the determination of system transformation scheme. In addition, the influence on the internal forces of distant hangers brought by the tensioned hanger was slight, which was coincident with the aforementioned weak coherence of cable displacement. Moreover, the adjacent influence degree of hanger force is depended on the structural system and the force characteristics of cable. Due to the relatively small vertical girder displacement and big cable stiffness during the side-span passive tensioning stage II, the unloading degree of hangers nearest to the tensioned hanger was reduced compared with the one during the side-span passive tensioning stage I.

Adjacent influence of hanger force during side-span passive tensioning stage I: (a) step 2-2, (b) step 2-4, (c) step 2-6, (d) step 2-8, (e) step 2-10, and (f) step 2-12.
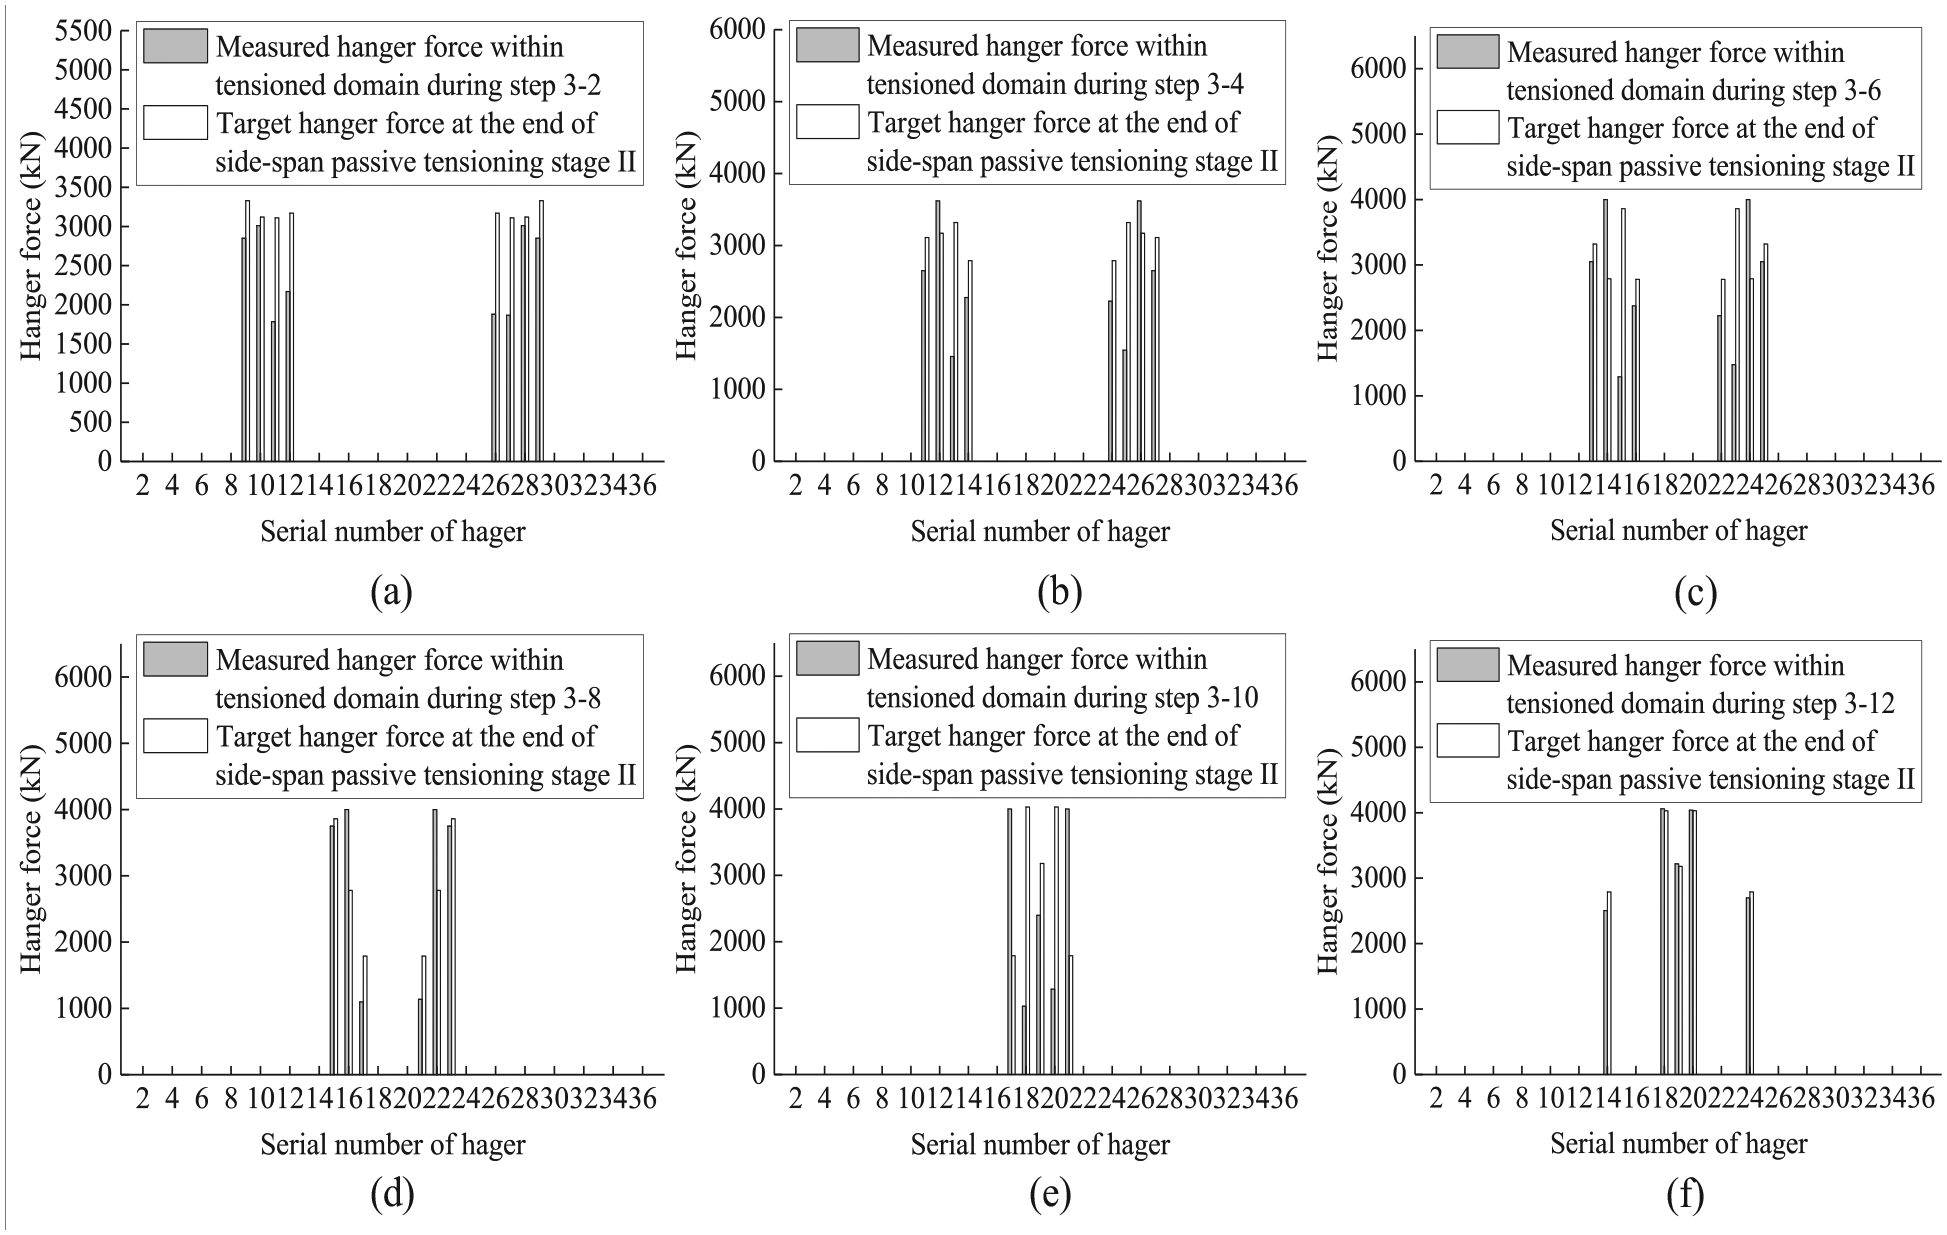
Adjacent influence of hanger force during side-span passive tensioning stage II: (a) step 3-2, (b) step 3-4, (c) step 3-6, (d) step 3-8, (e) step 3-10, and (f) step 3-12.
Stress evolution of extra-wide girder during construction
Refined solid FE model
The ANSYS refined FE model of the bridge was established to investigate the longitudinal and transverse stress evolutions of extra-wide girder during construction. The material parameters and element types of the refined FE model are shown in Table 8. The refined FE model of the extra-wide girder is shown in Figure 15. The SOLID187 element was used to simulate the girder, crossbeam, anchor plates, backing plates, and pavement. The SOLID187 element is the high-order element with 10 element nodes, which is characterized by the second-order displacement mode and relatively high calculation accuracy. The element size was 0.2 m. As can be seen from the line-view of girder model in Figure 15, the complicate cross section of the extra-wide girder, which had various forms of chamfer along different directions at the intersections of girder with crossbeams, was well simulated.
Material and element types of the refined FE model of the bridge.

FE: finite element.

Refined simulation method of the extra-wide girder of the bridge.
In addition, the LINK10 element that can only be tensioned was used to establish the massless scaffold to simulate the tensioning processes of prestressed tendons and hangers, instead of the compression-only LINK10 element. The compression-only LINK10 element has difficulty to produce the convergent calculation results. As can be seen from Figure 15, the nodes located at the bottom surface of girder were first copied and pasted as the bottom nodes of scaffold, which were 0.10 m away from the bottom girder nodes along +Y direction. The DOFs of bottom scaffold nodes were constrained besides UY, and UY was fully coupled with the corresponding nodes of bottom girder surface. Then, the bottom nodes of scaffold were copied and pasted as the top nodes of scaffold, which were 0.10 m away along +Y direction. All of the DOF of top scaffold nodes were constrained. Finally, the tension-only LINK10 elements were established between the bottom and top nodes of scaffold. Thus, the support system of scaffold during the tensioning processes of prestressed tendons and hangers was simulated preciously and conveniently.
The simulation method of the longitudinal and transverse prestressed tendons in girder is shown in Figure 16. The tension-only LINK10 element was used to simulate the prestressed tendons. The prestress was applied through setting the initial strain. The reduction factors of prestress shown in Table 3 were determined based on the monitoring data of prestress tensioning process. Moreover, the initial strains applied on the prestressed tendons during each system transformation stage were updated based on the calculated prestress results of the former stage to consider the prestress relaxation. In addition, the SOLID187 element was used to simulate the anchor plate of prestress tendon, which was glued with girder volume. The outside central points of anchor plates were the terminal points of prestress tendon, and the DOFs of the remaining nodes of prestress tendon were fully coupled with the nearest nodes of girder. Thus, the anchoring effects of the prestress tendons were simulated preciously.
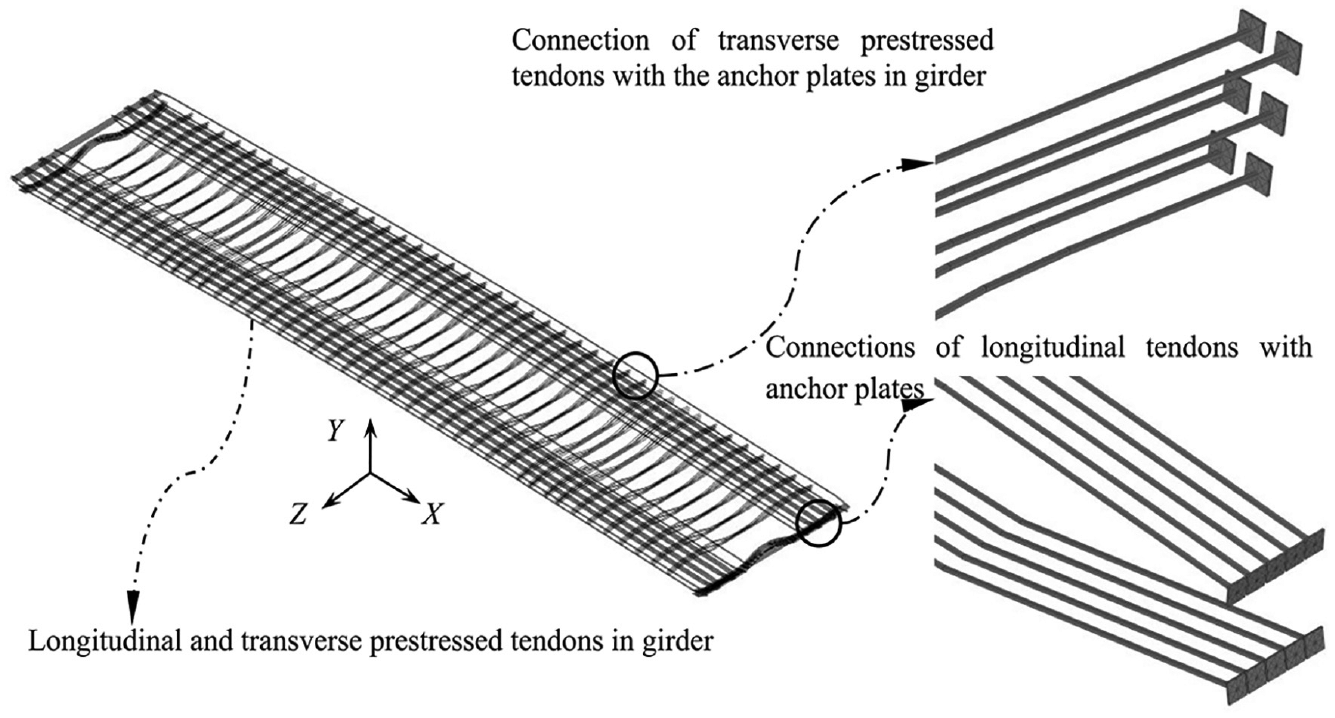
Simulation method of the longitudinal and transverse prestressed tendons in girder.
Similarly, the transverse prestressed tendons in the crossbeams of towers were simulated using the same method. The DOFs of the bottom central nodes of backing plates were coupled with the corresponding nodes of tower crossbeams according to the actual bearing types. Namely, the vertical and longitudinal DOFs of the abovementioned nodes of the west tower bearings were coupled, and the vertical DOF of the ones of east tower bearings were coupled. Moreover, the SOLID187 element was used to simulate the baking plates of bearings at girder ends similarly. The displacement constrains were applied on the bottom surfaces of baking plates according to the actual bearing types at girder ends. 22
The simulation method of cable system is shown in Figure 17. The connections of cable and hangers with girder were the same as the ones of prestressed tendons. Moreover, the SOLID187 element was used to simulate the backing plates of splay saddles, which were glued with girder. The vertical and transverse DOFs of the top central nodes of backing plates were coupled with those of corresponding cable nodes. The longitudinal constrains were relaxed. Thus, the connections of cable with girder at splay saddles were simulated.
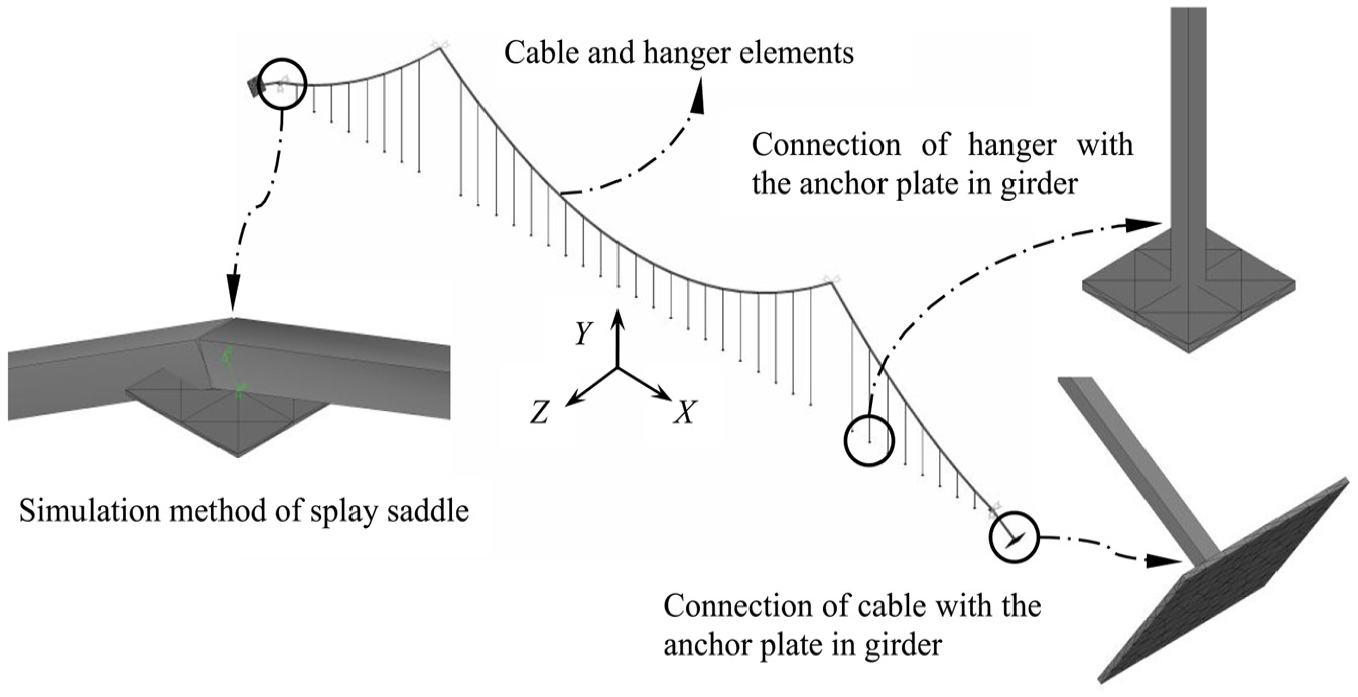
Simulation method of cable system.
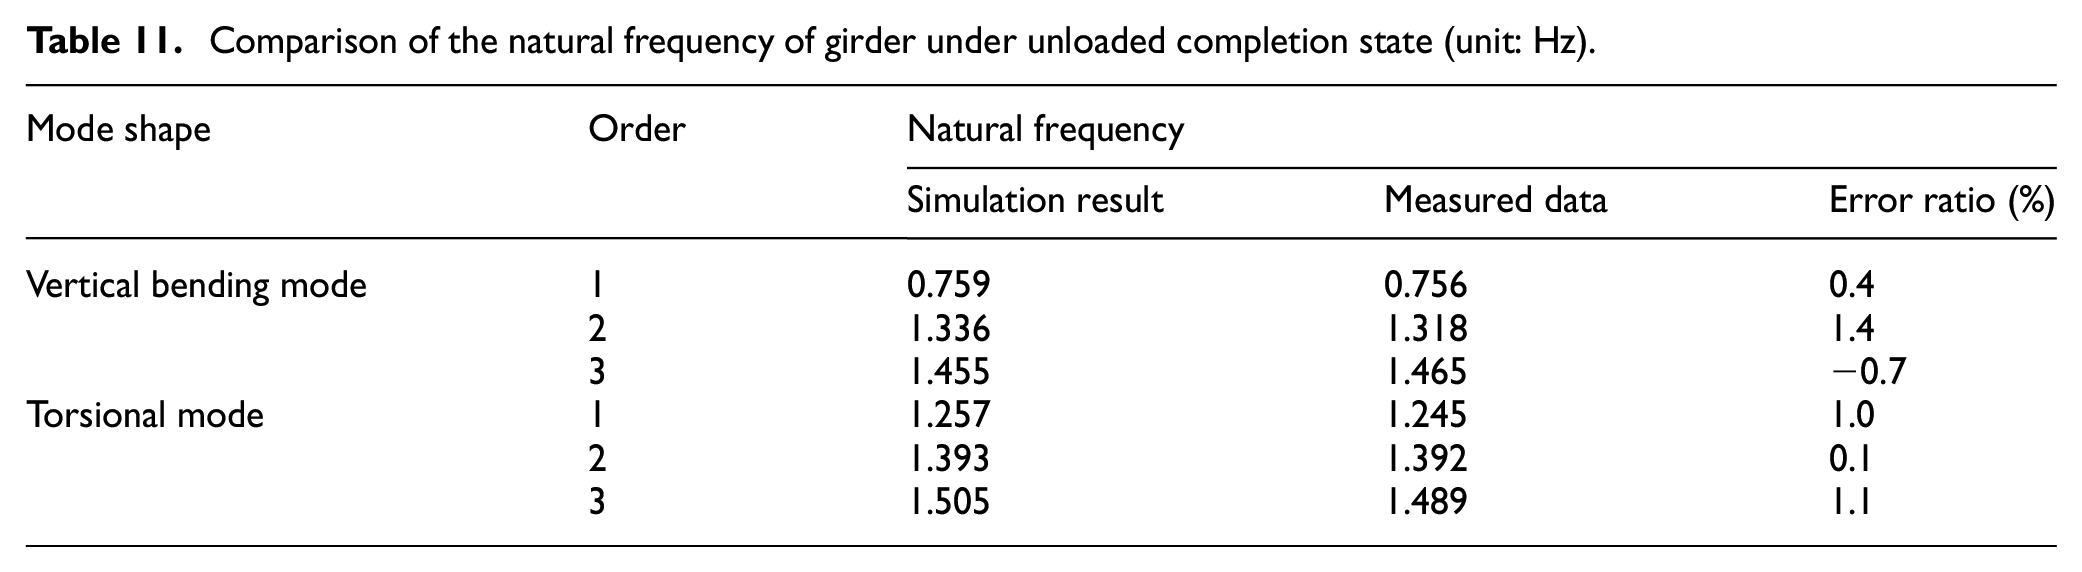
The global refined FE model of Hunan Road Bridge is shown in Figure 18. The calculated vertical girder displacement during equilibrium analysis, the longitudinal girder stress under unloaded completion state, and natural frequency of girder were compared with the measured data to verify the validity of global refined FE model. As can be seen from Tables 9–11, the reference value of error ratio is the measured data. The calculated results are in good agreement with the measured data, which reflects that the actual bridge completion state was well simulated by the global refined FE model.

Global refined FE model of Hunan Road Bridge.
Comparison of the vertical displacement of girder at road centerline during construction (unit: m).

The positive values of vertical displacement are upward.
Comparison of the longitudinal stress of girder under unloaded completion state (unit: MPa).

The positive longitudinal stresses are tensile stresses.
Comparison of the natural frequency of girder under unloaded completion state (unit: Hz).
Longitudinal stress evolution during construction
The construction process of Hunan Road Bridge and bridge completion state were simulated based on the refined FE model. The girder section C7 in the middle of mid-span and the section C2 in the middle of west side-span were selected as the analyzing sections. The longitudinal girder stress was measured using the strain gages installed in girder. The influences on the measured strains brought by temperature were removed.
The shear lag effects in girder at bridge completion state were evaluated. The mechanics behaviors of wide box girder are affected by the shear and torsional deformations of top and bottom plates. The longitudinal displacement of the flange far away from web is different from the one of the flanges close to web. The transverse distributions of bending stresses of plates are characterized by a curve, which is shear lag effect. 28 The sample beam theory is not suitable for the stress analysis of extra-wide box girder. The shear lag coefficient λi of any point in the cross-section of wide box girder is defined as follows

where σi is the actual stress and σ0 is the average stress obtained based on the elementary beam theory.
The positive shear lag effect is that the situation that the normal stress of the flange far away from the web is bigger than the average stress. Otherwise, the shear lag effect is negative. In this section, the calculated results of girder normal stress obtained by the spatial beam-type FE model of the bridge were adopted as the average stress σ0, where the main girder was simulated using the Euler beam element BEAM4 based on the beam-type FE model as shown in Figure 5.
Prestress tensioning process
The influences on the longitudinal girder stress and transverse distribution brought by the prestress tensioning are shown in Figure 19. The solid lines are the calculation results of refined model, and the dash lines are the calculation results of beam-type FE model using BEAM4. For the sake of brevity, the stress results of half girder were given considering the structural symmetry. The extra-wide girder at sections C7 and C2 were characterized by the negative and positive shear lag effects after the transverse and longitudinal prestress tensioning processes, respectively. The absolute compressive stress of girder at section C7 were relatively smaller than the ones at section C2. However, the shear lag effects of section C7 were more significant than the ones of section C2. The stress concentrations appeared in the bottom plate at the junction areas with side webs affected by the longitudinal prestress tensioning. In addition, the cube hole with the length of 0.45 m at the middle of bottom girder plate is the hanger anchoring area as shown in Figure 19(b) and (d), where the longitudinal stress is characterized by huge compressive stress and mutations. Generally, the longitudinal tensile stress might not appear at hanger anchoring area during construction. The stress results of hanger anchoring area were ignored during the path setting of ANSYS software, which were replaced by the substitute connection line.
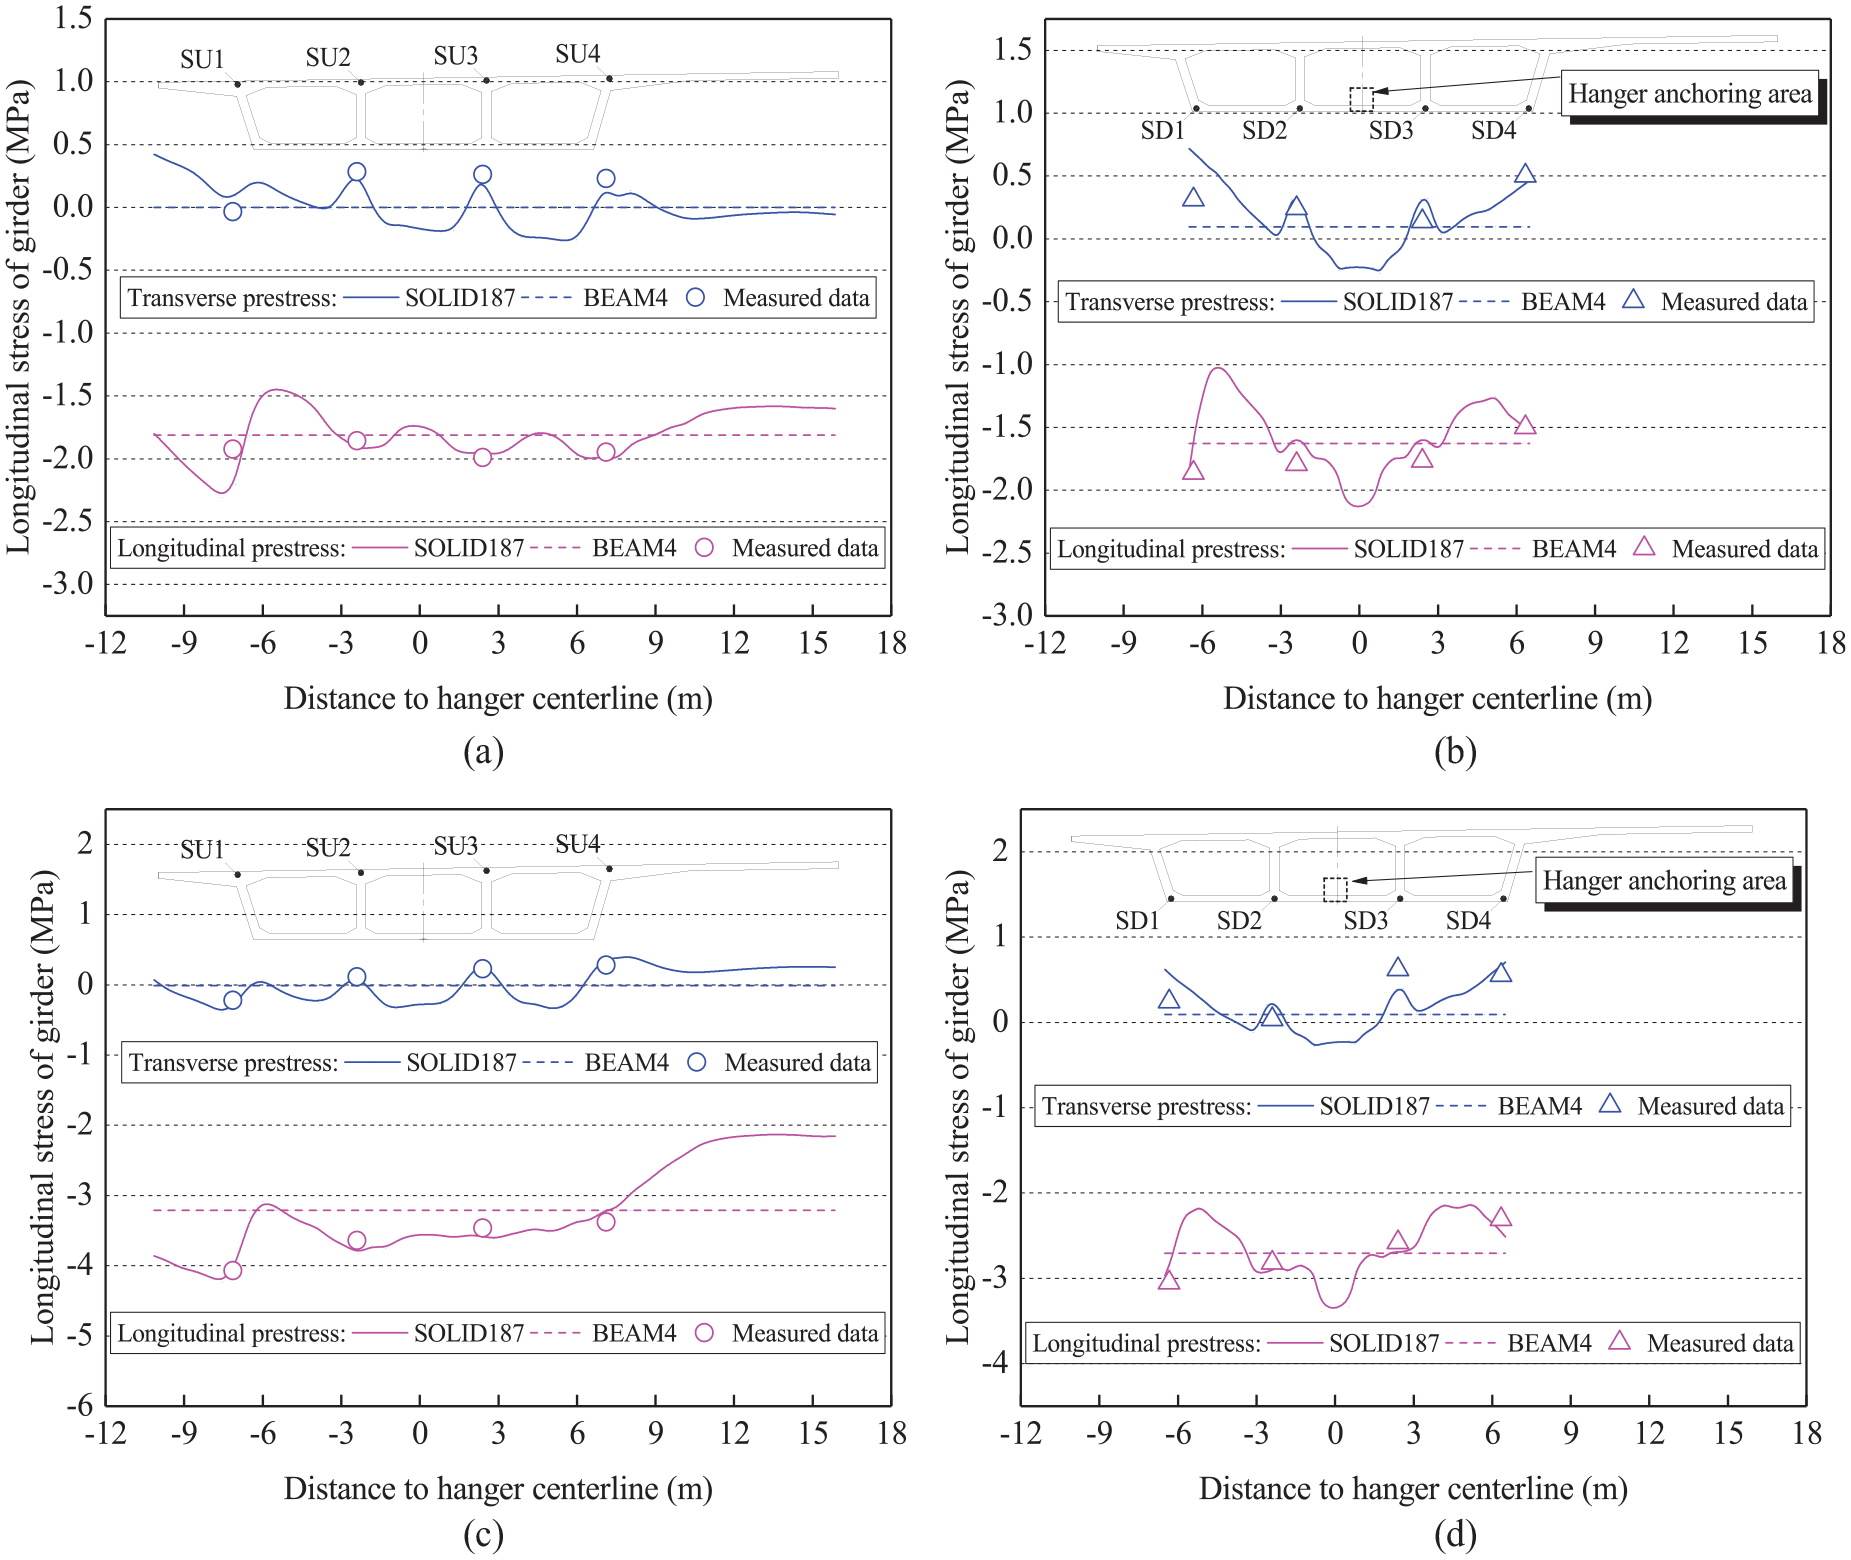
Longitudinal stress of extra-wide girder and the transverse distribution at the end of tensioning processes of longitudinal and transverse prestressed tendons: (a) top plate at section C7, (b) bottom plate at section C7, (c) top plate at section C2, and (d) bottom plate at section C2.
System transformation process
The influence on the longitudinal girder stress and transverse distribution brought by hanger tensioning are shown in Figure 20. The cable and hanger forces applied on girder gradually increased along with system transformation. The spatial characteristics and complexity of the forced state of girder became more significant. The girder plates at sections C7 and C2 were characterized by positive shear lag effect after each hanger tensioning stage. The absolute compressive stress of girder increased gradually along with the hanger tensioning process. The influences on side-span brought by cable anchoring force were more significant compared with the one on mid-span. The increasing amplitudes of the absolute compressive stress of side-span section C2 were bigger than the ones of section C7.

Longitudinal girder stress and the transverse distribution at the end of each hanger tensioning stage: (a) top plate at section C7, (b) bottom plate at section C7, (c) top plate at section C2, and (d) bottom plate at section C2.
Completion state
As shown in Figure 21, the longitudinal stresses of girder sections C7 and C2 at bridge completion state were characterized by positive shear lag effects. The measured and simulated results show that the loss ratio of longitudinal prestress in mid-span is bigger than the one in the side-span. The shear lag coefficients of girder sections C7 and C2 at bridge completion state are shown in Figure 22, which were within the ranges of 0.8–1.2 and 0.8–1.3, respectively.

Longitudinal stress of extra-wide girder and the transverse distribution at bridge completion state: (a) top plates at sections C7 and C2; and (b) bottom plates at sections C7 and C2.

Transverse distribution of the shear lag coefficient of extra-wide girder at bridge completion state: (a) top plates at sections C7 and C2; and (b) bottom plates at sections C7 and C2.
Transverse stress evolution during construction
Prestress tensioning process
The transverse stress analysis of extra-wide girder is also important for the disease control of girder, such as the longitudinal cracks in girder. The influences on the transverse stress of girder and the transverse distribution brought by the prestress tensioning processes are shown in Figure 23. The girder sections C7 and C2 were selected as the analyzing sections. The transverse stress reserves of top and bottom plates had been formed basically at the end of transverse prestress tensioning process, which distributed unevenly along the transverse direction. The transverse girder stress of mid-span basically did not change during the longitudinal prestress tensioning process. The unevenness degree of transverse distribution of transverse girder stress of side-span increased slightly. In addition, the transverse compressive stress of the top plate at outside room was relative small. The transverse tensile stress appeared at the cantilever segment of top plate. The arrangement and shapes of transverse prestressed tendons should be adjusted during the design processes for the similar bridges. The measures such as the anti-cracking steel mesh at the outside edge of top plate should be enhanced. Moreover, the transverse prestressed tendons should be tensioned symmetrically to avoid the excessive tensioning force and local transverse tensile stress in girder.

Transverse girder stress and the transverse distribution at the end of tensioning processes of longitudinal and transverse prestressed tendons: (a) top plates at sections C7 and C2; and (b) bottom plates at sections C7 and C2.
System transformation process
The transverse girder stresses at sections C7 and C2 and the transverse distributions at the end of each hanger tensioning stage are shown in Figure 24, which changed little compared with the ones at the end of tensioning process of prestressed tendons. The impact on the transverse stress of extra-wide girder brought by system transformation process is little. Only the transverse stresses of the top plates of middle rooms changed slightly, as well as the ones of bottom plates close to middle webs.

Transverse stress of extra-wide girder and the transverse distribution at the end of each hanger tensioning stage: (a) top plates at sections C7 and C2; and (b) bottom plates at sections C7 and C2.
Completion state
The transverse stresses of girder sections C7 and C2 at bridge completion state are shown in Figure 25. Because the transverse tensile stresses at the local parts of top and bottom plates close to hanger anchoring area were caused by hanger force after removing the girder scaffolds, the mutations of transverse stress appeared at the abovementioned positions. In addition, the transverse stress of top plate close to the road centerline at section C7 was only −1.0 MPa. Moreover, the maximum value of transverse tensile stress of top plate at the injunction with the outside web was 1.80 MPa, which reached to the design value of tensile strength of concrete material. The anti-cracking steel mesh at the abovementioned regions should be enhanced during initial structural design. The changes in the transverse stress of top plate at road centerline of mid-span girder should be tightly monitored during the scaffold uninstallation. The local excessive transverse tensile stress and longitudinal cracks in girder should be avoided.
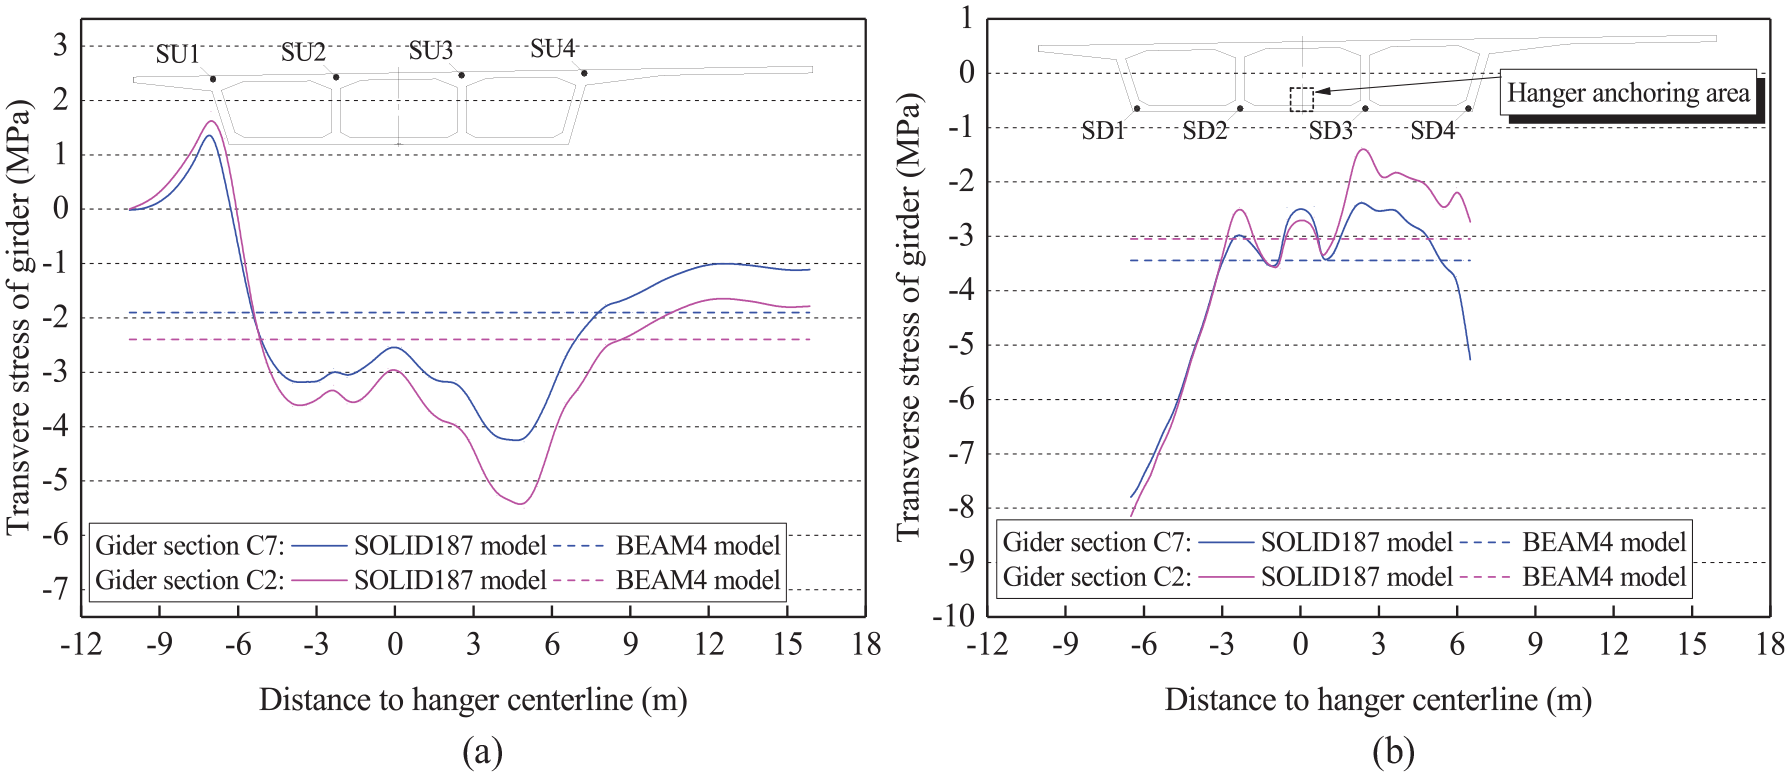
Transverse stress of extra-wide girder and the transverse distribution at bridge completion state: (a) top plates at sections C7 and C2; and (b) bottom plates at sections C7 and C2.
Conclusion
In this study, we focused on the spatial mechanics characteristics of the self-anchored suspension bridge with extra-wide concrete girder during girder erection and system transformation. The numerical simulation and field monitoring for the Hunan Road Bridge, which is the widest concrete self-anchored suspension bridge in China currently, were integrated. Moreover, the global refined FE model was established using the solid element. The longitudinal and transverse stress evolutions of extra-wide girder during the whole construction process were studied. The significant contributions are summarized as follows:
The maximum values of vertical and longitudinal cable displacements during the initial tensioning state reached to 0.603 and 0.189 m, respectively. The cable displacement was characterized by significant geometric nonlinear feature. The displacements of cable segments within the tensioned domains were characterized by weak coherence and contraflexure characteristics during side-span passive tensioning stages when the bridge has been provided with certain stiffness. Correspondingly, the hangers closest to the tensioned hanger were unloaded, while the internal forces of the farther hangers increased. The adjacent influence law of cable system can be utilized to optimize the hanger tensioning scheme considering the material strength limits of hanger and clamp.
The compression-only link element has difficulty to produce convergent calculation results in simulating the scaffold system. Moreover, the calculation errors brought by the simulation method of cable system adopting the equivalent load application method were avoided. The results showed that the extra-wide girder plates at sections C7 and C2 were characterized by the negative and positive shear lag effects after the transverse and longitudinal prestress tensioning processes, respectively. The extra-wide girder was characterized by positive shear lag effect at the end of each hanger tensioning stage and bridge completion state. In addition, the shear lag coefficients of sections C7 and C2 at bridge completion state were within the ranges of 0.8–1.2 and 0.8–1.3, respectively.
The transverse stress of girder basically did not change during the longitudinal prestress tensioning process and system transformation. In addition, the transverse compressive stress of the top plate close to road centerline at section C7 was relative small, which was only −1.0 MPa. Moreover, the transverse tensile stress appeared in the top plate at the injunction with outside web, which reached to 1.80 MPa. The arrangement and shapes of the transverse prestressed tendons in top plate should be optimized during the design processes for the similar bridges. The measuring points for the transverse girder stress of top plate at the injunctions with outside web and the road centerline of mid-span should be increased during the establishment of health monitoring system. The changes in the transverse girder stress should be monitored tightly during the uninstallation of girder scaffolds, which are the lessons learned from this article.
Footnotes
Handling Editor: Nan Wu
Author contributions
G.Z. and A.L. contributed to conceptualization; G.Z. and Z.X. contributed to data curation; G.Z. contributed to formal analysis and project administration; G.Z., A.L., and J.L. contributed to funding acquisition; G.Z. and M.D. contributed to investigation, methodology, and validation; G.Z. and B.F.S. contributed to software and models; A.L. contributed to supervision; G.Z. and B.W. contributed to writing the original draft; and G.Z. and L.Z. contributed to review and editing.
Declaration of conflicting interests
The author(s) declared no potential conflicts of interest with respect to the research, authorship, and/or publication of this article.
Funding
The author(s) disclosed receipt of the following financial support for the research, authorship, and/or publication of this article: The authors gratefully acknowledge the supports of Fundamental Research Funds for the Central Universities (No. 30919011246), National Natural Science Foundation of China (No. 51278104), Transportation Scientific Research Program of Jiangsu Province, China (No. 2011Y03), Research Fund for the Doctoral Program of Higher Education of China (No. 20133204120015), Universities Natural Science Foundation of Jiangsu Province, China (No. 12KJB560003), National Natural Science Foundation of China (No. 51708074), and Key Project of Foundation and Frontier Research of Chongqing (No. cstc2017jcyjAX0187).
Research materials assessment
Please contact the author via email: