
Abstract
Grout defects always exist in sleeves of precast structures, but studies on grout defect identification are rarely performed. This article proposes a combination method of dynamic excitation technique and wavelet packet analysis for sleeve defect identification in the precast structure. Hammer excitation on a 1/2-scaled two-floor precast concrete frame structure with column rebar splicing by grout sleeves is conducted to collect column acceleration responses. Moreover, the corresponding energy spectrum is obtained by the wavelet packet analysis. Furthermore, three defect identification indices, that is, percentage of energy transfer, energy ratio variation deviation, and energy spectrum average deviation, are calculated and compared. Robustness analysis of the energy ratio variation deviation is carried out by adding white noise in the original acceleration response signals. The results show that (1) the percentage of energy transfer, the energy ratio variation deviation, and the energy spectrum average deviation are positively correlated with the grout defect degree where the energy ratio variation deviation is more sensitive in the identification of defects; (2) the energy ratio variation deviation robustness of the original signal with the inputted multiplicative white Gaussian noises is better than that with the inputted additive white Gaussian noise; and (3) the proposed defect identification method can characterize the sleeve grout defect degree in column.
Keywords
Introduction
Currently, due to substantial advantages such as faster all-weather production, lower running costs, safer working conditions, and better environmental outcomes,1–5 precast structures have attracted much attention. In the precast structures, rebar connection methods mainly include the sleeve grouting connection, the anchor grouting connection, and the mechanical connection, 6 of which the sleeve grouting connection is most widely adopted in the world. However, defects always exist in the sleeves in practical engineering, for example, the sleeve end defect caused by the leakage of slurry, the middle defect caused by incompletely discharging air, and the eccentric defect of the steel rebars, which all significantly affect the structural connection performance.7,8 Therefore, it is necessary and important to develop the grout defect identification method for the sleeves to guarantee structural safety.
Currently, considerable studies focus on the dynamic fingerprint analysis to find out “fingerprint” changes related to structural defects. Once the structure is damaged, the structural parameters will change, resulting in corresponding dynamic fingerprint (e.g. the frequency, the mode curvature, the strain mode, the flexibility, and the power spectrum) change, which are regarded as the signs of structural damage. By analyzing the changes in the natural frequencies and damping ratios of the reconstructed frequency response functions, Kim 9 found that the delamination extent for the sandwich beams and the fatigue damage level for the laminated composites were easily identified. Raghuprasad et al. 10 presented the changes in static defections and dynamic parameters to identify the damage in the supported beam. By establishing the structural frequency response functions, Dackermann et al. 11 developed a framework to identify and assess progressive structural damage. Based on the measured natural frequencies of structures, interval analysis technique for structural damage identification was proposed by Wang et al. 12 The numerical results proved the validity and applicability of the interval analysis method presented. Xia and Hao 13 discussed the effects of modal frequencies, noise level, and damage level on damage identification. Pandey et al. 14 proposed a method to detect damage location by comparing modal curvature where a large number of sensors were applied to obtain the precise modal curvature. Based on the modal strain energy, Shi et al. 15 proposed a method to identify the structural damage location and damage in a steel frame structure.
In some cases, the dynamic fingerprints obtained from measured signals are not good, sensitive indications of structural damage. A number of studies focused on the wavelet analysis and wavelet packet analysis, which were the mathematical tools with the advantage of recognizing the subtle differences between the normal and abnormal signals. Hou et al. 16 proposed a method for structural damage detection and health monitoring based on wavelet analysis, where a simple structure model was employed for harmonic excitation to generate simulated data analyzed by wavelet decomposition, and the damage was clearly determined. Hester and González 17 established a vehicle–bridge finite element interaction model and developed a wavelet-based approach using wavelet energy content at each bridge section to detect damage. In order to enhance the damage identification accuracy, Zhou et al. 18 developed a damage index based on the two-dimensional (2D) continuous wavelet transform. Rims et al. 19 reported a damage identification algorithm for beams with multiple damage sites based on wavelet transform method of vibration mode shapes and pointed out that the algorithm can capture the areas of damage. Analyzed by wavelet transform, Xu et al. 20 clarified the mechanism of using 2D curvature mode shape to depict damage and corroborated its advances of characterizing damage, robustness against noise, and sensitivity to slight damage. Zhao et al. 21 carried out an experimental study for identification of micro-damage in reinforced concrete beam based on wavelet packet method and found that the proposed methodology can properly characterize the damage state of structures under various stress stages. Han et al. 22 developed a method for damage detection of steel beams based on wavelet packet energy where the wavelet energy rate index was computed. Results showed the index was sensitive to structural local damage.
In summary, there have been extensive studies on identification of defects. However, the defect identification studies on precast structure are few, especially on grout sleeve in precast column. Accordingly, this article proposes a combination of dynamic excitation technique and wavelet packet analysis for grout sleeve defect identification in precast column. Nondestructive testing is conducted on a 1/2-scaled two-floor precast concrete frame structure with rebar splicing by grout sleeves. The column acceleration responses are analyzed based on wavelet packet. Three defect identification indices—percentage of energy transfer (ET), energy ratio variation deviation (ERVD), and energy spectrum average deviation (ESAD)—are proposed to identify the grout defects in column sleeves, and good results are obtained.
Wavelet packet analysis based on defect indicator extraction
Energy extraction based on wavelet packet decomposition
Energy is widely used to identify structural defect. Generally, structural excitation responses will appear when the structure is under external vibration excitation. Compared with the nondefective precast column, excitation responses of the grout-defective precast column, for example, natural frequency, stiffness, and damping, will change, which means the changes in structural dynamic performance result in frequency components redistributing in the response signals (frequency components could be enhanced or inhibited). Correspondingly, the energy of each frequency band is different between the grout-defective precast column and the nondefective precast column.
Wavelet packet decomposition is a refined signal analysis method, which improves the time–frequency resolution by decomposing the low-frequency signal and high-frequency signal simultaneously.23,24 Through extracting the energy value of each frequency band, the characteristic vectors are formed to identify grout defects in the precast column, including the degree and location. Therefore, compared with analyzing wavelet packet decomposition coefficient, it is more sensitive and robust to obtain signal features by analyzing the frequency band energy.
Selection of wavelet function and the decomposed level
The wavelet function used in the wavelet packet analysis should possess the basic characteristics of orthogonality, local property in time domain, and nondestructive property in signal reconstruction. 25 Based on the above characteristics, an approximate symmetric wavelet function Symlet is chosen in this article. Symlet is usually expressed as symN (N = 2, 3, …, 8). The support range of symN is 2N − 1, and the vanishing moment is N. If the structural parameters do not mutate in the concerned time domain, with the increase in order N, the frequency concentration of wavelet function is better.
It is more sensitive to identify grout defects with the increase in wavelet packet decomposition layers. However, this is impractical; as the decomposition layer increases, the computation time increases. Therefore, in practical application, an appropriate decomposition layer should be selected to construct the reasonable energy spectrum. Norm entropy

where
The norm entropy values of the energy spectrum under different orders and decomposition layers are calculated. The order N and decomposition level are reasonable when the norm entropy is relatively smaller and the computing time is relatively shorter.
Extraction of the signal energy spectrum vector
1.
2.

where
3. Energy spectrum vector is constructed by the energy of 2 j frequency bands, as shown in equation (3)
Defect identification indexes
By analyzing the dynamic response of precast column based on wavelet packet decomposition, the energy in each frequency band can be extracted and combined to obtain the defect identification index. In this article, three defect identification indexes PET, ERVD and ESAD are defined.
PET
Li and Sun 26 have shown that the changes of energy in each frequency band can effectively identify the defect in frame structure. Therefore, one defect identification index PET is adopted and calculated by equation (4)

where
ERVD
The observation noise decreases with the increase in wavelet packet decomposition level, and the energy of observation noise distributes more evenly in each frequency band. Adopting the difference between each frequency band energy and average frequency band energy as defect identification index, it will be more effective to identify structural defects. 27
First, energy ratio

Then, normalize the energy ratio of each frequency band (energy ratio of each frequency band is divided by the maximum absolute value). The ERV, which is the absolute difference value of normalized energy ratio between the grout-defective column and the nondefective column, can be calculated by equation (6)

where
Finally, the ERVD is defined in equation (7). It represents the dispersion degree of energy ratio variation to average value

ESAD
The ERVD can well reveal the redistribution of energy, and the energy average can represent the change in total energy. On this basis, the defect identification index ESAD is defined as 28 follows.
First, the energy of the ith node in the jth layer is normalized according to equation (8)

where
Then, the energy spectrum variation (ESV) is obtained by equation (9)

where
Finally, ESAD is defined in equation (10)
where
Experiment
Experimental model
The experiment is conducted on a 1/2-scaled precast concrete frame structure with two floors, single span, and two bays. The plane layout of columns and the structural elevation in axial A–C are shown in Figures 1 and 2, respectively. The structure consists of precast columns with a cross section of 250 mm×250 mm and height of 1480 mm, precast beams with a cross section of 150 mm×200 mm and length of 1250 mm, precast foundation beam with a cross section of 300 mm×300 mm, casting slab with a thickness of 70 mm, and slurry layers with a thickness of 20 mm. All rebars in the precast columns are spliced by grout sleeves. The concrete compressive strength is 25 MPa, and the yield strength of the longitudinal reinforcement and stirrup is 400 MPa. The experimental model is shown in Figure 3.

Column plane layout (unit: mm).
Structural elevation in axial A–C (unit: mm).

Experimental model.
Defect introduction and layout of excitation and measure-points
Parts of sleeves in the first floor are not grouted due to dimensional deviation of precast components. Artificial initial defects are located in the second floor, and thus the defect identification mainly aimed at the grout sleeves located in the second floor.
Figure 4 presents the grout sleeve defect state and excitation point (recorded as EP) layout. The hollow circle in column represents the sleeve is not grouted, and black circle represents the sleeve is grouted tightly. In column 2, only one sleeve is grouted. In column 6, two sleeves are grouted. In column 4, three sleeves are grouted. In columns 1, 3, and 5, all sleeves are grouted. EP 1-2 means the EP is located in the middle of the beam next to column 1 and column 2. There are seven EPs totally, which means there are seven cases, as shown in Table 1. In order to compare the dynamic response between the defective column and the nondefective column, in each case only one column is defective, while the other one is nondefective.

Defect introduction and EP layout of the second floor.
Experimental cases.
EP: excitation point.
The measure-points (recorded as MPs), arranged along the column height, are located on the column facade of the span where the EP acts, as shown in Figures 4 and 5. Taking case 6 as an example, Figure 5 shows there are four MPs in the two columns, where MP1–MP4 are located in the nondefective column and MP5–MP8 in the defective column. MP1 and MP5 form the pair of measuring points (recorded as MP1_MP5). In each case, the distance of MP1_MP5, MP2_MP6, MP3_MP7, and MP4_MP8 from the bottom of the column is 0, 320, 640, and 960 mm, respectively.

MP elevation in case 6.
Experimental equipment
In the experiment, external excitation is applied by hammer shock. The analysis of such random excitation can better illustrate the applicability of the defect identification method proposed in this article. Acceleration sensor is used to collect the MP data. However, the area of the hammerhead is big that the contact surface between the hammerhead and the tested structural is uncontrollable. Therefore, during the experiment, instead of acting on the frame structure directly, the hammer acts on the wood block that passes the vibration force to the frame structure. Accordingly, the interference of hammerhead on the response of the sensors is weakened. The acquisition system of Beijing Oriental vibration and noise technology research institute is used as the data collection system, and its acquisition frequency is set up as 1024 Hz. Taking case 5 as an example, the arrangement of experimental equipment is shown in Figure 6.
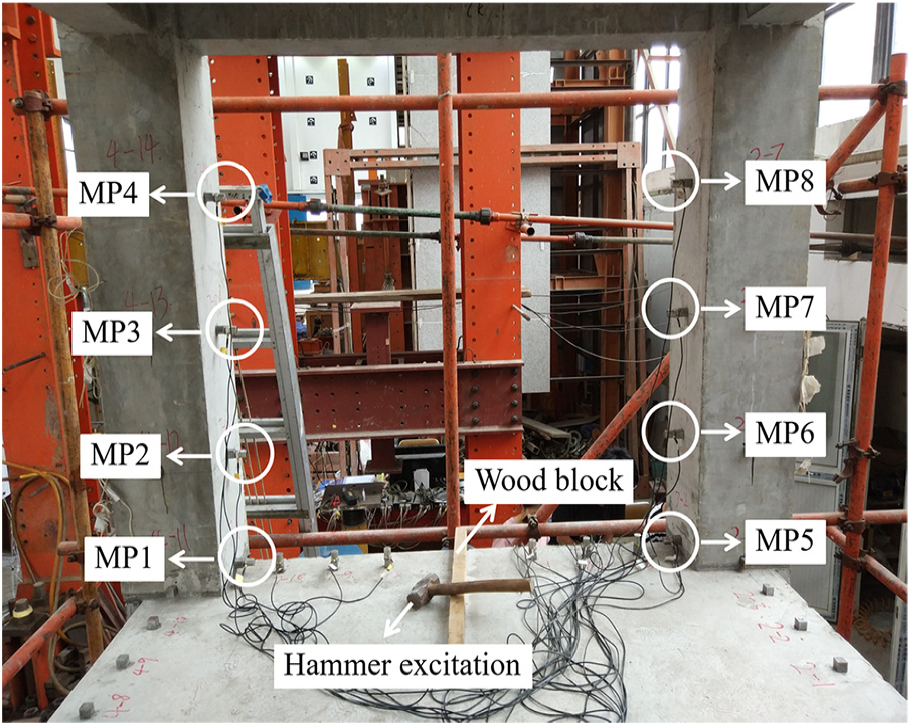
Arrangement of experimental equipment.
Experimental process
Taking case 6 as an example, the experimental steps are as follows:
The accelerometers are arranged along the column height. It should be noticed that the surface where MPs are located is the closest to the EP, as shown in Figure 4.
One person evenly knocks on EP 5-2 with a hammer, and each time the intensity of striking is as far as possible to maintain homogeneity. At the same time, the acceleration time-history curves of each measuring point are recorded by the data collection system.
Results and analysis
Acceleration responses
Acceleration responses of each MP in the seven cases are recorded. The acceleration responses of all measuring points in cases 1–7 are similar; therefore, case 1 is randomly selected to show the acceleration time-history curves of MP1–MP8 in Figure 7 (all are representative excerpts). MP1–MP4 are located in nondefectivecolumn 1, and MP5–MP8 are located in defectivecolumn 2. In the macro view, it can be observed from Figure 7(a) and (b) that for nondefective column 1, the responses of MP2–MP4 are similar in shape and amplitude, while MP1 is not in accordance with them. In Figure 7(e)–(h), for defective column 2, the responses of MP5, MP7, and MP8 are similar, while MP6 is inconsistent with them.

Acceleration responses of MP1–MP8 in case 1: (a) acceleration responses of MP1 in case 1, (b) acceleration responses of MP2 in case 1, (c) acceleration responses of MP3 in case 1, (d) acceleration responses of MP4 in case 1, (e) acceleration responses of MP5 in case 1, (f) acceleration responses of MP6 in case 1, (g) acceleration responses of MP7 in case 1, and (h) acceleration responses of MP8 in case 1.
Comparing the acceleration responses in four pairs of MPs, the differences of MP1_MP5 and MP2_MP6 are more obvious than those of MP3_MP7 and MP4_MP8. It means that MP1_MP5 and MP2_MP6 are more sensitive to grout sleeve defects than others. This is because these MPs are more close to sleeves.
Energy spectrum analysis
During the experiment, the hammer intensity in different cases cannot always be maintained the same; therefore, it is insignificant to compare the absolute values of wavelet packet energy. In order to further analyze acceleration responses and account for energy transfer in different cases, the top 10 normalized energy
Figure 8 shows the energy spectrum analysis. The number marked on the histogram represents the node number of the frequency band. In each histogram, from the bottom to the top, the normalized energy is sorted by values in descending order. The normalized energy is recorded as No. n (n = 1, 2, …, 10). For example, the second normalized energy is recorded as No. 2, and the energy node number of No. 2 of MP1 in case 1 is 5568.

Energy spectrum analysis: (a) energy spectrum in case 1, (b) energy spectrum in case 2, (c) energy spectrum in case 3, (d) energy spectrum in case 4, (e) energy spectrum in case 5, (f) energy spectrum in case 6, and (g) energy spectrum in case 7.
In Figure 8, comparing the pairs of MPs in every case, the values of first 10 normalized energy are different, and the energy node numbers also change, which indicates that the frequency band energy has transferred. For example, when the energy spectrum of MP1 is compared with that of MP5 in case 1, the value of No. 1 in MP1 is 5.0% and the corresponding node number is 5376, while the value of No. 1 in MP5 is 7.4% and the corresponding node number is 7296.
Table 2 shows the sum of changed energy nodes in all seven cases. For instance, in case 2, Figure 8(b) shows that the node number of No. 1 in MP1, MP3, and MP4 is 5376, but in MP5, MP7, and MP8 it is 7296, which means all the node numbers of No. 1 changed in MP1_MP5, MP3_MP7, and MP4_MP8. In MP2_MP6, the node number remains the same, which is 5376. Therefore, in case 2, the sum of changed nodes in No. 1 is 3 for the four pairs of MPs.
Sum of changed energy nodes in different cases.

Cases 1–4 are located in the longitudinal direction of frame structure, and cases 5–7 are located in the transverse direction. Considering the differences in boundary conditions, cases 1–4 and cases 5–7 of the experiment are separately analyzed.
For cases 1–4 located in the longitudinal direction, the sum of changed nodes in top 10 normalized energy is 39, 38, 28, and 34, respectively. Analyzing the defect degree, cases 1 and 2 are the most severe, followed by case 4, and case 3 is the least, which has a positive correlation with the sum of changed nodes. For cases 5–7 located in the transverse direction, the sum of changed nodes in top 10 normalized energy is 20, 31, and 23, respectively. Analyzing the defect degree, case 6 is the most severe, followed by case 7, and case 5 is the least, which also has a positive correlation with the sum of changed nodes.
It can be summed up that with the increase in defect degree, the sum of changed nodes in top 10 energy ratios becomes bigger. By analyzing the top 10 energy ratios, the defect degree can be determined preliminarily.
Defect identification indexes
Three indexes PET, ERVD, and ESAD introduced in section “Defect identification indexes” are used to identify the defect of experimental structure. In accordance with section “Energy spectrum analysis,” cases 1–4 and cases 5–7 of the experimental structure are also separately analyzed.
PET
Defect identification index PET is calculated according to equation (4). Figure 9(a) and (b) shows the individual PET values in cases 1–4 and cases 5–7. Taking MP1_MP5, for example, the values in cases 1–4 are, respectively, 54.41, 56.06, 39.96, and 44.58. Generally, PET values in cases 1–4 are increased with column defect degree, except for MP2_MP6. In cases 5–7, PET values of MP1_MP5, MP3_MP7, and MP4_MP8 are also increased with column defect degree, except for MP2_MP6.
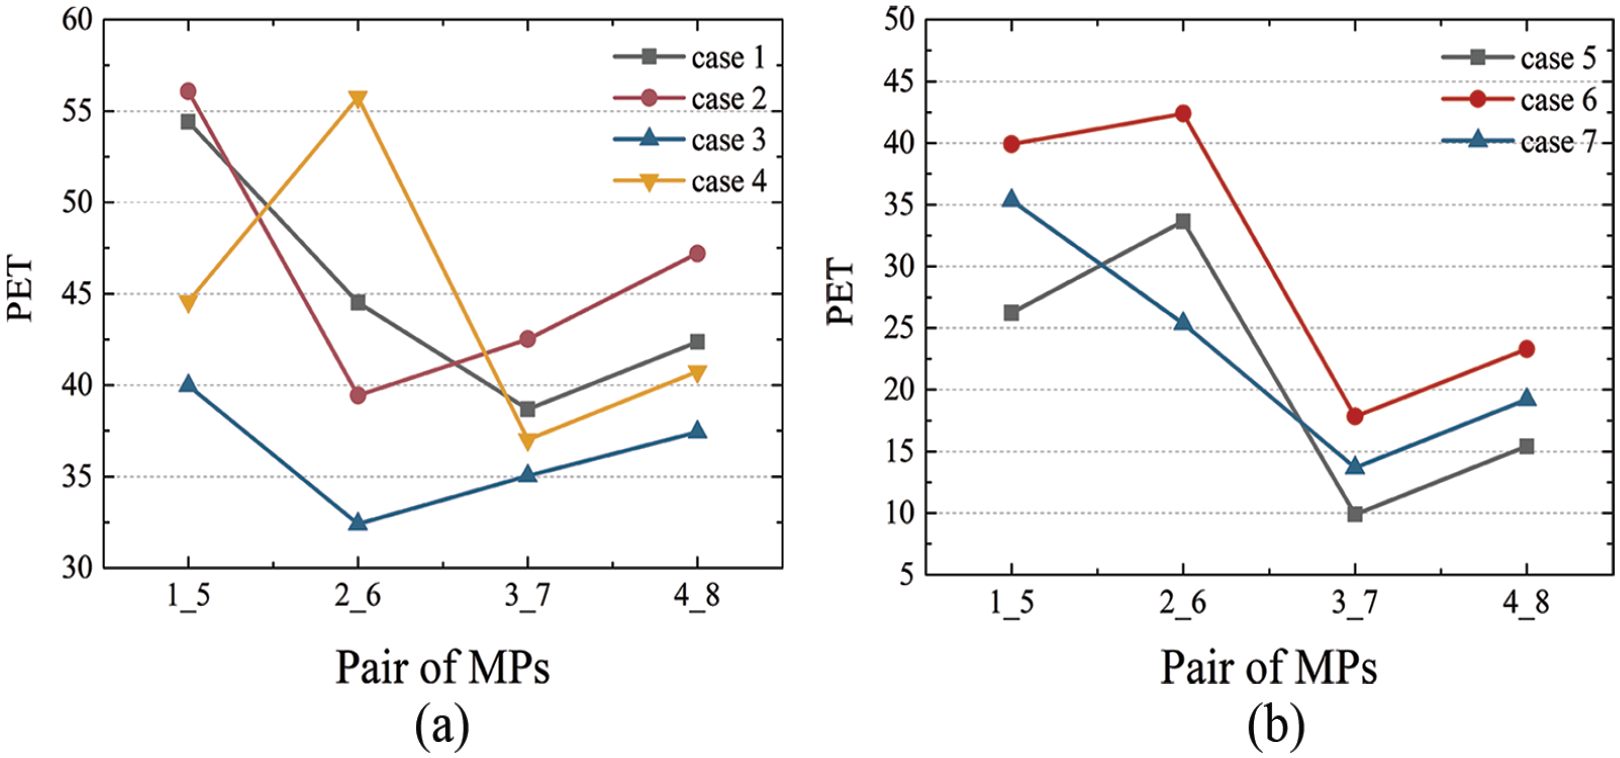
Individual PET in cases 1–7: (a) individual PET in cases 1–4 and (b) individual PET in cases 5–7.
Figure 10(a) and (b) shows the total PET values in cases 1–4 and cases 5–7 separately. For instance, in case 1, the total value 179.97 is the sum of individual value 54.4 in MP1_5, 44.52 in MP2_MP 6, 38.68 in MP3_MP 7, and 42.37 in MP4_MP 8. The total PET values in cases 2–4 are 185.22, 144.84, and 178.09. It is found that the total values of PET in each case are positively correlated with column defect degree. In addition, it should be noted that although the defect degree of case 1 and case 2 are the same, there are subtle differences between the values of case 1 and case 2. This is because under every hammer excitation, the waveforms of acceleration time-history curves are different.

Total PET in cases 1–7: (a) total PET in cases 1–4 and (b) total PET in cases 5–7.
ERVD
Defect identification index ERVD is calculated according to equations (5)–(7). Figure 11(a) and (b) shows the individual ERVD values in cases 1–4 and cases 5–7. In cases 1–4, for MP1_MP5, the values are 1.38, 1.49, 0.68, and 1.00, respectively, which means the values increase with column defect degree. For MP2_MP6, MP3_MP7, and MP4_MP8, the values cannot indicate defect degree. In cases 5–7, the individual PET values are positively correlated with column defect degree, except for MP2_MP6.

Individual ERVD in cases 1–7: (a) individual ERVD in cases 1–4 and (b) individual ERVD in cases 5–7.
Figure 12(a) and (b) shows the total ERVD values in cases 1–4 and cases 5–7. First, cases 1–4 are analyzed. In cases 1 and 2, defect degree is the most severe, and the corresponding total ERVD values 5.08 and 4.85 are relatively greater than those of cases 3 and 4. In case 4, the defect degree is in the middle with two sleeves ungrouted, in which the total ERVD value 4.03 is greater than that of case 3 with one sleeve ungrouted. Then, analyzing cases 5–7, total ERVD value 3.33 is the biggest in case 6 with three sleeves ungrouted, 1.71 is the second in case 7 with two sleeves ungrouted, and 1.6 is the minimum in case 5 with one sleeve ungrouted. The results show that with the increase of defect degree, the total ERVD value becomes larger.

Total ERVD in cases 1–7: (a) total ERVD in cases 1–4 and (b) total ERVD in cases 5–7.
ESAD
Defect identification index ESAD is calculated according to equations (8)–(10). Figure 13(a) and (b) shows the individual ESAD values in cases 1–4 and cases 5–7. In cases 1–4, the value of MP1_MP5 is 0.12, 0.14, 0.075, and 0.078, respectively, which can indicate defect degree. However, the values of MP2_MP6, MP3_MP7, and MP4_MP8 are not related to defect degree. In cases 6, 7, and 5, the individual ESAD values of MP3_MP7 are 0.0033, 0.015, and 0.006, which are increased with column defect degree, and the same law exists in MP4_MP8 with an exception of MP1_MP5 and MP2_MP6.
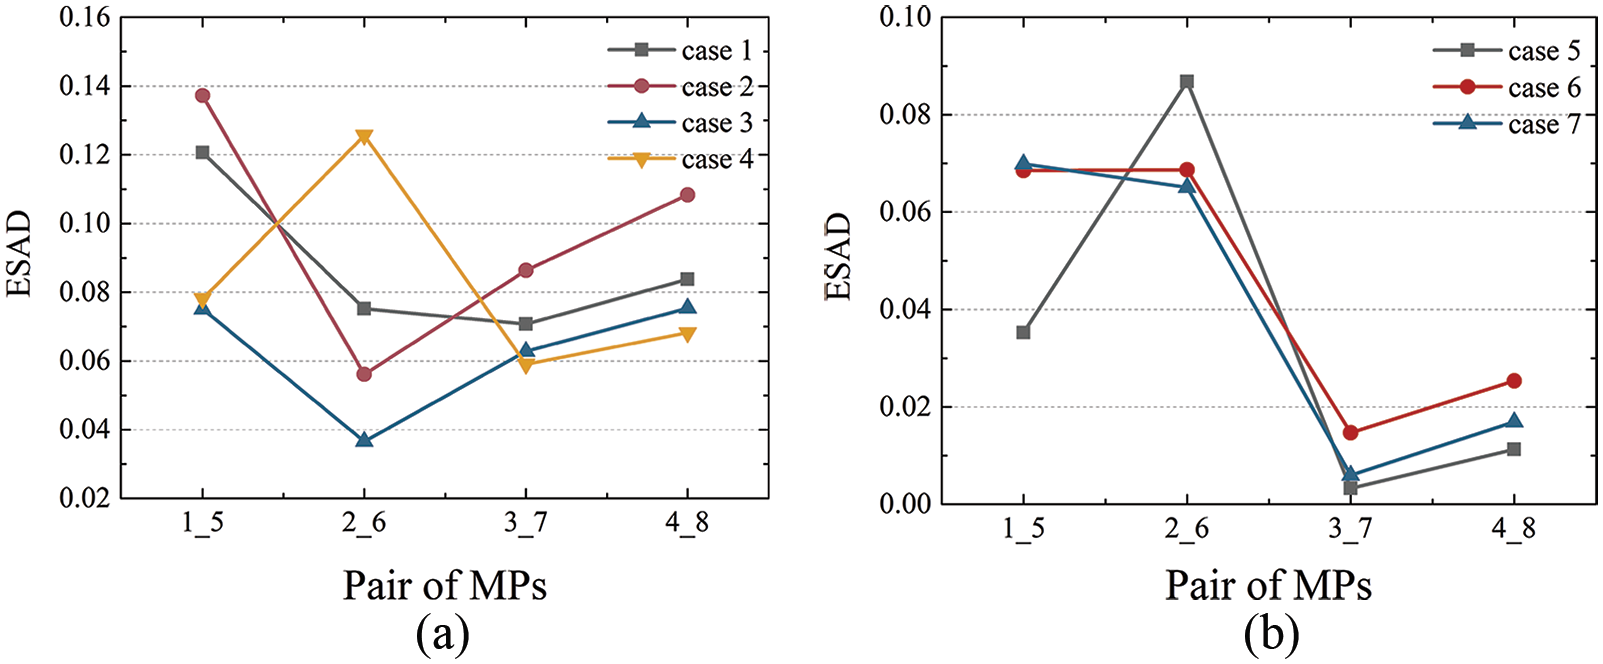
Individual ESAD in cases 1–7: (a) individual ESAD in cases 1–4 and (b) individual ESAD in cases 5–7.
Figure 14(a) and (b) shows the total values of ESAD in cases 1–4 and cases 5–7, respectively. First, cases 1–4 are analyzed. For cases 1 and 2 with three sleeves ungrouted, the total ESAD values are separately 0.35 and 0.39. For cases 4 and 3, in which the number of ungrouted sleeves is 2 and 1, respectively, the corresponding values are 0.33 and 0.25. In cases 6, 7, and 5, in which the relevant number of ungrouted sleeves is 3, 2, and 1, separately, the total ESAD values are 0.18, 0.16, and 0.14, respectively. The results show that the bigger the total ESAD value, the severe the defect degree.

Total ESAD in cases 1–7: (a) total ESAD in cases 1–4 and (b) total ESAD in cases 5–7.
Comparison of PET, ERVD, and ESAD
Considering the individual values in each pair of MPs, the defect identification result of PET is the best, and that of ESAD is the worst. But by analyzing the individual PET values in cases 1–4 and cases 5–7, there is still one pair of MP2 and MP6 which cannot indicate the defects. That is to say, the individual PET, ERVD, and ESAD values of each pair of MPs cannot well identify the structural defects.
Considering the total values of PET, ERVD, and ESAD in the second floor, all can be positively correlated with column defect degree. That is to say, by analyzing the total values of PET, ERVD, and ESAD, grout defects in sleeves are identified, and the values become bigger with the increase in defect degree. At the same time, it should be noted that parts of columns in the first floor are defective. The above proves that the identification of defects based on PET, ERVD and ESAD is not influenced by the defects of other floor obviously.
It is known that the defect degree in case 3 is the minimum among cases 1–4, and the defect degree in case 5 is the minimum among cases 5–7. For PET, ERVD, and ESAD, the increasing rates of total values in cases 1, 2, and 4 are calculated compared with those in case 3, and the increasing rates of total values in cases 6 and 7 are calculated compared with those in case 5, as shown in Table 3. For example, the total values of PET in cases 1–4 are, respectively, 179.97, 185.22, 144.84 and 178.09, and the increasing rates in cases 1, 2, and 4 are 24%, 28% and 23% compared with those in case 3. Comparing values of each column in Table 3, the maximum is marked in red and bold. It can be observed that the values of ERVD are bigger than those of PET and ESAD in cases 1, 2, 4, and 6, except for case 7. The above indicates that the variation of ERVD is greater than PET and ESAD in different defect degrees generally, which represents ERVD is more sensitive to identify structural defects than PET and ESAD. This is because with the increase in the decomposition level of wavelet packet, the observed noise signal decreases correspondingly, and the energy of the observed noise signal is distributed more evenly in each frequency band. Compared with indices PET and ESAD, the average value of all energy frequency bands is introduced in ERVD, which means the interference of noise is weakened. As a result, ERVD is the optimum defect identification index in the three.
Increasing rate of total values of PET, ERVD, and ESAD.

PET: percentage of energy transfer; ERVD: energy ratio variation deviation; ESAD: energy spectrum average deviation.
Robustness analysis of ERVD
Through the above analysis, ERVD is a more sensitive grout defect identification index compared with PET and ESAD. Therefore, ERVD is more reasonable in practical engineering. However, noise exists in the obtained signal inevitably. In order to discuss the ability of ERVD to resist noise and provide justified suggestions for grout defect detection based on ERVD in practical engineering, the robustness of ERVD is explored.
Gaussian white noise, which is mutually independent and normally distributed, is adopted in signal processing. There are two types of noises, including additive white noise mainly caused by environment and multiplicative white noise mainly caused by unreasonable signal channel. The basic models of one-dimensional signal including additive white noise and multiplicative white noise are shown in equations (11) and (12), respectively


where
Additive white Gaussian noises of 0.01%, 0.02%, 0.05%, and 0.1% noise level are, respectively, inputted into original experimental data based on equation (11), and multiplicative white noises of 1%, 2%, 5%, and 20% noise level are, respectively, inputted into original experimental data based on equation (12). The total values of the ERVD in different cases are calculated, as shown in Tables 4 and 5, in which
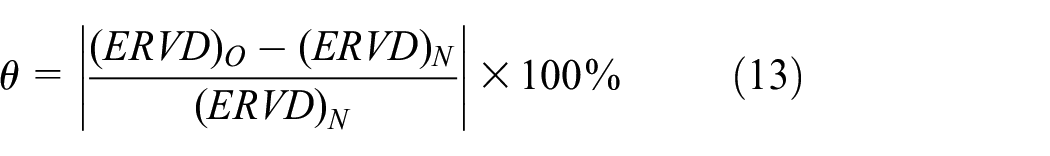
where

ERVD: energy ratio variation deviation.

ERVD: energy ratio variation deviation.
As shown in Table 4, as additive white Gaussian noise is inputted, the values of
The reason can be found by analyzing equations (11) and (12). In equation (12), the multiplicative white noise is proportional to the original response data, in which peak acceleration is percentile or even smaller. Therefore, the added multiplicative white noise is actually small. In equation (11), the additive white noise is independent, which is added directly to the original response data. Since the original response data are percentile or even smaller, the measured effective signals are easily drowned in additive white noise. As a result, attention must be paid to avoid the environmental noise during the experiment. In addition, to ensure the high signal-to-noise ratio, greater peak acceleration and total output energy should be acquired when excitation is exerted.
Conclusion
In this article, a grout sleeve defect identification method is proposed based on the external excitation and wavelet packet analysis. The experiment on a 1/2-scaled two-floor precast concrete frame structure with rebar splicing by grout sleeves is carried out, and the acceleration responses in columns are collected based on the dynamic excitation technique and are analyzed based on wavelet packet decomposition. Then the energy spectrum analysis of acceleration responses is conducted. The PET, ERVD, and ESAD are defined as defect identification indexes. Finally, the comparison between PET, ERVD, and ESAD is explored, and the robustness of ERVD is analyzed.
Based on the study, the following main conclusions are drawn:
The acceleration responses of the pair of MPs located in defective column and nondefective column, respectively, are different in amplitude.
With the increase in defect degree, the sum of changed nodes in top 10 normalized energy is greater. The defect degree can be determined preliminarily based on the energy spectrum analysis.
Defect identification indexes PET, ERVD, and ESAD are positively correlated with grout defect degree and can identify structural defects. The three indexes are not influenced by the defects of other floor. ERVD is the optimum defect identification index among the three.
The ERVD robustness of original signal with multiplicative white Gaussian noises inputted is better than that with additive white Gaussian noises inputted. High signal-to-noise ratio should be ensured during the experiment.
Footnotes
Handling Editor: Edward Bednarz
Declaration of conflicting interests
The author(s) declared no potential conflicts of interest with respect to the research, authorship, and/or publication of this article.
Funding
The author(s) disclosed receipt of the following financial support for the research, authorship, and/or publication of this article: The authors are grateful for the financial support received in part from the National Key Research and Development Program of China (2016YFC0701800).