
Abstract
Supported by the remarkable progress across many technological domains, the Internet of Things (IoT) ecosystem demonstrates steady growth over the few past years. This growth enables a number of new exciting applications. Nonetheless, hardly one can say today that the utility of the IoT is used to its full potential. This fact is especially notable for the monitoring applications deployed in remote areas. To address the needs of these use cases, in the article we propose a solution based on the combination of three key technologies: the low-power wide area networks, the unmanned aerial vehicles, and the wireless power transfer. In the article, we first detail the novel concept of a wireless power transfer-enabled unmanned aerial vehicle employed to charge the LoRaWAN sensor nodes. Then, via extensive simulations and analysis of an illustrative LoRaWAN application, we investigate both technical and, notably, business performance indicators, and compare them against the ones for a baseline scenario with no unmanned aerial vehicle. Our results illustratively demonstrate that in the long-term perspective, the inclusion of a wireless power transfer-enabled drone may drastically reduce the system’s operating expenses. At the very same time, our results highlight the limits, bottlenecks, and trade-offs related to the proposed concept, thus providing the basis and calling for further investigation.
Keywords
Introduction
The importance of collecting more and more data about the world around us grows every day. This fact drives the development of the wireless sensing solution and brings novel devices to the market. Many of these devices will become the components of one single entity—the Internet of Things (IoT).1,2 The concept of IoT, which refers to interconnecting the diverse physical objects using information and communication technology (ICT), is associated, as a rule, with the development of the three technologies. These are radio frequency identification (RFID), wireless sensor networks (WSNs), and machine-to-machine (M2M) communications.
Among all the various technologies composing the contemporary IoT and M2M communication landscape, 3 the ones belonging to the domain of low-power wide area networks (LPWANs) 4 stand out of the mass. The market analyses show that these technologies demonstrate the fastest growth rate among all IoT communication solutions. 5 This is hardly surprising, since the LPWAN technologies complement existing cellular mobile network and short-range technologies, by combining the low costs, small power consumption, and broad coverage within one single solution.
Of the several LPWAN technologies, which are currently present on the market, the one named LoRaWAN 6 leads with respect to the number of the chipsets shipped. 7 The physical layer of the technology is based on the use of proper chirp-spread-spectrum modulation technique named LoRa, patented by the Semtech company. The media access and network layers of LoRaWAN are specified by the LoRa Alliance in the respective documents. 8
A LoRaWAN network is composed of a single network server (NS), one or multiple gateways (GWs), and the end devices (EDs). All the data sent by the EDs go through GWs to the NS, and vice versa. The EDs, depending on the state of the radio channel between them and the GW, may utilize one of several quasi-orthogonal spreading factors (SFs) for communication. In essence, the selection of the SF enables a device to trade the on-air transmission time (and thus the consumed energy) for the communication range. The EDs typically employ an ALOHA-like media access mechanism, randomly selecting one of the supported by the network channels. In Europe, the LoRaWAN networks are usually deployed in the license-free Industrial, Scientific and Medical (ISM) 868 MHz band. Importantly, unlike many other LPWAN technologies, LoRaWAN networks can be deployed not only by the telecom operators (theso-called “public” networks) but also by private organizations and individuals (the so-called “private” networks). This flexibility makes LoRaWAN technology very versatile and well-suited for the sheer diversityof wide-area monitoring use cases, especially in the contexts of smart city and agriculture, nature, and intelligent infrastructure monitoring.
At the same time, there are two other exciting technologies, which are not a part of the IoT ecosystem themselves but which can enable new exciting opportunities for it. These are the unmanned aerial vehicle (UAV). Note that the terms “drone” and “UAV” are used interchangeably in this article. Also, the terms “end device,”“ED,” and “sensor node” are used interchangeably. 9 and wireless power transfer (WPT). 10 The UAV refers to an aircraft that performs flight without a pilot onboard fully autonomously or under the control of an operator from the land. Previously, the UAVs were used primarily for military purposes, but today their application range includes many civilian use cases—search and rescue, land management, shipment delivery, to name just a few. The WPT refers to the idea of transferring the energy between the two points without using wires. These technologies have recently entered the everyday life, with the wireless charging of smartphones and other handheld electronics being, probably, the most illustrative example.
Motivated by the remarkable progress for these three individual technologies, in this article, we propose combining them, in order to enable the UAV charging the LoRaWAN sensor nodes through WPT. The conceptualization of such a system constitutes the first contribution and the key novelty of this article. By means of network simulations and analytic methods, we characterize both the technical and, notably, the business performance indicators of the proposed system. Note, that, to the best of our knowledge, no attempts to characterize the monetary costs and benefits for using a UAV in the context of an LPWA network have been carried earlier. These results constitute the second contribution of the article. Basing our study on the carefully selected from the state-of-the-art literature realistic technical parameters, we demonstrate by means of extensive simulations that the use of a WPT-enabled drone in a typical, and thus illustrative, LoRaWAN application enables to reduce the operating expenses (OPEX) of a dense network in a long-term perspective. At the same time, we point out some of the practical trade-offs and limitations, including, for example, the number of the nodes which can be served by a single UAV. This is the third significant contribution of this article.
In our opinion, the systems similar to the one proposed are especially beneficial for the scenarios with the sensor nodes located in remote and hard-to-reach areas. The service of such sensors inquires substantial costs, which can be reduced or even nulled by employing the proposed concept. Among the practical applications, which will potentially benefit from using the proposed system can be listed the various industrial (e.g., sensors attached to the wind turbines or factory chimneys), nature (e.g., seismic sensors located around volcanoes), and infrastructure (e.g., dams, bridges, and tunnels) monitoring use cases.
The article is organized as follows. We start by discussing the related works in section “Related works.” In section “Proposed concept and system model,” we sketch our proposed concept and detail the system model. In section “Models and assumptions,” we describe and justify our models and assumptions. In section “Results,” we first discuss our simulation setup and then present the selected results, highlighting the technical performance characteristics and the business-related performance metrics. In section “Discussion,” we discuss the obtained results and limitations of our models. Finally in section “Conclusion and further works”, we summarize the key conclusions and discuss the possible directions for further works in final section.
Related works
Even though we are not aware of any combination of all the three targeted technologies, namely LPWAN, UAV, and WPT, their partial combinations have been considered by other scholars. Specifically, Carrillo and Seki 11 conceptualized a LoRaWAN GW with the long-term evolution (LTE) backbone, which is mounted on a drone and is used to improve the performance of communication in rural areas. The similar approach was used in Trasviña-Moreno et al. 12 to collect the data from the environmental sensing buoys deployed in the sea. In Sharma et al., 13 a flying LoRaWAN GW as a part of an intelligent transportation system was proposed. The effects of mobility and use of drone-assisted communication in the context of mission-critical machine-type communication were also investigated in Orsino et al. 14
The studies addressing the combination of UAV and WPT are much more numerous and focus on the two main ideas. The former one implies the use of WPT to charge the drone itself. The respective solution is discussed in Jawad et al. 15 A practical drone charging system based on the magnetic resonance principles is reported in Xiao et al. 16 The employment of radio frequency (RF)-based WPT for charging the miniature drones was investigated in Gómez-Tornero et al. 17 The possibility of allocating a designated frequency band for the RF-based WPT to charge the UAVs was proposed in Yong et al. 18
Another possibility investigated in the earlier studies is the WPT between the UAV and sensing devices. For example, in Xu et al.,19,20 the mechanisms for defining the optimal path for a drone featuring RF-based WPT were proposed. The real-life solutions for transferring the energy from a UAV to the sensors were instrumented and evaluated in-field in Chen et al. 21 The practical drone-based simultaneous wireless power and information transfer (SWIPT) solution for battery-less sensors was reported in He et al. 22
Finally, to the best of our knowledge, the combinations of WPT and LPWANs have been addressed by only a few studies. Danish et al. 23 investigated how the in-band RF-based WPT toward LoRaWAN EDs affects the communication performance of the network. Galinina et al. 24 conceptualized the idea of incentivizing the owners of wearables to participate in collaborative data collection by providing the energy for their devices using WPT. Among the several scenarios considered in this study, one suggests the use of drones and implies connectivity based on LoRaWAN.
Proposed concept and system model
As the target scenario for this work, we selected a typical wide-area monitoring sensor network. 25 Such networks are often deployed to monitor the natural environment, plants, civil, or roadside infrastructure in a suburban or rural environment. The network consists of the EDs, measuring the parameters of interest (e.g., the tensions of material in constructions or the humidity of the soil), and periodically reporting their measurements along with their status (e.g., their battery level) to a GW. 26 Specifically, in this study, we consider LoRaWAN to be the radio technology of choice.
Most often such systems are designed implying sensors being powered either by mains or by batteries. The former approach limits drastically the locations, where the EDs can be deployed and introduces substantial extra costs for wiring. The latter introduces additional service costs for replacing the batteries or the sensor nodes as a whole, once they run out of energy.
Therefore, in this article, we propose another approach to address this challenge. Specifically, we introduce into the system the UAV, which is equipped with a WPT solution based on inductive coupling, and using which it can recharge the sensor nodes, equipped with the WPT receivers. The described scenario is illustrated in Figure 1.

Key components of the proposed system.
Models and assumptions
In the following subsections, we detail and justify the key models and assumptions concerning communication, energy consumption and transfer, mobility, and expenses, which we employ in our analyses and simulations.
Communication models
Radio channel propagation model
We consider that the LPWAN is deployed in a suburban environment and thus the propagation of the radio signal is described, similarly to Van den Abeele et al., 27 by the “LogDistancePropagationLoss” model with an exponent equal to 3 and the reference loss of 46.678 dB at a 1-m distance. Specifically, the value of the radio signal power received by the GW is given by

where d is the distance between ED and GW;
Simulation parameters.
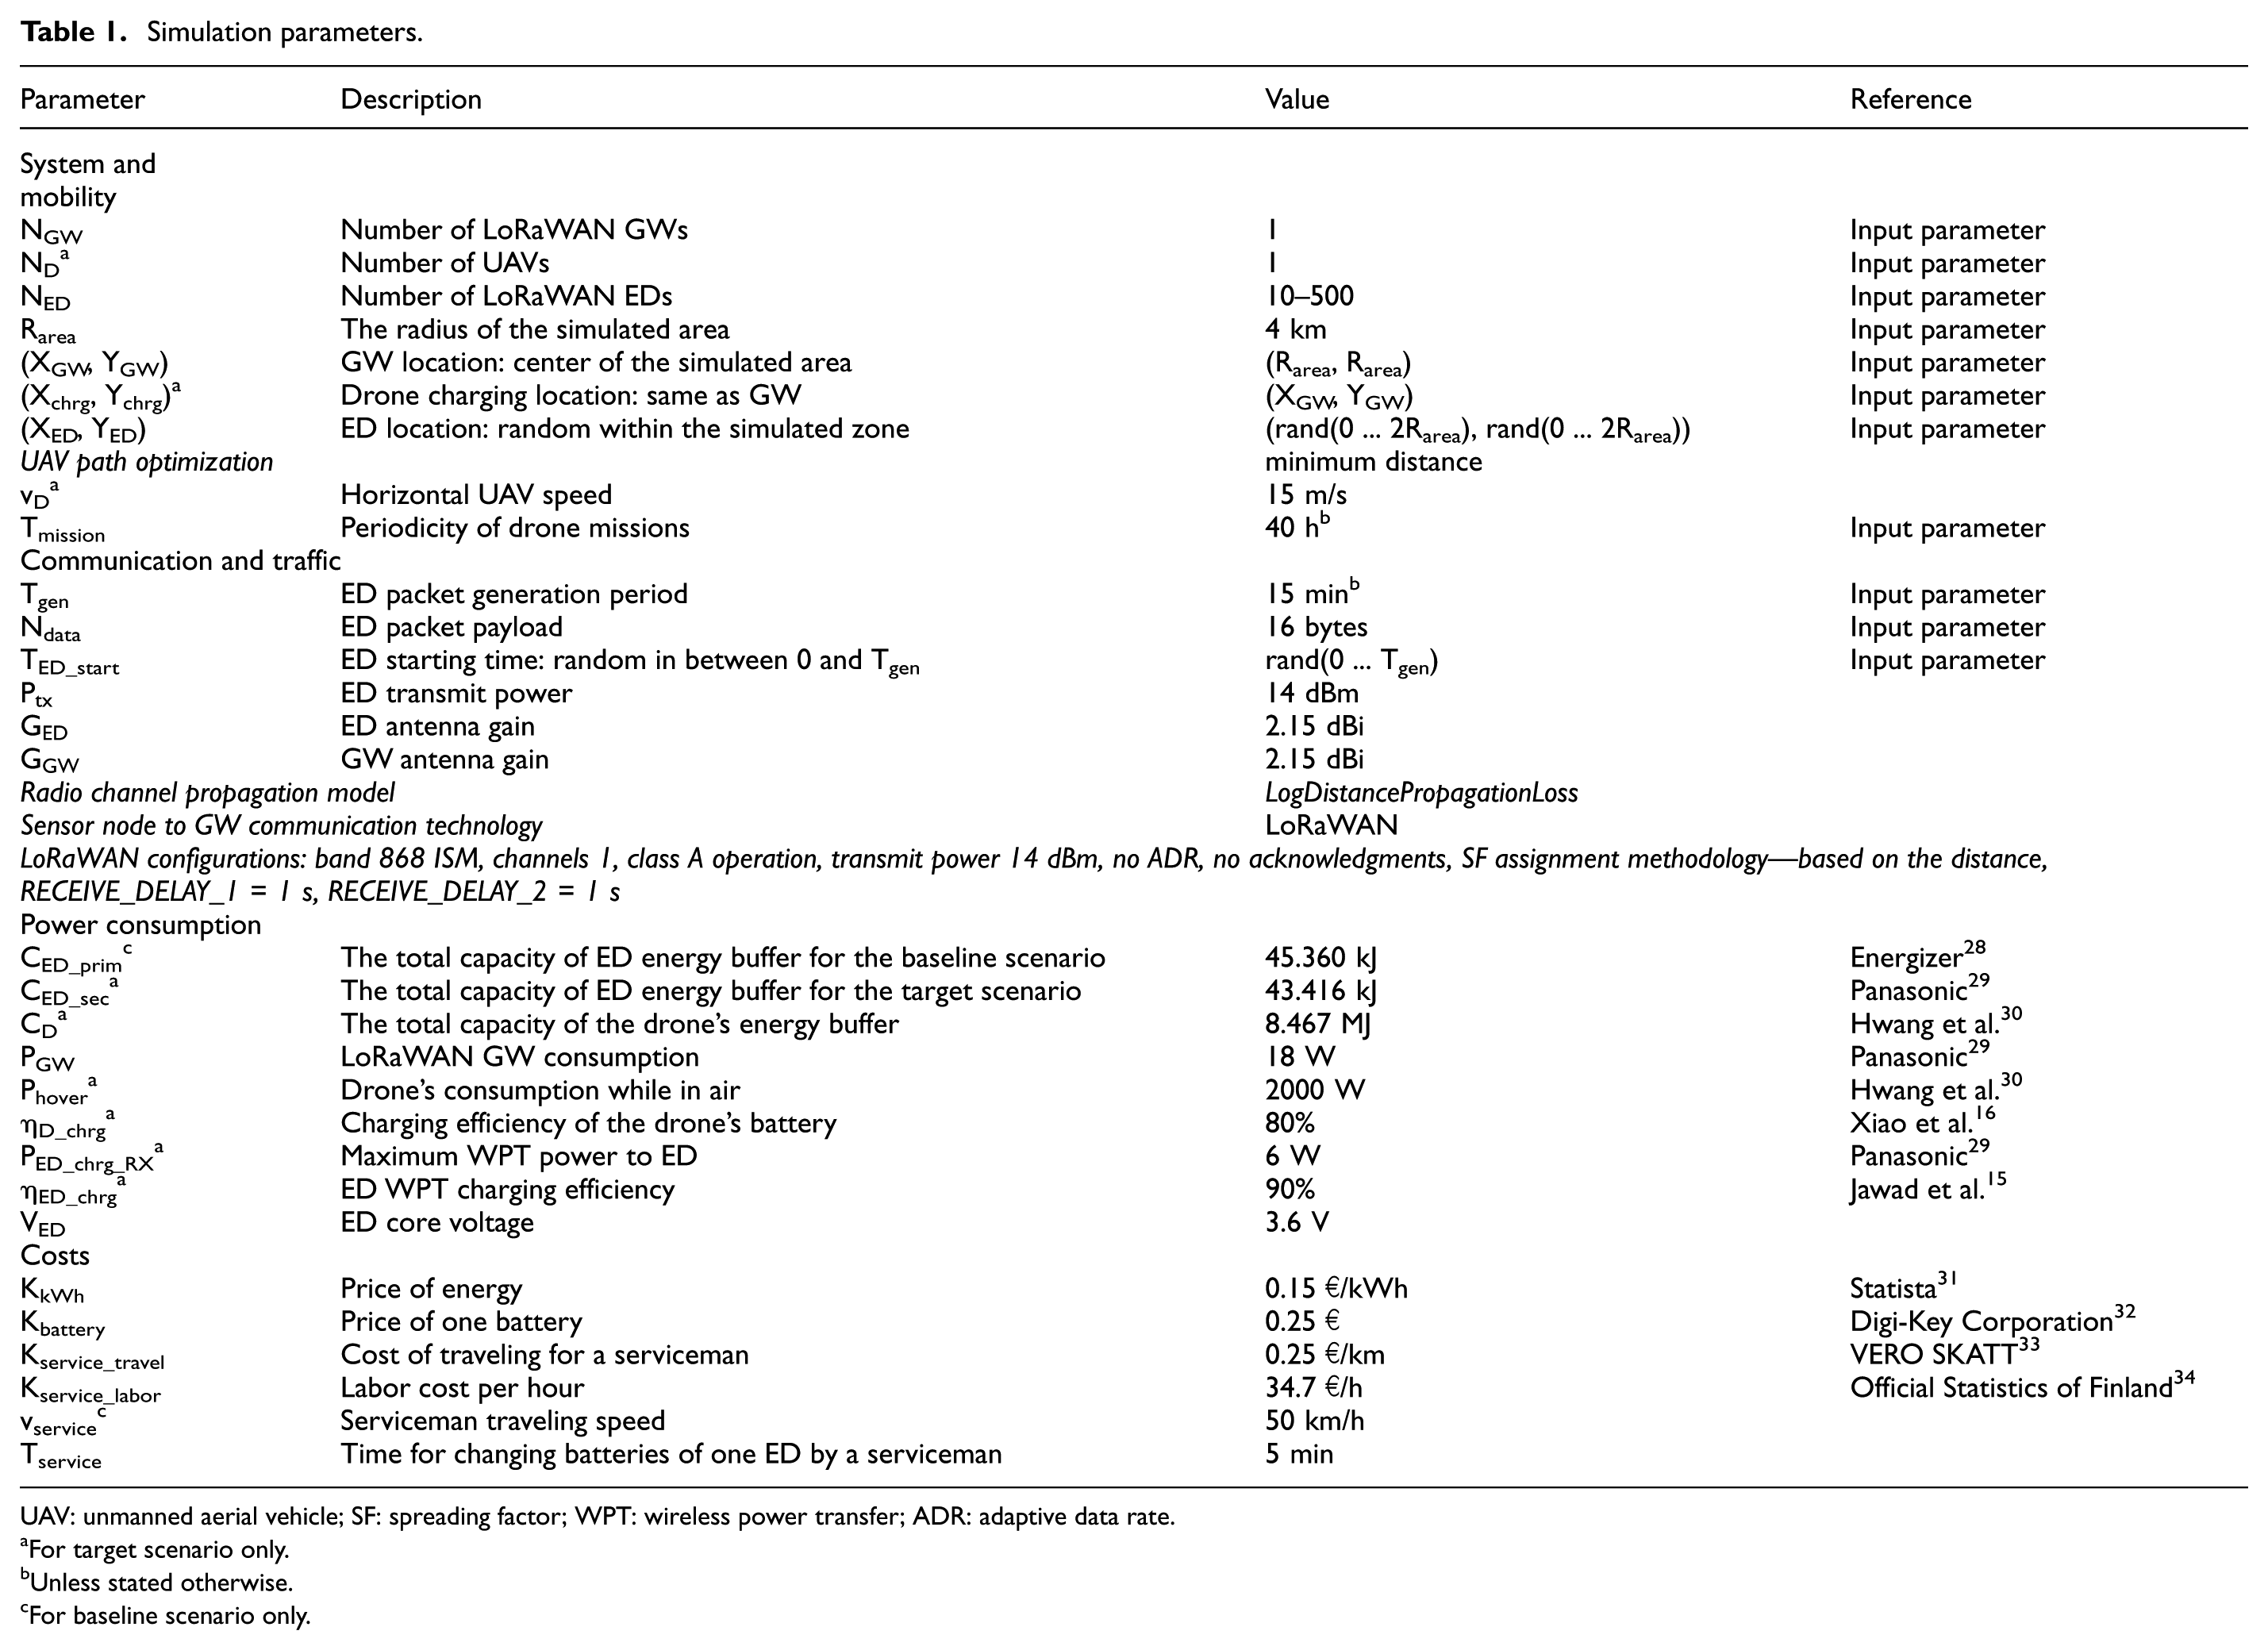
UAV: unmanned aerial vehicle; SF: spreading factor; WPT: wireless power transfer; ADR: adaptive data rate.
For target scenario only.
Unless stated otherwise.
For baseline scenario only.
LoRaWAN collision model
The previous studies35–37 have shown that communication in LoRaWAN networks is affected by both inter- and intra-SF interferences. To account for these effects, we employ the model based on the results, reported in Qadir et al. 26
To determine whether a target packet is correctly received, we compare its signal power level at the GW with that of each other packet, transmitted during the same time in the same frequency channel. If the difference in the power levels of the target packet and each of the colliding packets exceeds the threshold values given in Table 2 for the respective SF combination, we consider the target packet to be received correctly. Otherwise, we consider the target packet to get corrupted.

SF: spreading factor.
To give an example, consider that the GW receives a target packet with SF7 with the power of −70 dBm. If there is another SF7 packet with the power below −76 dBm, the target packet gets received correctly. Otherwise—the target packet is considered to be corrupted and lost. Now, consider a collision of the very same target packet and a packet with SF8. To be able to receive the target packet, the power level of the colliding SF8 packet should be below −54 dBm, that is, not more than 16 dB stronger than the target packet. Note that if the power levels of both SF7 and SF8 packets are about the same—both packets are received correctly.
Even though the described model does not reflect all the complexity of LoRa modulation interference behavior (e.g., it does not account for the interference between the adjacent frequency channels), it provides a reasonable approximation of the most notable effects. Note also, that in what follows we assume that a GW at each moment of time is receiving at maximum one packet over each possible SF (i.e. SF7 … SF12). This matches with the way the real-life LoRaWAN GW equipment works.
Energy consumption and wireless power transfer models
LoRaWAN sensor consumption
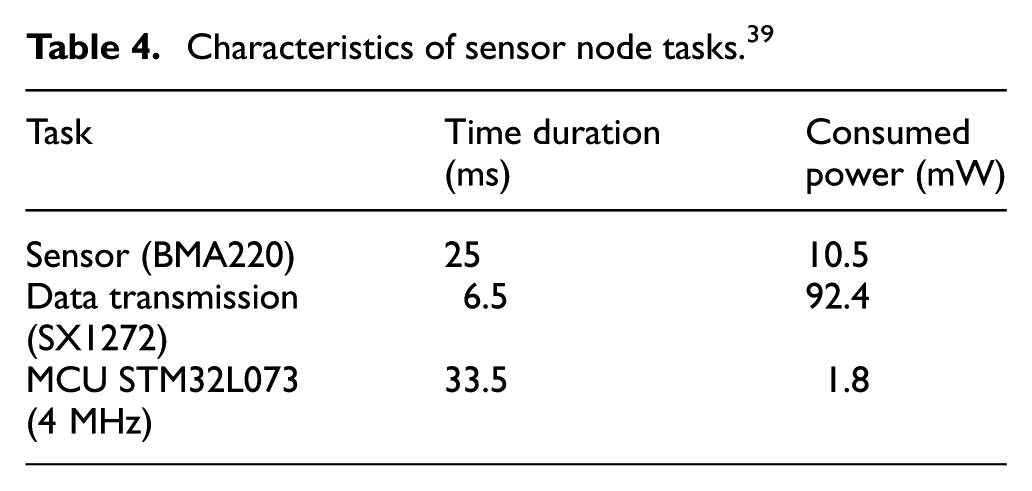
We base our energy consumption model on the results reported in Casals et al. 38 and Bouguera et al. 39 Specifically, we imply that the sensor nodes operate as class A LoRaWAN devices and send their data in unacknowledged mode. Therefore, we use equation (2) and the data from Table 3 to model the ED’s consumption. The consumption of the sensor (10.5 mW) was obtained from Table 4 in Bouguera et al. 39

States, variables, and their values for LoRaWAN unacknowledged transmission. 38

Characteristics of sensor node tasks. 39
In equation (2)
For our baseline scenario, we assume that a sensor node is powered by three primary alkaline AA-sized batteries, each having 1.5 V nominal voltage and the typical capacity of 2800 mAh. 28 Therefore, the total capacity of the ED’s energy buffer equals CED_prim = 45.36 kJ. For the UAV-based scenario, we consider that the Lithium-ion batteries with a total capacity of CED_sec = 43.416 kJ (e.g., a single Panasonic NCR18650B 18650 cell: 29 3.6 V nominal voltage, 3350 mA h typical capacity, 1.625 A charging current) power the sensor nodes. For both these cases, we consider the lifetime of a sensor node to be described by a linear battery model—equation (3) from Rukpakavong et al., 40 that is
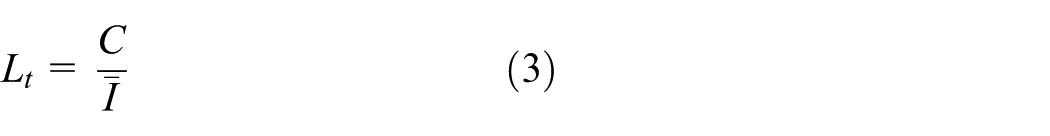
where C is the battery capacity in mAh, and I is the average current consumed (i.e.
LoRaWAN gateway consumption
Given that a typical LoRaWAN sensor node can send its data at any moment of time, the LoRaWAN GW has to monitor and be able to receive the radio frames in each radio channel at any moment. Therefore, without the loss of generality, we consider the LoRaWAN GW power consumption to be constant and equal to PGW = 18 W. 41 We assume that the GW is mains powered.
The power consumption of a flying drone
We consider the UAV to be a low-altitude autonomous multi-rotor drone. The previous studies,30,42,43 reveal that the power consumed by such a drone while in the air does not change substantially if the horizontal speed stays below 15 m/s. Therefore, we assume the consumption of the drone in-air to be constant and equal Phover = 2000 W (e.g., the drone measured in Hwang et al. 30 ). Also, we assume that after leaving for the mission, the drone stays all the time in the air, even when transferring the energy to the EDs. This assumption is reasonable, since the sensors may be placed at locations, preventing a drone from landing near them (e.g., on masts, surfaces of the wall, and so on).
Note, that we consider that the available drone payload is primarily utilized for carrying the energy storage elements. Also, we imply that all the batteries on the drone compose the single power domain, thus providing the energy both for the drone itself and for wirelessly charging the sensor nodes. The total energy capacity of the drone is given by CD = 8.467 MJ (three Li-Po battery packs with 49 V nominal voltage and the cumulative capacity of 48 Ah). 44 Likewise for the EDs, we imply the linear battery model for the drone.
Wireless power transfer
Finally, we imply the presence of the WPT mechanism between the UAV and the EDs based on magnetic resonant coupling principle.15,16,45 Note, that use of this technique implies that to charge a sensor, a drone needs to approach it and continuously hover at some centimeters to few meters distance 15 from it. One of the factors limiting the charging of the sensor node is the charging current of the battery on the ED, which for NCR18650B cell equals 1.625 A. 29 Therefore, we consider that the maximum power accepted by a sensor node equals PED_chrg_RX = 6 W and that the UAV always radiates this power when charging the EDs. The efficiency of the power transfer between the UAV and an ED is given by ηED_chrg = 90%. 15
Mobility and scheduling
Drone’s mobility
Without the loss of generality, we consider that the drone periodically, with a period Tmission hours, starts its mission from its charging station, located in the proximity of a LoRaWAN GW. After taking off, the drone moves from one ED to another with a constant horizontal speed of vD = 15 m/s following the minimum-cumulative-distance route, found as a solution of the “traveling salesman” problem. After reaching a sensor node, the UAV stops, hovering in the air, and charges the sensor battery to full capacity.
Furthermore, we assume that once the energy of the drone gets low (that is when the drone does not have enough energy to charge the next ED and return to its charging station), the drone returns to the charging point. There the drone’s batteries are replaced, and it continues the mission from the point, where it has stopped. Therefore, the total energy consumption of the drone is given by
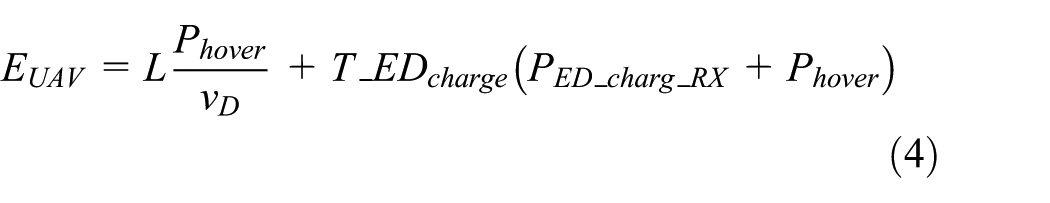
where
Cost models
Energy costs
While estimating the OPEX, we first account for the energy, consumed by the GW and to charge the drone. For this, we estimate the total energy consumption per year in Joules, convert it to kWh (i.e. 1 J = 2.78 × 10⁻⁷ kWh), and multiply by an average per-kWh price of KkWh = 0.15 €/kWh (based on the data reported in Statista 31 for Finland).
Service and battery replacements
In the case of the baseline scenario, we also account for the service costs for replacing the batteries of the sensor nodes running out of energy. These costs are composed of the three components:
The cost of the batteries, which we take equal to Kbattery = 0.25 €/piece. 32
The traveling expenses. We assume that a serviceman travels via the shortest distance route bet-ween the nodes and estimate the traveling expenses with the flat rate of Kservice_travel=0.25 €/km, as specified by the Finnish Tax Office document. 33
The labor costs calculated from the working time. The costs are composed of traveling time (implying commuting between the locations of the EDs with an average speed of vservice= 50km/h) and time needed for locating a sensor, accessing it and replacing the batteries, which we take equal to Tservice = 5 min. Based on Official Statistics of Finland, 34 we assume the labor costs of Kservice_labor = 34.7 €/h.
Results
Simulation methodology and setup
To facilitate the analysis of the network performance, we implemented all the described communication models in MATLAB environment. We also used MATLAB to find the shortest closed tour for the drone and service person by solving the traveling salesman problem (using the original MATLAB script available from MathWorks 46 ). The script has been modified to speed up the simulations by disabling, by default, the path visualization. When analyzing the power consumption and estimating the OPEX, we used the combination of MATLAB and spreadsheet software. All the relevant parameters of the models used in our simulations and analysis are listed in Table 1. Note, that the presented in the following sections results present the values obtained for over the 1000 simulation rounds, differing with respect to the EDs transmission patterns, for at least 60 different ED distributions.
Selected results
Communication performance
Figures 2–4 illustrate the selected results demonstrating the performance of the targeted network for communication. Specifically, Figure 2 provides insight into the scalability of the network. As one can see, with the increase in the number of devices, the probability of packet delivery (PDR) sharply drops. Note that, as shown in Table 1, in our simulations, we consider only a single LoRaWAN channel. A real-life LoRaWAN network can feature from three to over 16 different frequency channels, allowing the EDs to select randomly one of these channels for their uplink transmission. This increases the number of EDs supported in these networks with the comparable levels of PDR proportionally to the number of the channels available. Figure 3 provides further insight into how the packet losses depend on the SF of the EDs. The LoRaWAN specification 8 and the earlier studies 27 propose assigning for the devices the lowest SF enabling reliable packet reception in the presence of the noises. On the one hand, this enables to reduce the energy consumption of the EDs. On the other—this is also beneficial to the network since shorter packets have a lower chance of colliding. For our simulations, we employ the very same policy of SF assignment—the closer the ED is to the GW, the lower SF it uses. The results of this for a dense network scenario we illustrate in Figure 3. One can see, that in a dense network the packets encoded with a low SF and originating from the nearest to the GW EDs are often received correctly. The long-in-time and weak-in-power packets originating from the EDs located on the outskirts of the network interfere with the short and more-high-power packets from the nearest to the GW EDs, and often do not get through.

Effect of number of EDs on the LoRaWAN communication performance.

Mean PDR as a function of LoRaWAN ED’s SF.

Mean power consumption of an ED, as a function of its SF and packet generation interval.
Energy performance
We start investigating the energy performance of the proposed system by analyzing the mean power consumption of the EDs as a function of its SF and the period of packet generation. The respective results are presented in Figure 4. As one can see, depending on the reporting period, the power consumption differs two levels of magnitude—ranging from hundreds of microWatts and up to almost 50 mW. With the increase of the reporting period, the ED’s consumption reduces and approaches the sleep-mode level. Also, with the increase of the SF, the consumption of the ED increases non-linearly. The difference in the mean consumption between an ED with SF7 and SF12 is 1.5–3 times, depending on the packet generation period. The distribution of energy consumption between sleep and active operation is illustrated for an ED in Figure 5. Depending on the SF and the packet generation period, the sleep-mode consumption may constitute 50%–98% of the total amount of energy consumed by an ED.

The ratio of energy spent by and ED in sleep to that used for the active operation for different SFs and packet generation intervals.
Next, we focus on our baseline scenario and estimate the lifetime of the EDs, depending on the used SF and the period of reporting. These results are presented in Figure 6. The chart reveals that depending on the desired data report rate, the lifetime of the EDs may vary in the range from several months to over 6 years. Besides, one can easily see that the devices utilizing different SFs exhaust their batteries at different moments of time.

The lifetime of EDs for the baseline scenario as a function of the SF used and the interval of packet generation.
This potentially leads to two notable issues. The first one is related to the traditional SF assignment policy employed in LoRaWAN. Namely, since an SF is assigned to the EDs based on its radio channel condition—many devices located close to each other get the same SF. Therefore, if the devices with the same SF exhaust their batteries at the same time—there may be no sensed data coming from a specific holistic area. The second issue is related to the service of such devices. Since the devices with different SFs get out of order at different moments of time and given that the network has to be kept up and running—the service, such as battery replacement, will have to be carried for the EDs utilizing each SF independently. This will likely introduce additional expenses.
Finally, we focus on the energy consumption of the drone for our target scenario. For this, solving the “traveling salesman” problem, we first define the shortest closed-loop path connecting all the EDs. Note that the implied WPT technology between the UAV and the EDs needs the distance between these two to be very small. Specifically, the probability that a drone can serve several EDs simultaneously is given by
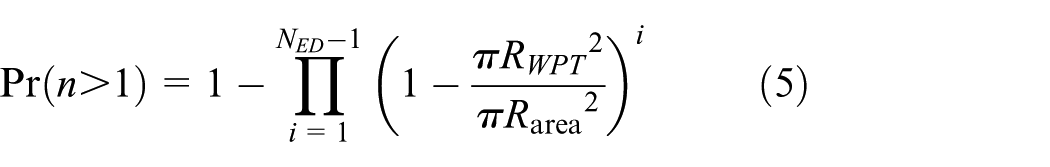
where
The mean length of the drone’s path as a function of the number of EDs in the network is illustrated in Figure 7. One can see that with the increase in the number of EDs, the length of the path also increases, but the rate of this increase if sub-linear.

Length of the shortest closed loop connecting all the EDs and the drone’s charging station as a function of the number of EDs in the network (mean, min, and max over different ED spatial distributions).
Figure 8 illustrates the energy required for UAV to charge an ED with a particular SF, depending on the period of the drone’s visit. One can see that the difference for the energy to charge the EDs with SF7 and SF12 is close to two times. With the decrease of the UAV visiting period, the amount of energy consumed for charging an ED increases linearly.

The energy needed for the drone to charge an ED as a function of its SF and report period.
Next, based on the information about the path, the consumption of the EDs and the WPT transfer model discussed, we calculate the total amount of energy, which a drone consumes for flying the route and charging all the EDs, after those being active for Tmission hours. These results are presented in Figure 9. One can see that with the increase of the number of EDs in the network, the total energy required to visit and charge them all increases sub-linearly. Nonetheless, comparing the results with the drone’s energy buffer volume listed in Table 1, one can see that the drone fully loaded with batteries can serve at best around 50 EDs during a single flight. The good thing is that with the increase of the ED density, the drone needs to travel less between the EDs. For this reason, while charging 500 EDs, the UAV will have to be recharged only five times.
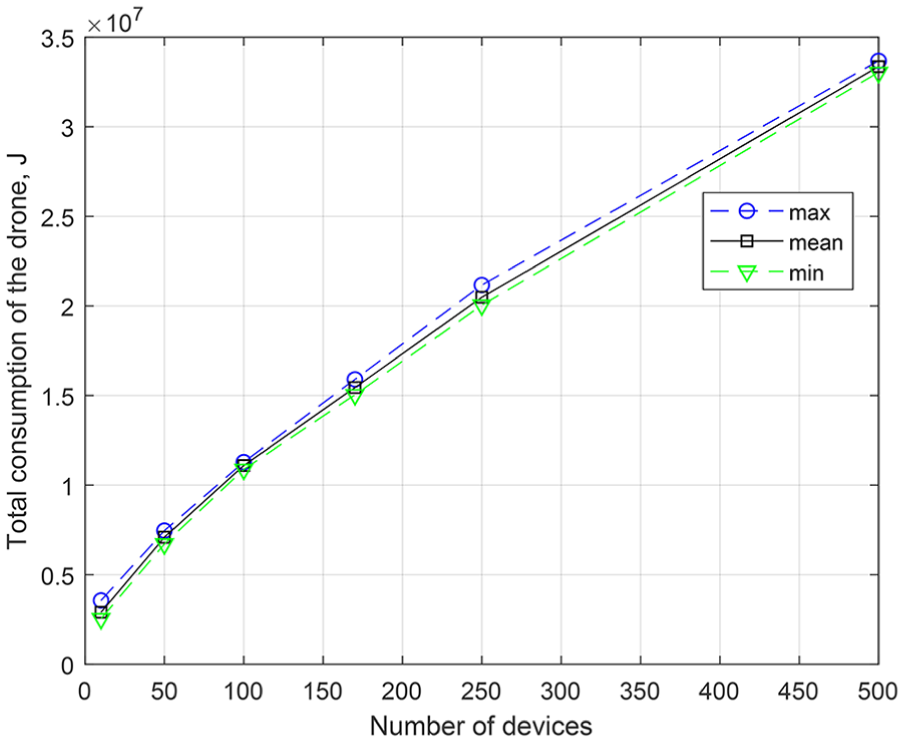
Total energy consumed by the UAV for different numbers of EDs in the network (mean, min, and max over different ED spatial distributions).
The same effect can be seen in Figure 10, which provides an insight into the distribution of the drone’s consumption as a function of the number of EDs in the network. One can see that when the EDs are located sparsely, a greater share of energy is used by the drone for moving between the EDs. With the increase of the ED’s density, the portion of energy spent on charging the EDs goes up.

The ratio of energy spent by the drone for traveling and for charging the EDs for different number of EDs in the network (mean, min, and max over different spatial distributions of EDs).
Operating expenses
Having characterized the key technical performance indicators for the proposed and the baseline scenario, we estimate how efficient the proposed approach is moneywise. The mean operating costs for the baseline and the proposed scenario as a function of the number of EDs in the network are depicted in Figure 11. For the baseline scenario, the expenses are composed of the two components: the power consumption of the LoRaWAN GW and the costs associated with the replacement of the batteries on the nodes. For the target scenario, the total expenses are the sum of the cost of energy used by the LoRaWAN GW and for charging the drone. As one can see from the presented results, the proposed drone-based solution reduces the total network operation costs by 50%–80% for a decently dense network depending on the number of devices in the network. Meanwhile, for a very sparse network, the costs of both approaches are comparable. Furthermore, in Figures 12 and 13, we illustrate the cumulative expenses as a function of time for the two discussed scenarios. For the proposed scenario, the OPEX increases linearly as the energy gets consumed. In the baseline scenario, there is a linearly increasing component associated with the energy consumption of the LoRaWAN GW. Nonetheless, the major contribution to the total OPEX increase brings the service (i.e. the battery replacements) of the EDs. The periodic stepwise increases of the OPEX are due to these service operations. As a result, one can see in Figure 13 that after approximately 18 months after the beginning of the operation, the drone-based system becomes more economically efficient, than the one exploiting manual labor.

Mean yearly costs of the network upkeep for baseline and proposed scenarios.

Cumulative expenses as a function of time for baseline and proposed scenarios (NED = 10).

Cumulative expenses as a function of time for baseline and proposed scenarios (NED = 250).
Discussion
The presented results demonstrate that the proposed in this article concept is feasible and enables to reduce the operating costs for a dense LoRaWAN network substantially. Nonetheless, in what follows, we point out several limitations of our study and speculate further on the obtained results.
First of all, we have to note that in this study we have not considered the capital expenses due to deploying the charging station for the drone, acquiring the drone and equipping the EDs with secondary batteries and WPT receivers. Neither we consider the cost of drone service, replacement, or other costs (e.g., the insurance). Also, we did not consider the aging of the secondary batteries in the drone-served network, which may require them to be also replaced from time to time. These may increase the starting costs for drone-based scenario substantially, making it less attractive.
Second, in this study, we have investigated just a very limited set of scenarios. Specifically, we did not consider how non-uniform distribution (e.g., clustering) of the EDs and the different shapes of the test areas affect the results. The effect of the charging station position was not investigated either. Also, we limited our examination to the case of a single drone and a single LoRaWAN GW only. The different traffic patterns of the EDs and the possible heterogeneity of the network, as well as a possible need for data prioritization, were not considered either.
Third, in our study, we implied that the UAV is used only to charge the EDs. Meanwhile, the drone can also act a mobile sensor itself, collect the data from the sensors or calibrate them, or even deploy, move, or collect the sensors themselves. Also, the level of accessibility (e.g., the minimal distance between an ED and the UAV) for the different sensors in practice may also differ.
Finally, the models used in our study may be further revised to account for the new effects, thus making them more accurate. For example, in this study, we have not considered the acceleration/deacceleration of the UAV, the procedures for ED localization by the UAV, and the energy losses due to misalignment of the WPT coils on UAV and the ED.
For all these reasons, our results represent just the first-order approximation and should be treated accordingly. However, in our opinion, these results show that the proposed in this article concept is potentially viable, and motivates the more detailed evaluation of the proposed system.
Conclusion and further works
The key novelty and contribution of this article is the combination of the three new technologies, namely the LoRaWAN, UAV, and WPT, within a single solution—a WPT-enabled UAV charging the LoRaWAN sensor nodes. By means of network simulations and analytical methods, we characterized both the technical and, notably, the business performance indicators for our proposed scenario and compared it against the baseline scenario with no UAV. Note, that the business performance indicators, such as the operation costs, are rarely considered in the state-of-the-art literature dealing with LPWA, UAV, and WPT. This makes our results especially interesting. Our results showed that for a network composed of the nodes reporting even once a day, the proposed approach enables to reduce the operating expenses by removing the need for manual battery replacement. With the increase of the number of the devices, in a long-term perspective, the cost efficiency of the drone-based solution increases to over 400% for a network composed of 500 nodes. At the very same time, our results show that the state-of-the-art technical limitations for the drone’s battery volume, its energy consumption for hovering and, especially, the limited maximum charging current of the ED’s secondary battery, restrict the number of the EDs served by a single UAV to only a few dozens.
In the future works, we plan to consider the case of several UAVs, including addressing the problem of defining the optimal number of drones serving the network and optimizing their behavior. This can be modeled, for example, as a vehicle routing problem (VRP). 47 Also, we will consider detailing our models further by addressing a more realistic (e.g., the non-uniform) sensor node deployment and accounting for the non-line-of-sight propagation of the radio signals, different ED accessibility, and various data traffic patterns of the EDs. Another important direction of the future works is to introduce into the consideration the realistic effects, such as the WPT performance degradation due to the imperfect alignment of the ED’s and UAV’s coils, to give just one example.
Footnotes
Handling Editor: Peio Lopez Iturri
Declaration of conflicting interests
The author(s) declared no potential conflicts of interest with respect to the research, authorship, and/or publication of this article.
Funding
The author(s) disclosed receipt of the following financial support for the research, authorship, and/or publication of this article: The work is carried out within the framework of the scientific initiative project No. 8.8540.2017/8.9 “Development of data transfer algorithms in IoT systems, taking into account restrictions on the complexity of devices.” This work is also supported by the Academy of Finland 6Genesis Flagship under Grant no. 318927. The work of K.M. was also supported by the mobility project MeMoV, No. CZ.02.2.69/0.0/0.0/16_027/00083710, of Czech Ministry of Education, Youth and Sport, funded by European Social Fund and LPWAN-evolution activity funded by the University of Oulu.