
Abstract
Access points in wireless local area networks are deployed in many indoor environments. Device-free wireless localization systems based on available received signal strength indicators have gained considerable attention recently because they can localize the people using commercial off-the-shelf equipment. Majority of localization algorithms consider two-dimensional models that cause low positioning accuracy. Although three-dimensional localization models are available, they possess high computational and localization errors, given their use of numerous reference points. In this work, we propose a three-dimensional indoor localization system based on a Bayesian graphical model. The proposed model has been tested through experiments based on fingerprinting technique which collects received signal strength indicators from each access point in an offline training phase and then estimates the user location in an online localization phase. Results indicate that the proposed model achieves a high localization accuracy of more than 25% using reference points fewer than that of benchmarked algorithms.
Introduction
Currently, positioning systems are a compelling area of research because they are part of the Internet of things technology. The global positioning system is commonly used in outdoor environments, that is, typically with an unobstructed line of sight (LOS) from a receiver to a satellite. However, it does not function well in indoor environments, given the multipath effect and non-LOS (NLOS) between the transmitter and the receiver. In recent years, indoor positioning issues have received considerable research attention, given the extensive use of wireless local area networks (WLANs) in most indoor environments, such as shopping malls, hospitals and universities. Thus, WLAN-based systems based on time of arrival (TOA) and angle of arrival (AOA) approaches have become extensively used for indoor localization.1,2 However, these types of systems require a directional antenna to measure TOA or AOA. The addition of a directional antenna may increase system complexity.
The well-known RADAR is the first deterministic fingerprinting algorithm based on available signal strength measurements. 3 This system mainly depends on the quality of received signal strength indicators (RSSIs) from access points (APs) which directly affects system accuracy. 4 By contrast, RSSI-based localization systems do not require angle measurements and additional hardware. Several indoor localization technologies require dedicated infrastructures, such as Wi-Fi, ultrasound signal, ZigBee and ultra-wideband. 5 These technologies have high requirements for the environment and require additional equipment, thereby providing them and other proposed systems with a high level of complexity and inferior accuracy. Moreover, these technologies mainly focus on two-dimensional (2D) planes, whereas three-dimensional (3D) environments are more complicated and significantly increase computational complexity. Research on 3D localization systems has become more realistic than 2D localization systems.
This work proposes an off-the-shelf 3D Bayesian graphical model (3D-BGM) based on radio frequency (RF) fingerprinting technique to predict user location with high accuracy and minimal reference points (RPs). The major contributions of this work can be summarized as follows:
Performs long-time analysis of received signal strength (RSS) data to investigate its effect on the localization system;
Proposes the 3D-BGM based on the RF fingerprinting technique;
Validates the analytical results using the 2D Madigan model.
The remainder of this article is structured as follows. Section ‘Related work’ reviews some related works on indoor localization systems. Section ‘Indoor localization system’ introduces the proposed model and describes the system operation. The experimental design and results are discussed in section ‘Experimental setup and results’. Finally, the conclusion drawn from the current work and brief discussion of future work are presented in section ‘Conclusion’.
Related work
In this section, we present common indoor localization algorithms divided into two approaches, namely, deterministic and probabilistic.
Deterministic technique
The deterministic technique mainly depends on metrics between an online phase and an offline radio map phase. This technique benefits from the K-nearest neighbor (KNN) algorithm when determining the nearest value by comparing online measurements and radio map fingerprints using the Euclidean distance matrix. The estimated location can be ascertained in the convex hull of the K-RPs with the least distance. The KNN algorithm is further improved through the weighted KNN algorithm which assigns weights to each RP in the radio map fingerprint. 6 P Jiang et al. 7 focused on a localization technique based on important APs of Wi-Fi fingerprints; the localization technique relies on APs with the strongest RSS. The authors concluded that the proposed technique reduces the range of fingerprint matching and improves accuracy without pre-knowledge of the building structure. However, the Wi-Fi signals suffer due to the LOS link between APs and mobile devices (MDs) and the effectiveness of the multipath signal propagation. 8 In some cases, localization accuracy depends on radio map fingerprints, where a large radio map leads to reduced localization error and significantly increased computational time.9,10 Wang et al. 11 proposed a novel localization scheme based on curve fitting and location search. In their work, an entire area was divided into subareas and fingerprints were created for each subarea. The results demonstrated that the proposed scheme improves localization accuracy by approximately 20% in comparison with other traditional indoor localization algorithms.
In some previous studies, fingerprinting method is implemented on the basis of sparse signal-processing techniques which are considered new-fangled approaches in the deterministic technique. 12 The indicator of the predicted location is considered a vector, where only one or a small subset of indices are non-zero. Therefore, the localization problem can be considered a minimization problem that can be solved by the sparse position vector based on online and offline data. In some recent studies, channel state information (CSI) is used to estimate the location of RSSI, given the high variability of RSS values over time and the multipath effects in indoor environments.13,14 However, CSI-based localization requires the use of modified drivers or software-defined radio platforms. This concept makes the CSI-based localization unsuitable for certain environments which require no additional hardware (off-the-shelf) to the end-user.
In another work, the authors proposed an algorithm based on a trilateration method to estimate the location of MDs (smartphones). 15 The propagation paths, such as LOS or NLOS, should be determined to estimate the location of the MDs. The proposed algorithm obtained reduced localization error by up to 1.2 m using three APs. However, it is suitable for small areas (e.g. a small room) where it works with three APs. Thus, it will have a high localization error for large areas. However, Yang et al. 16 improved the conventional trilateration method by considering the greedy algorithm to utilize all effective APs. Conversely, Tuan D Vy and Yoan Shin 17 also improved the triangulation method for adaptation in large-scale areas, where poor accuracy is probably obtained due to calculation error and path loss propagation. 18
Probabilistic technique
The probabilistic technique depends on the statistical likelihood of RSS data at different locations in the environment. The predicted location can be given by acquiring the conditional probability posterior of the prior probability and likelihood function. However, this technique requires an accurate statistical representation of RSS which increases the computational complexity of the system.
Probability distributions are early contributions to the probabilistic approach used for localization algorithms. 19 It depends on a set of the strongest APs that have a high probability to cover the entire area. Luo et al. 20 applied the Gaussian process–based approach to model the signal distribution of APs and characterize radio map fingerprints in the entire indoor environment. The estimated localization error depended on the fingerprint sampling and error estimation algorithm.
Several sophisticated probabilistic techniques, such as principal component localization, 21 conditional random field 22 and the Bayesian network, have been studied. Madigan et al. 23 introduced a 2D Bayesian system based on the probabilistic approach in which the number of samples is generated from the posterior distribution using Gibbs sampling to predict the users’ location based on the maximum posteriori. However, this system utilizes numerous RPs to reduce localization error. Nascimento et al. 24 proposed a localization system based on the RF fingerprinting technique. This system used Bayes inference to locate a target in 3D indoor environments. Nevertheless, the majority of the proposed systems are computationally expensive, and the numbers of RPs are overly large. Some systems require additional hardware support associated with MDs. Gu et al. 25 introduced a localization scheme with the ability to reduce the measurement effort to construct an offline radio map. The proposed scheme minimized a localization error using only 5% of the collected data. Konstantinos and Richard 26 presented a localization scheme based on domain sampling. In the work, the proposed scheme achieved a low localization error of less than 1 ft by a general-purpose solver.
Indoor localization system
This section introduces the Bayesian model–based probabilistic approach and describes the proposed 3D localization model in detail. Furthermore, it discusses the concept of operation of the localization system.
Proposed 3D localization model
The proposed model is based on the Madigan model that only supports 2D environment where it extended work from our previous works.4,27 The proposed model is called 3D-BGM and is an advanced version of the Madigan model, which is designed to support 3D indoor localization systems. Figure 1 illustrates the proposed indoor localization system based on the 3D-BGM. The proposed system consists of five main nodes, namely, AP coordination (xi, yi and zi), user location (Xj, Yj and Zj), Euclidean distance (Dij), RSS (Sii) and testbed dimension (l, w and h).
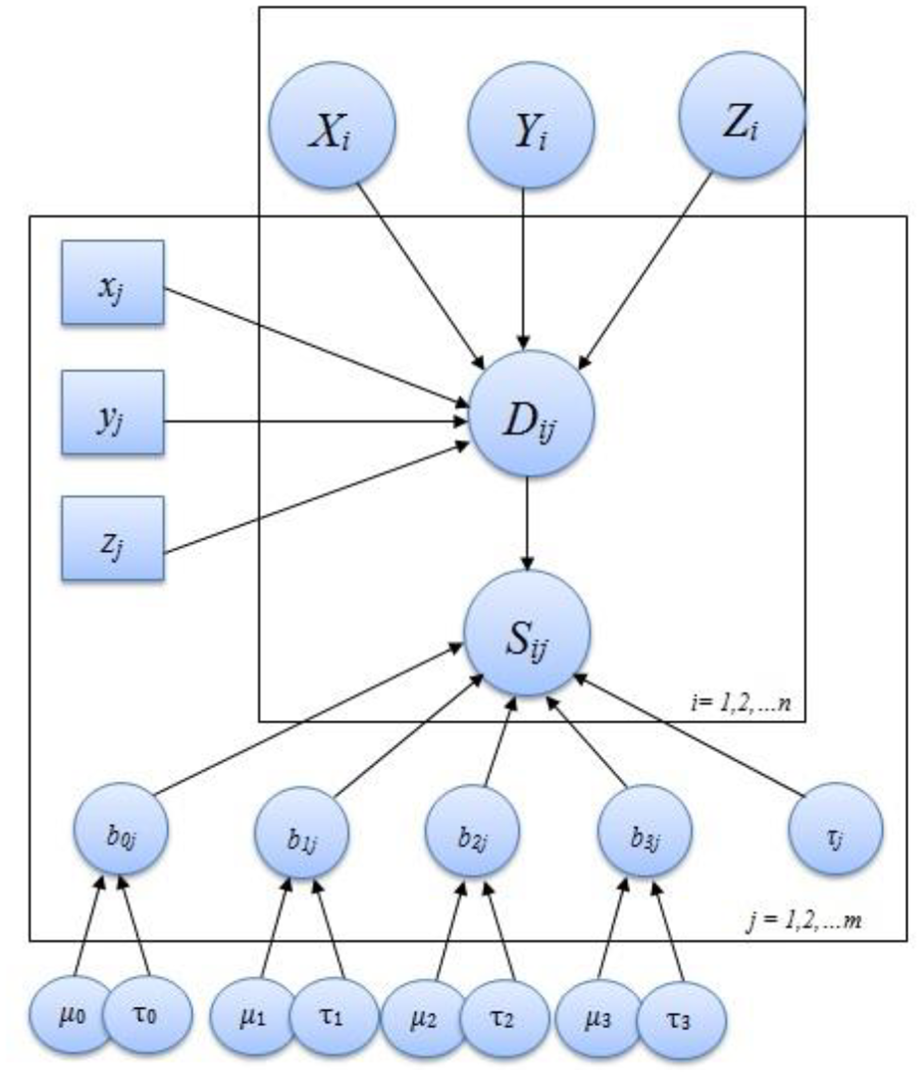
Proposed 3D-BGM.
The proposed model is developed using an OpenBUGS 28 tool that uses a visual tool to create graphical models. OpenBUGS refers to Bayesian inference using the Gibbs sampler. The proposed graphical model consists of four stages of reprehensive nodes, which are defined as follows.
First stage
The user location predicted at any point is bounded by the testbed dimension which is considered a uniform distribution. It is defined as


where l, w and h denote the length, width and height of the testbed dimension, correspondingly, and (Xi, Yi and Zi) represent the user’s location at any point of the ith, which is bound by the testbed dimension (l, w and h).
Second stage
The distance of an unknown location at any point in the testbed can be expressed by the Euclidean distance

where Dij represents the distance between AP coordinates (xj, yj and zj) and users’ location (Xi, Yi and Zi). The value of
Third stage
RSS is defined as a normal distribution that has mean and variance equal to the regression model of independent variables (bi0 and bi1) and (τb0 and τb1), respectively

The RSS is measured at the ith user location and jth AP location. Sij is the normal distribution defined as Sij–N (μ, τ). The regression model is assigned as the mean of the normal distribution of Sij. It consists of four parameters (i.e. b0, b1, b2 and b3) and one independent variable (D i j ).
Fourth stage
The initial parameters are the normal distributions b v j –(μ v ) that carry any arbitrary values used to start the burning-in generating samples only in the initial stage. The parameters are defined as follows

The Bayesian probability interprets the theorem expression which inferences user location (posterior) based on a radio map (prior). The posterior of conditional probability is equal to the product of prior probability and likelihood function

The Gibbs sampling algorithm is used to draw samples from the highly complicated probability based on prior distribution.
29
It draws samples

Fingerprinting localization operations
The proposed 3D-BGM is a device-free localization system that does not require any additional equipment to be used in addition to the available APs and MDs. Figure 2 displays the process of the RF fingerprinting technique which consists of two phases described as follows.

Fingerprinting process.
Offline phase
This phase is also called the data collection phase and is responsible for collecting samples of RSSI fingerprints (known as RPs) using an MD that supports Wi-Fi technology. The user stands with a device at the location of interest within the testbed and collects RSSI samples from all available APs at time


where
Online phase
This phase is responsible for receiving samples of RSS from available APs and comparing the current RSS samples with collected data in the radio map constructed during the offline phase to estimate the unknown location. The MD receives Θ online RSS observations, which contain the current RSS from each

The system accuracy measures the overall performance of the proposed algorithm or models for location prediction which depends on the calculated localization error
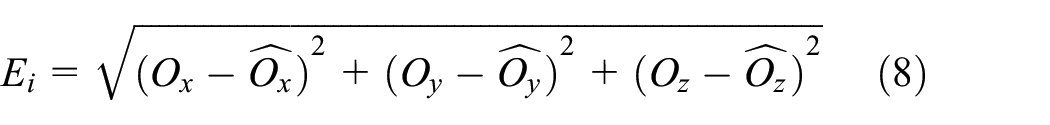
where

where q denotes the number of training points used to test the proposed model. Algorithm 1 demonstrates the steps for estimating the user location based on the proposed 3D-BGM.

Experimental setup and results
Experimental design
To test the performance of the proposed 3D-BGM, we conducted an experiment in an indoor environment with a dimension of 50 × 22 m 2 . Four APs were used to collect the RSS fingerprints along the corridor which contained 50 RPs from each AP, as exhibited in Figure 3. The black dots represent the RPs along the corridor. Tables 1 and 2 summarize the specifications of the testbed, APs and MDs. Wi-Fi scanner software was used to scan the available APs and collect data, such as RP coordinates, media access control (MAC) address, service set identifier (SSID), channel, RSS and timestamp for each selected AP. In this work, 30 samples (1-s intervals) were collected in a 360 degree rotation for each RP and each AP along the corridor. Two experiments were performed with time durations at the same place using the same APs and MDs. The gap between these experiments was 3 years to study the effect of RSS properties and their impact on system accuracy over a long period. The data collection process for different time durations can be found in a previous paper. 30
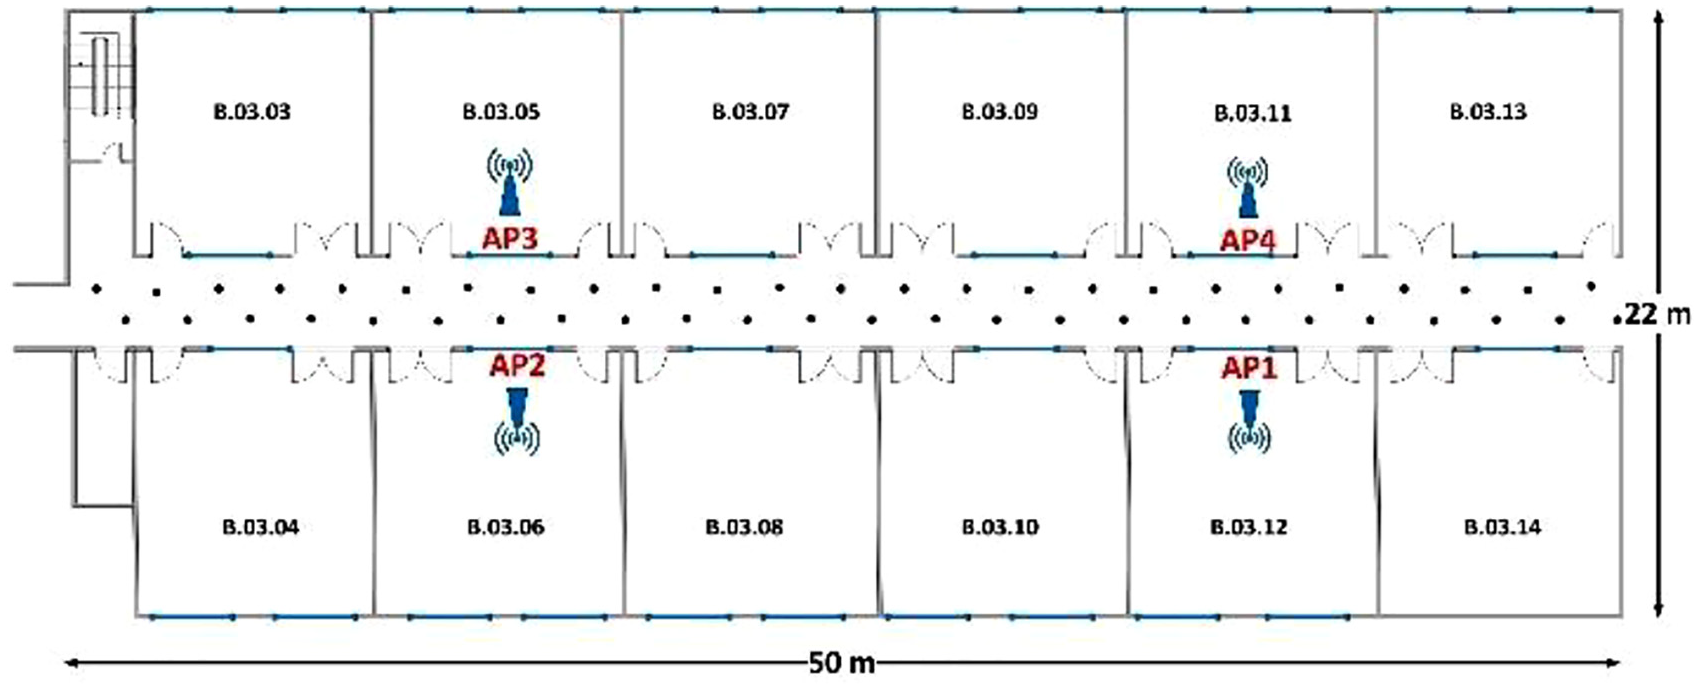
Experimental testbed.
Testbed specification.

AP: access point.
Specifications of used MD and APs.

MD: mobile device; APs: access points; WLAN: wireless local area network.
Performance evaluation
Impact of the RSS across times
To study this effect, an experiment was conducted to collect the RSS data along the corridor during different timeframes with a gap of 3 years. The datasets were conducted at the same place with the same number of APs using the same MD. Figure 4(a) and (b) demonstrates the average value of RSS for 50 RPs in the first and second datasets, respectively. The high and low values of RSS were obtained when the location of the MD was close to and far from the APs, respectively, for both datasets. All RSS reading from both datasets obtained the same average value in the middle of the corridor (intersection area at 26 m). This result was because the MD was the midpoint between all APs in the testbed. In addition, RPs possess a unique set of RSS which makes the predictions of unknown locations using fingerprint-based localization techniques the best choices. In our previous work, 30 an investigative study was conducted by introducing three types of RSS data that might influence the location prediction for each training point. The study concluded that changes in environment structure must be considered to predict an unknown location with high accuracy.

Average RSS with respect to APs for different time durations. (a) First and (b) second RSS readings.
Figure 5 illustrates the impact of RSS reading during a long gap period. The deviation in the RSS reading was due to the multipath effect and attenuation caused by changes in the testbed structure and the movements of people. These factors led to fluctuating signal strengths at different time durations. AP2 recorded the highest value standard deviation among the APs.

Effect of RSS reading during a long gap period.
RSS distribution
RSS distribution does not constantly have Gaussian or asymmetric properties due to changes in signal levels over time. 31 However, the distribution of RSS is defined as a non-Gaussian distribution, considering the frequently different RSS means and modes. 32 The distribution of RSS is further defined as a normal or Gaussian distribution when a similarity exists in RSS mean and median readings. 33 Thus, the distribution of RSS is difficult to model and fit to a particular distribution due to the complexity of the radio propagation of indoor environments. To investigate the RSS distribution in the testbed, RSS measurements were collected from AP1 for 10 min (one sample per second), with a distance of 8 m between the AP and the MD. The collected data were divided into three time intervals (i.e. 2, 5 and 10 min) to study the effect of each part separately. Figure 6 plots the histogram of the RSS distribution for the three time intervals. We observed that RSS behaves similar to a normal distribution in the second and third time intervals due to the similarity of the RSS mean and median. However, the RSS was a non-Gaussian distribution when the first time interval was compared with the second or third time intervals considering the different means and medians. Overall, the RSS distribution in this particular test was defined as non-Gaussian and asymmetric.
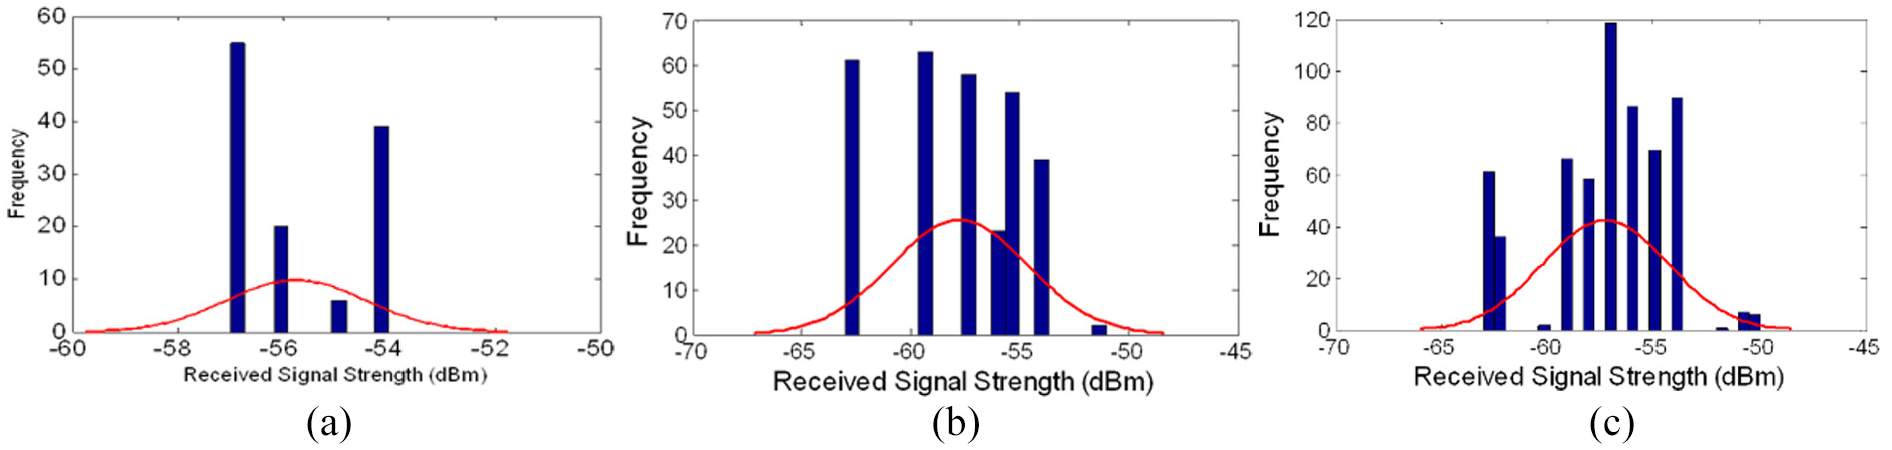
Histogram of the RSS distribution at different time intervals: (a) 2 min, (b) 5 min and (c) 10 min.
RSS stationary
The stationary test used to investigate the mean and variance of RSS does not change over different time intervals. To conduct this type of RSS property test, the collected data were divided into two parts, where each part contained 300 samples (one sample per second) of RSS. The stationary decision of RSS was based on two conditions that RSS must satisfy. The first condition is that the mean and variance of the RSS must remain the same over time. The second condition is that its autocorrelation function should have the same shape during the time interval. Figure 7 demonstrates the method for determining that the RSS has consistent mean and inconsistent variance values for each part of the time interval. Therefore, the RSS process was considered non-stationary in this case due to the failure of the first condition of the stationary test. Figure 8(a) and (b) displays the same shapes of the autocorrelation function for each part. The similarity in shapes indicates that the second condition of the stationary test was satisfied. In summary, the RSS random process is non-stationary due to failure of the first condition, although it satisfied the second condition.

Collected RSS over time (10 min).

Autocorrelation function of two time intervals. (a) First and (b) second parts.
User’s body effect
The RSS is affected by the presence of user body due to the multipath phenomena in indoor environments. The effect of user’s body must be investigated and considered before designing an indoor localization system. Typically, the user carries the MD for collecting data in a particular area. An experiment was conducted to study the significant effect of this parameter on system accuracy. Samples of RSS were collected from AP1 for 5 min with an 8-m distance from AP1 in two phases (user presence and no user presence). Figure 9 exhibits the effect of the user’s body on RSS. The result showed that the existence of the user slightly reduces the RSS mean by −2.77 dBm, whereas its standard deviation evidently increased from 4.45 to 6.03. The human body is considered an additional source of inaccuracy that can cause unpredictable fluctuations in RSS. That is, the human body is an effective absorber of 2.4 GHz of WLAN radio signal because it is composed of 70% water that causes degradation in RF performance. 34

Effects of user presence and no user presence on the indoor environment.
Inferencing user location
The proposed 3D-BGM was evaluated using OpenBUGS to estimate any point of user location. Table 3 provides the values of the parameters for location inference used for this work. The burn-in samples refer to the practice of discarding the initially generated samples to eliminate their effect on the posterior inference. To illustrate the generation of samples, the fourth RP (X = 24, Y = 9 and Z = 1) in the radio map was taken as an example to show the inference process. Figure 10 presents a trace of random variables for X[4], Y[4] and Z[4]. The two random variables reach a convergence level which signifies that increased numbers of iterations have no significant effects.
Parameters for inference setting.


Iteration history of generating samples to estimate the unknown location at the (a) X and (b) Y coordinates.
The samples were generated using the Gibbs sampler for variables X[4] and Y[4], as depicted in Figure 11. These samples were obtained by running a Markov chain for 100,000 iterations. The execution time required to obtain these iterations was 62 s. Figure 12 illustrates the autocorrelation of the generated samples for random variables X[4] and Y[4].

Generated samples using the Gibbs sampler for X[4] and Y[4].
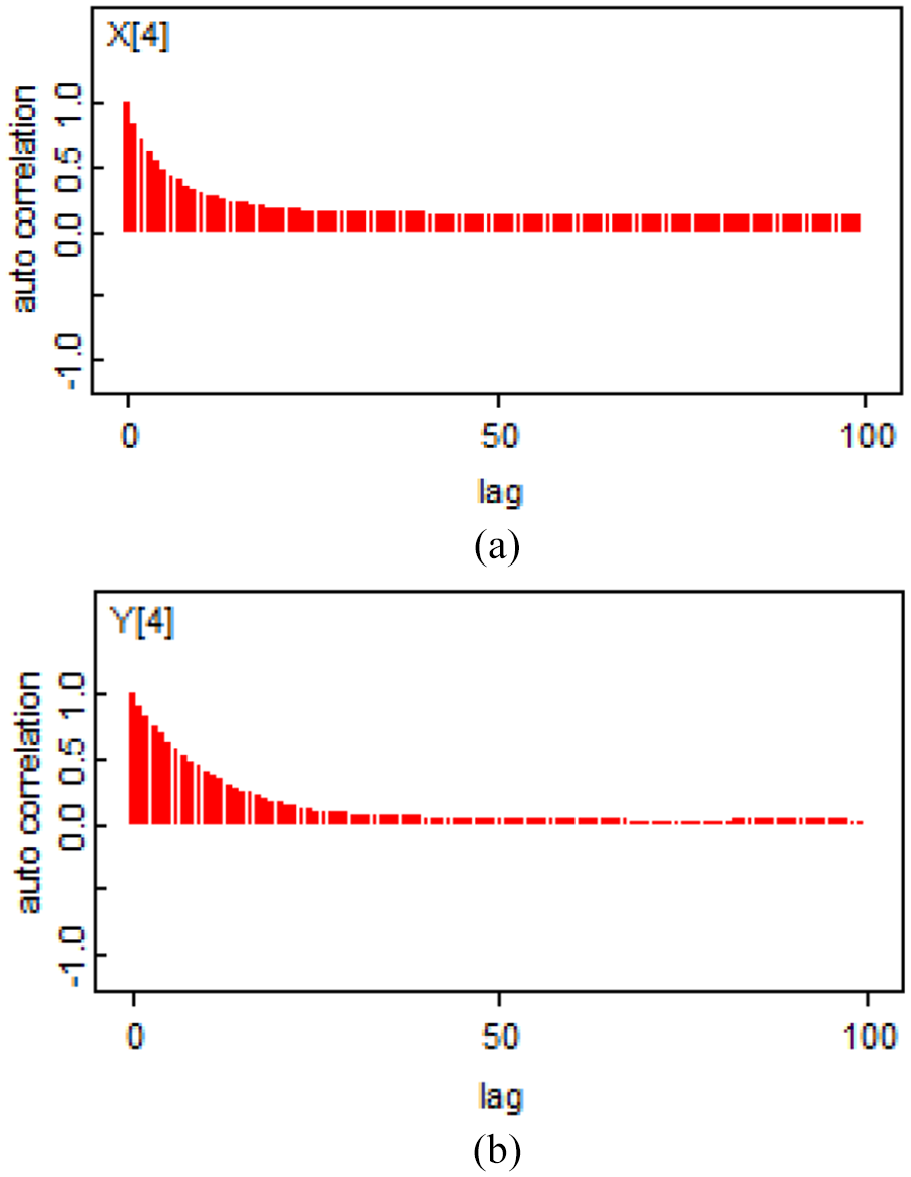
Autocorrelation function of the generated samples at the (a) X and (b) Y coordinates.
Impact of the number of iterations
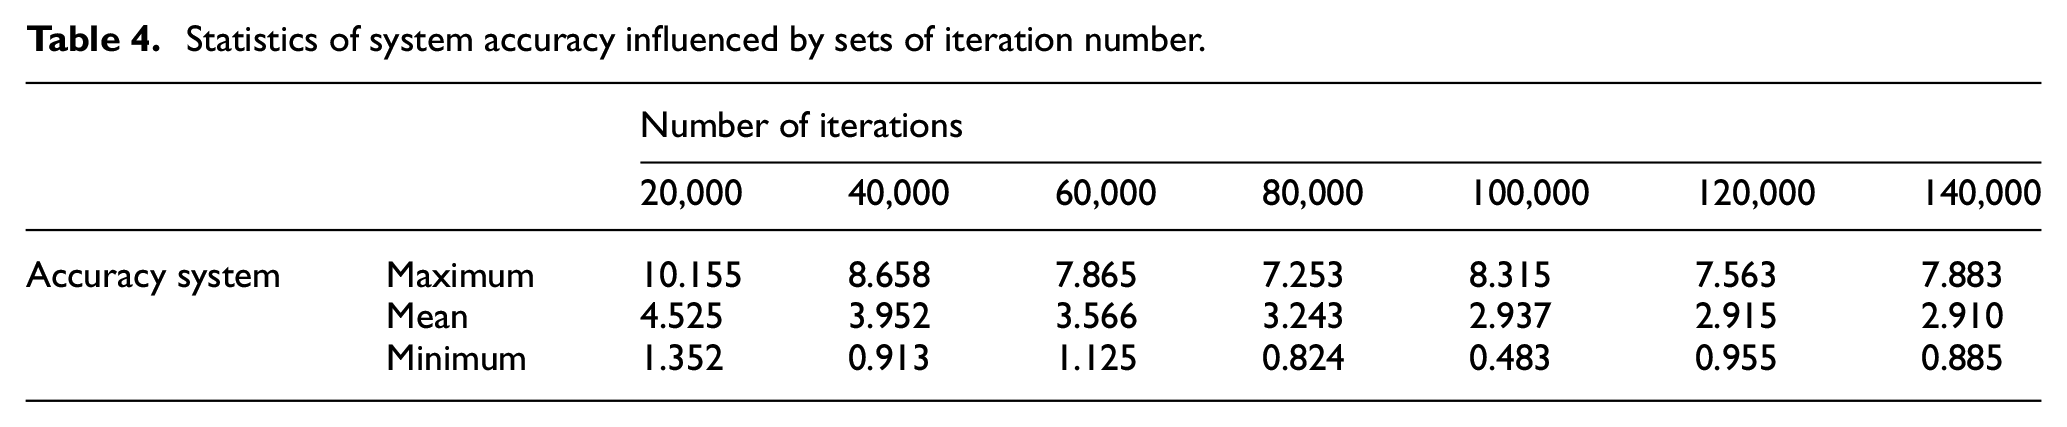
The number of iterations is an important factor in the positioning accuracy of our proposed model. An increase in the number of iterations leads to an increased probability of the system to estimate the correct user location. However, numerous iterations increase the computational time abruptly. Table 4 displays seven sets of the number of iterations investigated to study their effect on the accuracy of the proposed model. Figure 13 displays the average of the distance error which gradually decreased during the first five sets of iterations (20,000–100,000 iterations). However, no significant improvement was noted for the last three sets of iterations (100,000–140,000 iterations). Conversely, the model reached a convergence level at 100,000 iterations with an average distance error of 2.9 m. Thus, the optimum choice of the number of iterations for the proposed model is 100,000 because no improvement was observed when the number of iterations increased.
Statistics of system accuracy influenced by sets of iteration number.
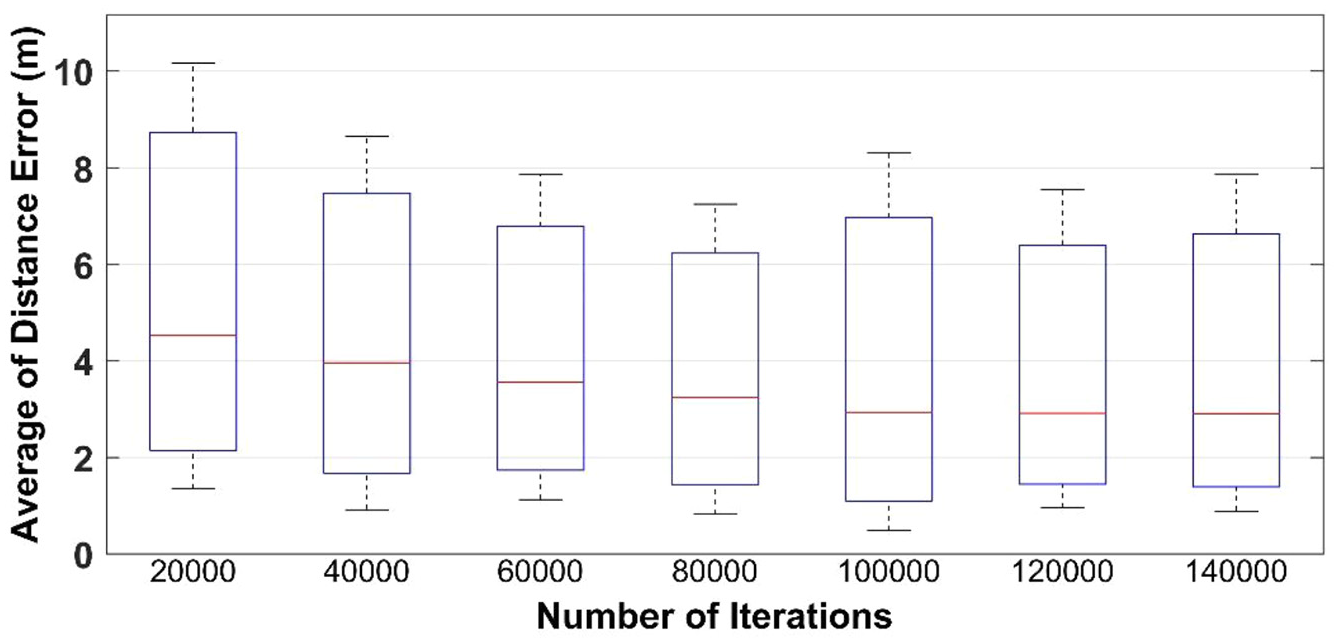
Effect of iteration number on the average distance error.
Figure 14 demonstrates the effect of the number of training points used to test the proposed 3D-BGM and the Madigan model using the first and second RSS datasets. Four sets of training points (set1 = 6, set2 = 9, set3 = 12 and set4 = 15) were investigated using both RSS datasets for each model. The localization system achieves high accuracy when the training points are increased for both models. Furthermore, the proposed 3D-BGM and the Madigan model that uses the second RSS dataset reduced the average distance error in comparison with that of the first dataset. However, the proposed model outperformed the Madigan model for all datasets.

Effect of the number of training points on distance error.
Figure 15 exhibits the rate of localization error for different types of datasets using the 2D Madigan model and the proposed 3D-BGM. Clearly, the 3D-BGM outperformed the Madigan model for the first and second datasets. The overall average localization accuracies for the proposed 3D-BGM and the Madigan model were 2.9 and 3.8 m, correspondingly. Moreover, the 3D-BGM achieved high accuracy using only four APs with a small number of RPs in comparison with the Madigan model.
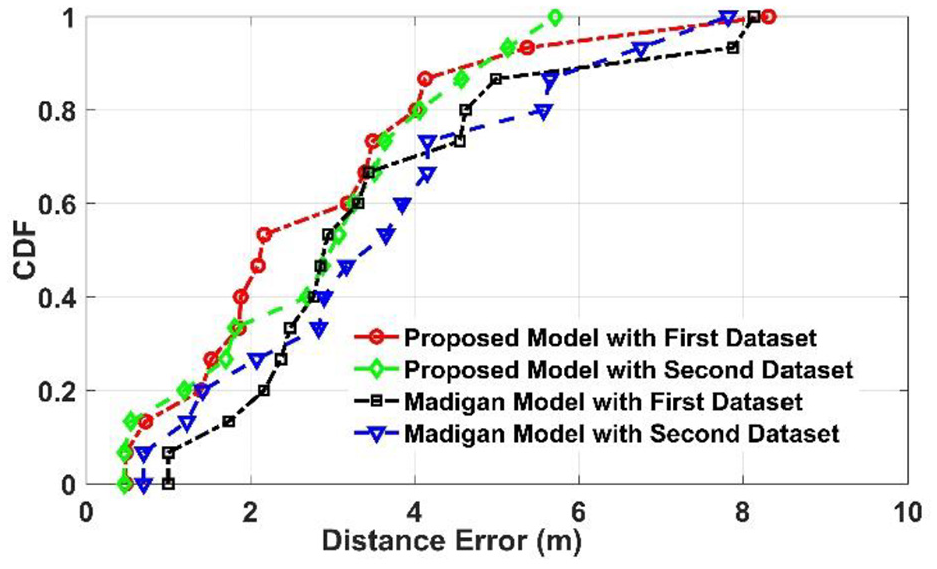
Comparison between the 3D-BGM and the Madigan model.
The proposed 3D-BGM was compared with different localization algorithms, such as Hyeon et al.’s 15 model and KNN using new data, in addition to the Madigan model. The Hyeon model is based on a trilateration method that used three APs to estimate the user location in a small area. In this comparison, the same testbed dimension, number of training points and number of APs were used (except for the Hyeon model, where only three NLOS APs were used) for all algorithms. Figure 16 depicts the comparison between different localization algorithms using various sets of training points (i.e. set1 = 6, set2 = 9, set3 = 12 and set4 = 15). The same specifications of the testbed were used for all testing sets and compared models. The results demonstrate that the proposed 3D-BGM achieves a significant reduction of localization error in comparison with other algorithms for all different sets. The KNN algorithm obtained the lowest average localization accuracy for all tested sets because larger testing points fail to match highly similar locations. The Madigan and Hyeon models recorded better localization accuracies at (using 15 training points) 3.8 and 7.6 m, respectively, than the KNN algorithm. The proposed 3D-BGM achieves an average system accuracy of 2.9 m higher than that with the Madigan, KNN and Hyeon algorithms. In particular, the proposed model improved system accuracy by 25%, 73% and 62% in comparison with the Madigan, KNN and Hyeon algorithms, correspondingly.

Comparison between different localization models.
Conclusion
This work presented the design, analysis and evaluation of 3D-BGM for indoor localization systems. The 3D-BGM based on the RF fingerprinting technique used available APs already deployed in the environment to estimate user location without additional external devices. The proposed 3D-BGM achieved an overall localization error of 2.9 m using only four APs with a few RPs. This model provided accuracies that are higher by 25%, 62% and 73% than those of the Madigan, KNN and Hyeon algorithms, respectively. In the future, the 3D-BGM will be further enhanced by considering a multi-story building rather than a single-floor unit. This condition will be implemented by adding a new parameter to the proposed 3D-BGM called the ‘floor attenuation factor’, where the RSS attenuates few dBs because it penetrates each floor.
Footnotes
Handling Editor: Yanjiao Chen
Declaration of conflicting interests
The author(s) declared no potential conflicts of interest with respect to the research, authorship, and/or publication of this article.
Funding
The author(s) received no financial support for the research, authorship, and/or publication of this article.