
Abstract
In this research, an Internet of things–based smart factory was established for a die-casting company that produces automobile parts, and the effect of casting parameters on quality was analyzed using data collected from the system. Most of the die-casting industry in Korea consists of small- and medium-sized enterprises with inferior finances and skeptical views about the establishment of a smart factory. In response, the Korean government is providing various types of support to spread the implementation of smart factories for small- and medium-sized enterprises. Although small- and medium-sized enterprises have become more active in establishing smart factories according to the government policies, the effect of smart factories requires real-time monitoring. A monitoring system has been built but the data collected are not being utilized properly. Therefore, it is necessary to establish a system suitable for the die-casting environment and data analysis purposes and to utilize it to enable the analysis of data. To this end, we established to smart factory that provides data based on the Internet of things. Among the data collected, casting parameter data were analyzed through a data mining technique to establish a relationship between casting parameters and the quality of production. It is expected that a method of systematic implementation will be provided to die-casting companies that want to build smart factories in the future and that a plan for managing casting parameter by-product will be established. In addition, algorithms that can solve the problem of multi-collinearity among the casting parameters and aid in the development of new products are needed to detect optimum casting parameters.
Introduction
The manufacturing industry has provided the foundation for the continuous growth and innovation of the Korean economy. It strengthens the status of the nation and expands its portion of exports through its flagship and traditional industries. The impact of manufacturing on the domestic (Korean) economy (31%) is the highest among the major developed countries, such as the United States (13%), Japan (19%), and Germany (23%). However, manufacturing-based industries are inefficient structures with low total factory productivity compared with their high share in the national economy.
To cope with the next-generation manufacturing industry and to remain competitive, the process technology that forms the basis of the manufacturing industry is important. The process technology determines the quality and performance of the final product. Root industries, such as casting, molding, welding, and plastic processing, form the basis of manufacturing competitiveness. Thus, root industries are indispensable for realizing the technology necessary for the production of future mainstream products, such as environmentally friendly cars, semiconductors, organic light-emitting diodes (OLEDs), robots, biotechnology, and aviation, and for preempting the market. However, the international competitiveness of Korean manufacturing has recently been on a downward trend, and the percentage of process innovation is almost the lowest, about one-fifth that of the major European countries, making process innovation through the introduction of smart factories more necessary than ever.
In response, the Korean government has set a quantitative target of 20,000 smart factories (about 26.3% of the nation’s factories) by 2022, and is conducting nation-wide projects to achieve this goal. Therefore, we have introduced a smart die-casting (precision casting) operation to “ABC” company.
Die-casting is one of the processes included in the precision casting field. Most of the Korean precision casting industry consists of small- and medium-sized enterprises (SMEs), and precision casting has not been a national strength. Only a few leading companies produce most of the precision-cast parts in Korea, and they account for about half of the exported products. The manufacturing and development of magnesium alloy die-cast parts have been applied or are being applied to automobile parts, such as steering wheel cores, seat frames, cylinder housings, transmission housings, and brake pedal brackets. The magnesium alloy die-cast research is actively underway. In addition, in Japan, magnesium alloys are applied to cases for electronic parts, including notebooks, mobile phones, digital cameras, and LCD cases. 1
In Korea, SME die-casting companies are experiencing an accelerating reduction in the labor force and the aging of skilled workers (Figure 1). Technologies are required for quantitatively managing the manufacturing environment from the viewpoint of globalization, urbanization, changes in demographic structure, and energy type. In addition, the obtained data need to be applied to the mass production site in real time.

Status of die-casting industry in Korea.
Developed countries are promoting manufacturing revival policies using information and communication technologies (ICTs). In particular, the Internet of things (IoT)-based real-time production data acquisition and acquisition/analysis software are being developed and applied to the storage/analysis of vast amounts of data generated in continuous production environments, and they are being applied to quality, production, and facility operations.
Therefore, there is a need in the field for a smart die-casting system that can provide early confirmation of abnormalities in the machines/equipment that will result in a production/quality problem for an SME die-casting factory with a poor working environment. 2
In this study, a smart die-casting system (manufacturing execution system (MES)) was built in “ABC” company, which specializes in aluminum die-casting for the production of automobile parts. The system took advantage of a national smart factory dissemination project in 2016, in line with a national smart factory supply policy and the need for a smart die-casting system. We built an MES to overcome faults using the Andon system, quick monitoring of abnormalities, quality control, web monitoring (including equipment IoT), and quality control. The system was built to carry out the necessary production management, facility monitoring, quality control, raw material management, and mold management. Data analysis was performed for one of the quality control items, and the relationship between the defect details collected in quality control and the casting parameters collected by IoT was derived. Several previous studies have shown that casting parameters have an effect on quality. However, in the manufacturing field, products are produced depending on experience, in spite of this important relationship between casting parameters and quality. To consider various conditions, a system for production management was constructed, and the casting parameters (data) for 1 unit (comprising total 60 units) collected 1 year after construction of a smart factory system (1 September 2017–30 September 2018) were analyzed for quality and relevance.
Background and related work
Die-casting
Die-casting consists of melting, casting, post-treatment, and shipment. The casting process consists of one cycle, from mold cleaning to casting, and it takes about 4–120 s, depending on the casting size. Therefore, it has high productivity, able to produce 30–1000 castings per machine per hour; the casting time depends on the mold clamping force. Because die-casting is a high-productivity process, it has the highest price competitiveness in mass production parts. However, the conventional die-casting method has disadvantages, such as the lack of pressure resistance due to excessive internal gas content, surface defects due to the breakage layer, decreases in strength and airtightness due to internal shrinkage, and difficulty in undercut processing. 1
The die-casting process involves the use of a furnace, metal, die-casting machine, and die. The metal, typically a non-ferrous alloy such as aluminum or zinc, is melted in the furnace and then injected into the dies using the die-casting machine. 3
The Al die-casting process is an economical casting method that not only manufactures complex parts with excellent dimensional accuracy and castability but also has high productivity. It is used in various fields, such as automobile-related parts, electric parts, and general machinery. 4
In this study, we established smart factory for an aluminum alloy die-casting company.
Die-casting quality
The quality of a die-cast product is determined by a combination of several factors. In particular, it depends largely on the characteristics of the alloy materials, the casting parameters, and the design conditions of the molds and parts. Generally, a die-cast product is designed considering the thickness of parts, charging time, local overheating conditions, and surface conditions. Therefore, to minimize casting defects and manufacture high-quality die-cast products, the operating conditions of the equipment must be optimized, and the size and location of the gate speed, runner, overflow, and vents must be properly considered when designing molds. 5 Among these, the mechanical properties of die-cast aluminum alloys are generally more affected by casting methods or casting conditions than by the alloys used. 6
The die-casting process is controlled by several parameters. When properly determined and adjusted, they improve the quality of the die-cast parts. Usually, the main controlled variables are mold temperature, dosage volume, slow and fast shots, commutation spots, injection pressure, set up pressure, chemical composition, and liquid metal temperature. 7
According to Taguchi 8 , the parameters that exert a great deal of influence on the die-casting process can be adjusted so that some settings can result in robustness of the manufacturing process.
Therefore, in this study, data were obtained by focusing on the casting parameters of die-cast products, and a smart factory system was established to collect data from various production environments. In particular, casting conditions for die-cast products were established by applying IoT to collect data from die-casting facilities.
Type and frequency of die-casting failure
When examining the types of defects and the rate of occurrence of defects in die-cast products, approximately 11 types (shrinkage cavity, metal flow, insufficient filling, cold shut, bulging, flashing, oxide and segregation, soldering, blowhole, porosity, and chill layer) are found. In general die-casting, porosity and insufficient filling each accounts for 35% of the total defects.9,10 Table 1 shows the types of defects that can occur in die-casting.
Defect type of die-casting.

Causes of casting failure
Syrcos (2003) constructed a cause-and-effect diagram to identify the casting process parameters that may affect the die-casting density. The process parameters comprise four categories: die-casting machine-related parameters, shot sleeve–related parameters, die-related parameters, and cast metal–related parameters. Figure 2 depicts the following casting process parameters: plunger velocity during the first stage, plunger velocity during the second stage, fast shot set point, die cavity filling time, multiplied pressure during the third stage, shot sleeve dimensions and filling level, type and quantity of die lubricant, size and shape of the gate, die venting system design, temperature of the cast metal, and composition of the cast metal. 11
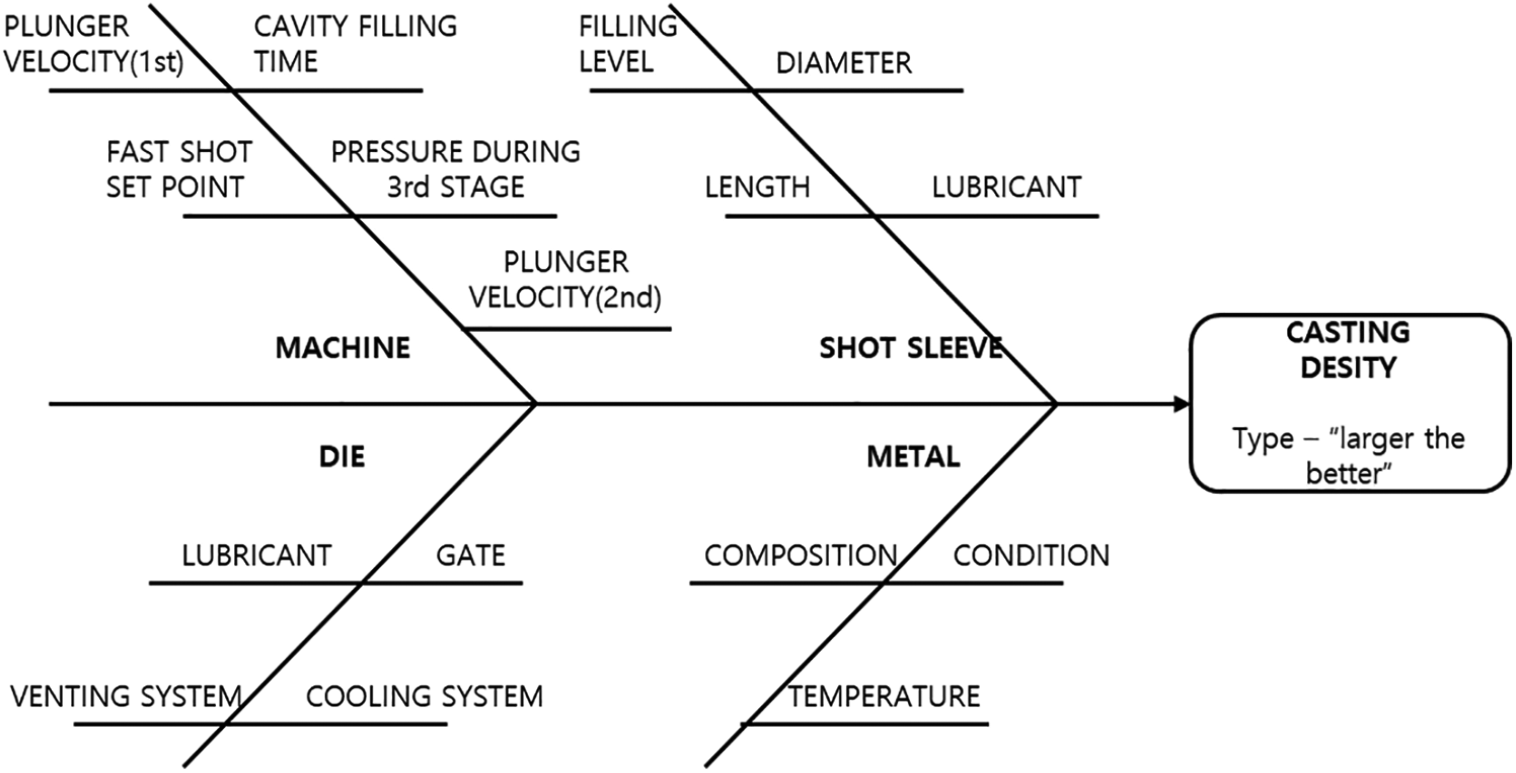
Cause-and-effect diagram of the die-casting process.
Among the above, the most significant parameters are piston velocity, metal temperature, filling time, and hydraulic pressure.
There are several major defects in the casting process, depending on where they originate and what type they are. Generally, gas porosity and shrinkage can be distinguished according to the generating tool. Figures 3 and 4 show the causes of gas bubbles and retractors in the process conditions. These are defects related to porosity, and they appear to be the result of the temperature of the high-speed section, the metal pressure, the cycle, the increase in pressure, the rise pressure, the rise pressure time, and inadequate melting temperature. Porosity is a defect caused by the reaction of internal components during the process of filling the melt. Shrinkage is basically related to the flow phenomena of the melt.

Causes of air porosity.

Causes of shrinkage porosity.
Because it is practically impossible to accurately interpret the flow phenomena of the melt during the solidification process, it is estimated by treating them as a simplified shrinkage defect prediction model using thermal parameters. Therefore, to predict pore and shrinkage defects in product production, analysis of the die-casting process (computer aided design [CAD] modeling, preprocess, meshing, parameter setting, post-process analysis, method determination) should be performed. The die-casting process analysis utilizes commercial software (computer aided manufacturing [CAE] simulation analysis).12,13
In 2015, Oh 14 analyzed the die-casting process for making covers for automobile parts. The causes of casting failures were analyzed. On examining the factors causing casting failures, it can be seen that bubbles can be generated by the pressure rate when setting up the equipment. Air bubbles occur when air is contained in a molten liquid as it enters the mold and changes into a solid. Therefore, the rate at which the air bubbles are injected and the pressure are the greatest factors for the occurrence of bubbles.
Figure 5 is a cause-and-effect diagram for defect casting in the production of automotive part covers. The main causes of defective castings are degassing, high-speed injection positioning, casting pressure, spraying, and inspection. Degassing results in defects from bubbles generated in the product. To minimize the bubbles, periodic degassing is performed by controlling the temperature of the melting furnace and the warming furnace. High-speed injection positioning causes unformed products, and casting pressure causes not only molding defects but also contraction. Pressure regulation is an important manufacturing factor in die-casting, and it is particularly important when using high pressure.
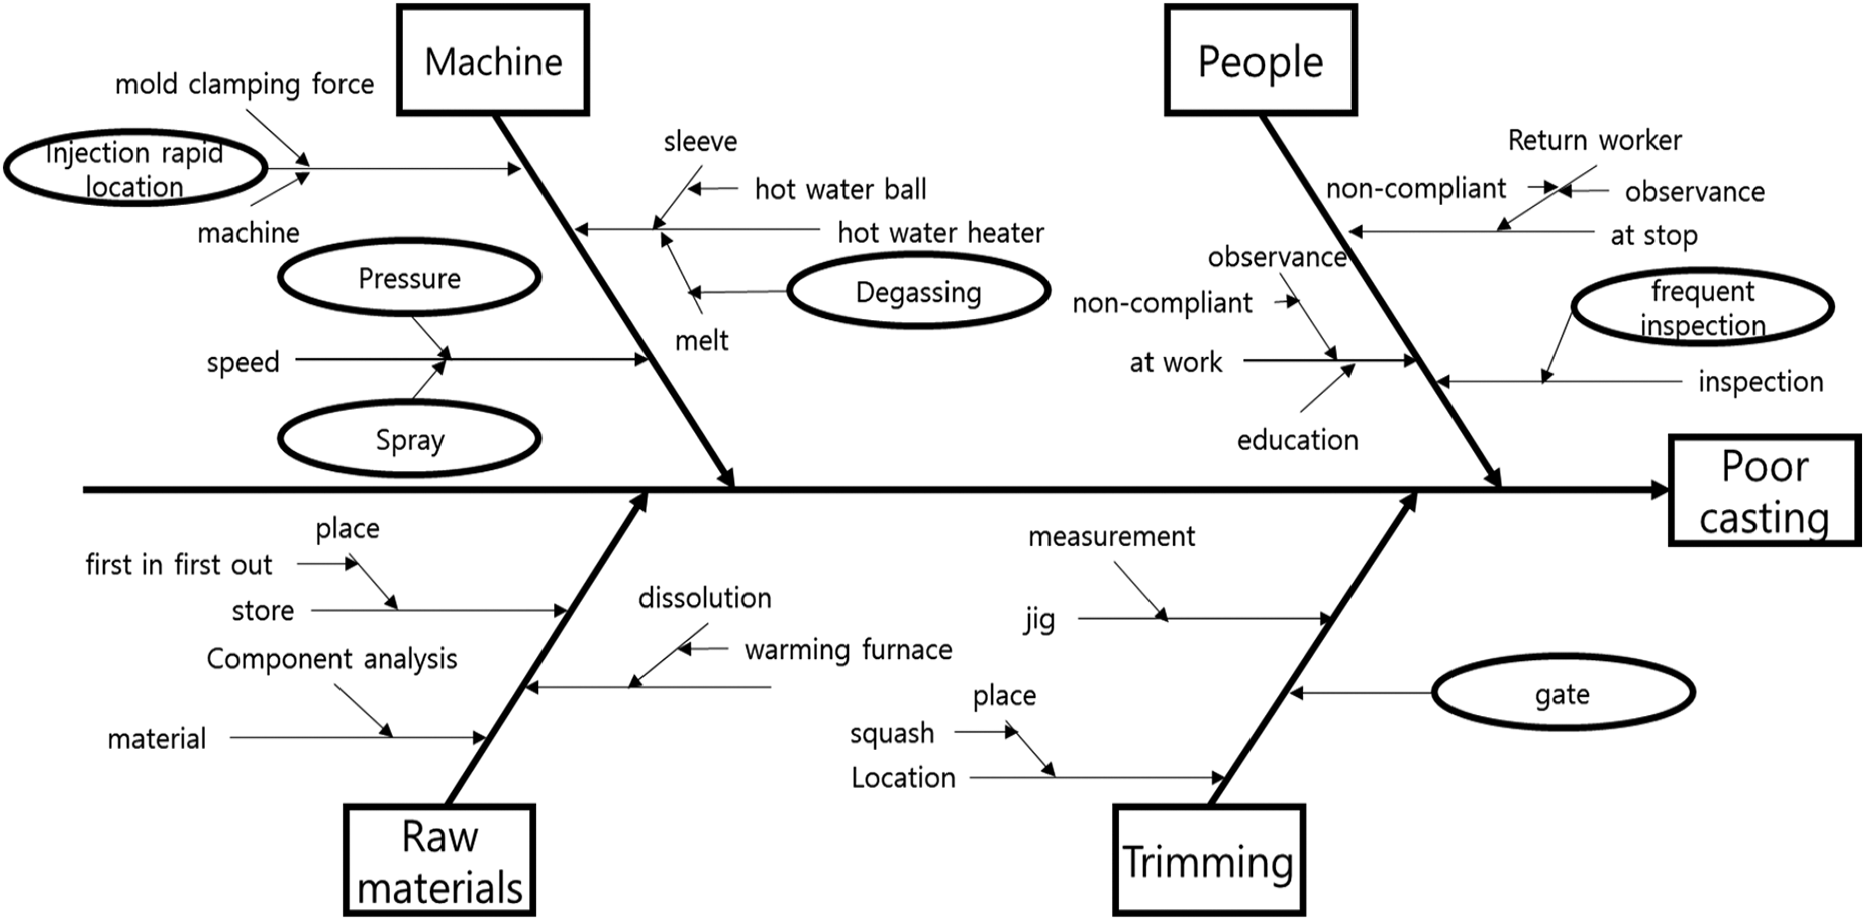
Auto parts cover product casting defect characteristic factors.
The casting pressure can be largely divided into three types, as shown in Table 2. If high-speed casting pressure is used, the largest increase in the amount of production in the manufacturing industry could be obtained. However, the key technology of die-casting is to secure the maximum production quantity within the range where defects do not occur. Because die-casting does not produce good-quality products at low speed, it is necessary to determine the molding characteristics of the product and to set the optimum casting pressure for the product, while simultaneously producing a casting, regardless of the casting speed.
Influence of casting pressure on product.

Spraying results in the seizure failure of the product. If the temperature of the mold is too low, the high-temperature raw material adheres to the surface of the mold, which affects product formation.
Inspection work is required to discover dimensional defects by checking the dimensions of the product. It should be done by standardizing the correct work instructions given to the inspector. 15
Aluminum die-casting processes are characterized by mass production within a short period of time. The utilization rate of production equipment and the management of casting conditions for a product have a significant impact on yield and quality. To increase production, it is necessary to manage the whole production site in real time, including equipment failure, and to minimize the product defect rate by managing the casting conditions for the product produced by each die-casting machine. However, until now, the problem of die failure of aluminum die-casting and management of casting conditions has been managed by a small number of experienced people in an unstructured manner; therefore, a systematic management system based on data is needed. 16
In die-casting, casting conditions are important factors in determining the quality of castings. However, systematic studies of these factors are inadequate in Korea. 17 To optimize casting conditions, simulation software was used to set casting conditions. However, there is a limit to determining whether the conditions derived from this simulation are suitable for the future or the actual situation. In addition, casting conditions that are different according to the product are not managed differently; the standards are established with similar casting conditions, but they are used to produce different products. Therefore, diversification analysis should be performed, and it is necessary to analyze the collected data through smart plant construction using the IoT to reflect the optimal casting conditions in each product in real time. Casting conditions and parameters in die-casting are crucial factors that determine the quality of the casting and are presented in several studies. In addition, the process of filling and solidifying the melting through casting analysis is carried out, which greatly helps to derive the optimum casting conditions and to predict the quality.
However, the simulation of casting analysis is limited to simulations predicting quality for products designed through CAD. In addition, expertise using CAD, casting simulations, and casting analysis is required, which is not readily available onsite. The purpose of this study is to establish a system to collect data on casting conditions and casting parameters set during actual production directly from the facility and to establish a relationship with quality based on that data. We propose a method for analysis using actual data. It is expected that this actual data will work with the simulation of the casting analysis to provide a basis for further use as more reliable data.
Application of ICT technology in Korea and overseas manufacturing industry
The manufacturing environment of domestic SME die-casting companies in Korea is poor, and the quantitative management level is extremely poor. To overcome this problem, attempts have been made to collect data from the existing programmable logic computer (PLC)-based operation control devices and to use that data to manage the mass production site. Figure 6 represents the process in which ICT is currently being applied to the die-casting site. To collect data from heat-intensive die-casting production lines, the mold temperature and number of castings produced are collected using PLC, and then, the data are compiled into a database (DB). In addition, data that cannot be collected through the PLC are entered and written by the producers and made into a DB.

ICT application process.
Germany has adopted an end-to-end strategy that maintains market leadership by strengthening its manufacturing competitiveness through changes in its production paradigm. This, in turn, leads to securing high value-added products. Innovations are applied to the field.
The United States operates the American Manufacturing Partnership (AMP), a national consortium for the development of manufacturing. Hundreds of millions of dollars in R&D investment have been spent through scientific and technical organizations, such as the National Institute of Science and Technology (NIST).
Meusburger, in Austria, introduced MES to analyze the causes of injection molding machine problems through real-time machine data acquisition and data analysis to increase the efficiency of production by increasing the utilization of equipment. 18
Figure 7 represents a series of processes for building and analyzing big data at the production site. Data for 4M (man, machine, material, method) are collected using a smart device (IoT), and each data point is then converted into a DB. Most MES/POPs are built up to this point, but analysis and utilization of the collected data is rarely seen for SMEs in Korea. Therefore, this study not only collects but also performs data analysis to provide a big data enterprise procedure to local die-casting companies.

Manufacturing big data collection/analysis procedures.
Internet of things
The IoT is an intelligent technology or service that communicates with people and objects through the Internet. 19 In particular, Atzori et al. 20 study shows that the IoT extends people and things to the Internet; it is a means of connecting all information in real and virtual worlds.
The IoT has recently re-emerged as the concept of machine-to-machine (M2M) and the ubiquitous sensor network (USN), which have been used before. The basis for this interest is to increase the speed of wired and wireless networks and the spread of smart devices. A variety of applications are being developed as the environment is created to receive services whenever, wherever, and whatever is required. It is expected that as the technology develops in the future, the Internet will be expanded to propagate all types of Internet technology in everyday life. Overseas, several companies have already applied the Internet and various sensors for climate change and public safety. Several studies have been conducted on the wireless sensor network (WSN) and wireless personal area network (WPAN) with connectivity technology for objects and sensors. These technologies enable a large number of small sensors and devices to form networks and interact with the environment. 21 To apply this IoT technology to the manufacturing site, we built a smart factory using Arduino, which is an open-source application that requires an embedded system.
Arduino
Hardware configuration
Arduino is a development platform equipped with a microcontroller that is capable of program operation. It has a variety of features that allow it to be used by beginner-level users, as well as by developers who want to build specialized knowledge and complex functionality. It also provides broad scalability. Because of the nature of the platform and wide variety of applications available, Arduino is actively applied in creative and convergent educational activities. 22 There are various types of Arduino, such as Uno, Leonardo, Mega, Nano, Fio, Pro, and Lilypad. Figure 8 shows Arduino Uno, the most commonly used platform.
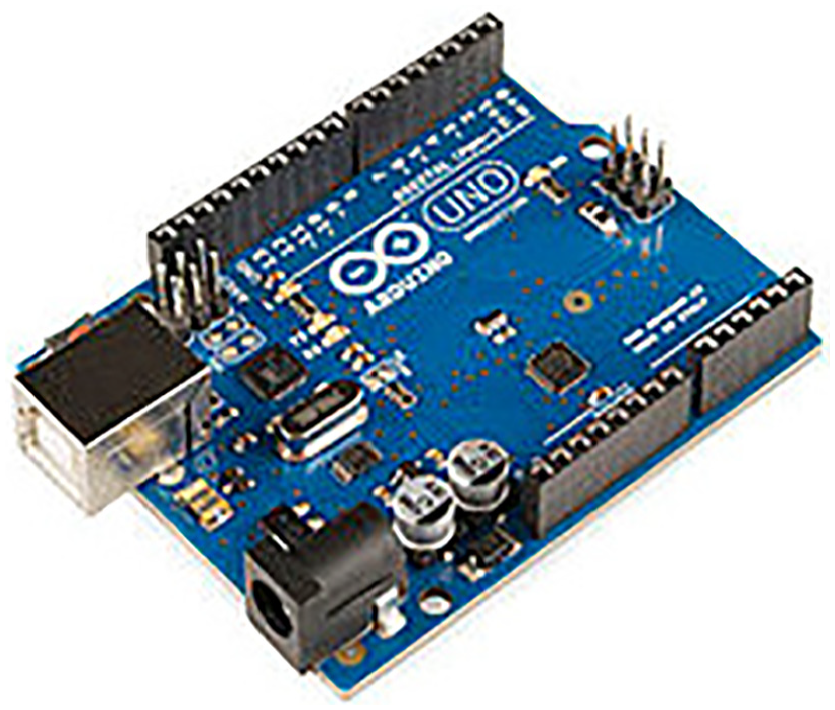
Arduino Uno.
Software configuration
Arduino is an open-source–based platform that provides an integrated development environment (IDE) for software development. The IDE is a special program that can compile the source code created on a computer without any additional equipment, and it can upload it to the Arduino hardware. Development systems that can code the program and transfer the source code to the Arduino board are IDE, Scratch for Arduino (S4A), and Processing. 15
The programming language used in Arduino is similar to the C, which is one of the most widely used computer languages. The language is flexible and scalable, so that programmers can easily access it. It is easy to download from the official site of Arduino. The IDE also makes it easier to identify the user’s code by providing text highlighting and coloring for error-prone parts of the code. This feature reduces the chance of typos or syntax errors. 23
Figure 9 shows a schematic of the IDE window (sketch window) for coding the source code and the process of uploading the program to the Arduino compiler. The process of programming by a human through a PC, compiling/debugging, and uploading to and from an Arduino is performed.

Arduino programming procedure.
Arduino application structure analysis
The Arduino application does not have a main () function like a regular C program; instead, it contains setup () loop () functions. The setup () function is executed once the program is running, and then, it iteratively executes the loop () function. Basic functions include device interface functions; such as digital input/output, analog input/output, and time; mathematics; bit operations; trigonometric functions; and interrupts. The Arduino development reference site 24 divides functions into 13 groups according to function and role, as shown in Table 3.
Arduino data I/O function list.
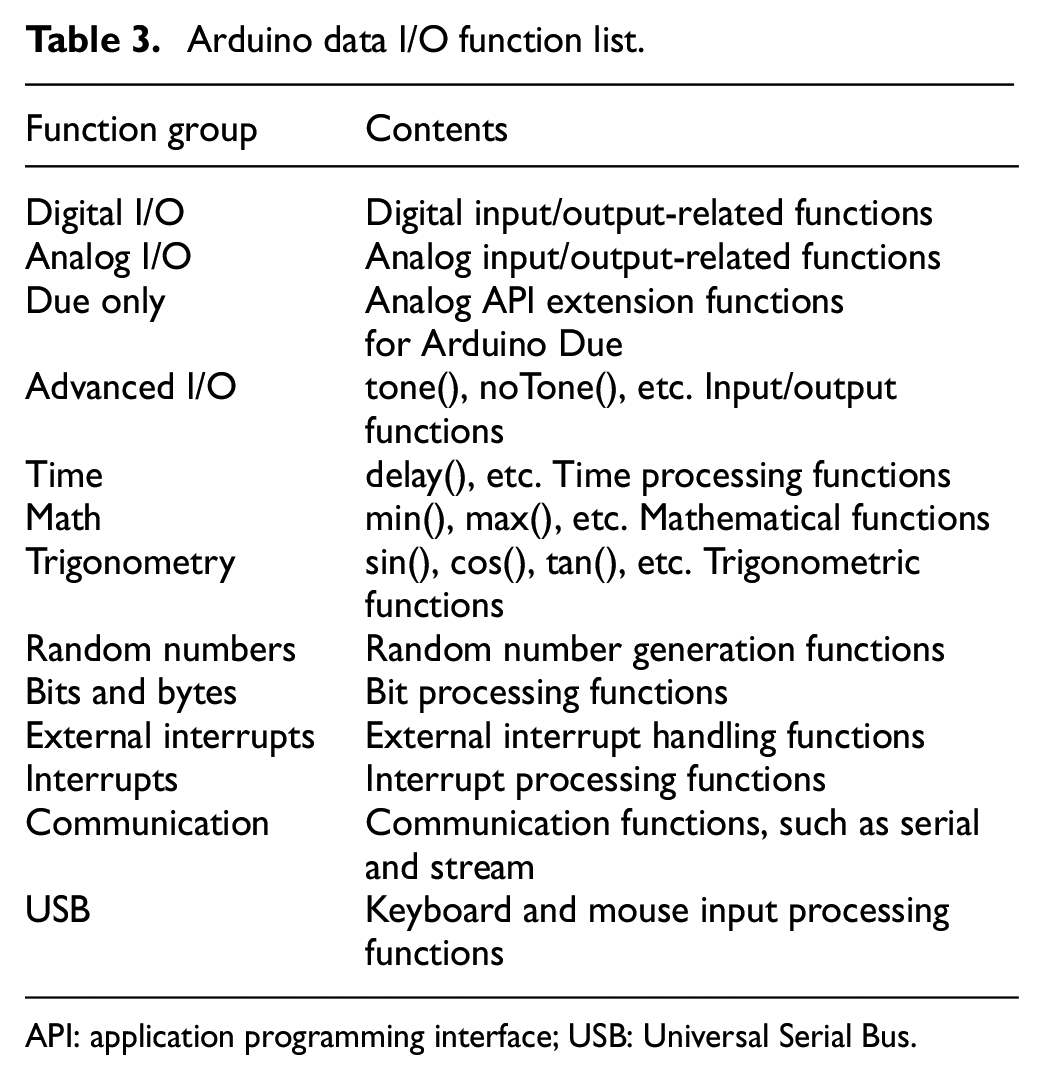
API: application programming interface; USB: Universal Serial Bus.
Most of the functions for data input/output and communication were used by our program. Arduino has a built-in analog-to-digital converter (ADC) to convert analog voltage values to digital values that can be used in the program. The analog signal collected from the die-casting facility was converted to digital value using the analogRead () function, and it was used for the casting conditions.
“ABC” company smart factory construction contents
As a specialist in the field of aluminum die-casting, “ABC” company manufactures automobile parts such as engines and emission parts, smart remote actuator (SRA) and pump parts, exhaust gas recirculation (EGR) parts, housing and steering parts, bracket and supercharger parts, engine control unit (ECU) housing and generator motor parts, and meter valve body parts. The production process is composed of casting (raw materials, dissolving, die-casting, trimming), post-processing, processing/washing, and inspecting/packaging processes. In 2016, “ABC” company introduced the smart factory (MES).
Smart factory system (MES) architecture
“ABC” company systematically managed the production process information of the die-casting plant, and it implemented the MES system to enable quick decision-making through real-time performance and quality monitoring. The MES system was constructed to allow the collection and management of defective/unavailability information, casting condition information, performance information, quality information, and on-site environment (temperature/humidity) information.
The data (casting condition, temperature, cycle time, etc.) collected from the die-casting machines (60 units) were confirmed on the monitoring PC (PC). The input data were stored in the DB of the MES server, which interacted with the file server and the web server. It was configured to send the analyzed content to the web server. Figure 10 shows the system architecture and process.

System architecture.
The MES server was installed in the field office. A 7-inch touch panel was installed in the die-casting facility, where the reasons for the non-operation of the equipment and the failure factors were input. In addition, a temperature indicator and a data acquisition device (Arduino Digital Input/Output) were installed in the melting furnace and the warming furnace, and a wireless access point/wired network was established in the field to transfer the collected data to the server. The collected data were stored on the MES server, which was provided to the client in the form of a web service through the web server.
The functions provided to the client consisted largely of production performance management, facility monitoring, and quality control. Figure 11 shows a schematic of this content. The production management functions can be checked by the manager against what the operator is actually producing and against the production plan. Facility monitoring can confirm the die-casting parameters and the number of units being produced. Quality control can check the quality situation registered by quality inspectors.

Function-based system architecture.
IoT data collection diagram
The IoT data collection diagram shows the application of IoT to collect data from die-casting machines in the system architecture. The collection structure through IoT is shown in Figure 12. A touch screen is installed in the die-casting facility to link it with the die-casting PLC, thus enabling producers to check the production conditions of the die-casting facilities. Data from the die-casting PLC are passed to the central network via a wireless network and then to the MES server in conjunction with the Master PLC, which aggregates the collected data. The information obtained from the die-casting equipment is largely divided into the condition of the equipment, the casting conditions (parameters), and the melting/hot-rolling furnace. The condition of the equipment is either “operation,”“instant stop,” or “during preheating,” and the casting conditions are shot number, low speed, high speed, high-speed switching position, high-speed section, biscuit thickness, casting pressure, spray, cycle time, mold force, and so on. The melting/hot-water furnace also collects data, such as the temperature of the molten metal, the temperature of the hot water, and the amount of dissolved gas used.

Die-casting facility data (IoT) collection diagram.
The collected data are transmitted to the Master PLC by connecting the network to the Arduino board and the LAN. The data of the Master PLC are transmitted to the MES server via the network. The types of data collected are shown in Table 4.
Casting monitoring signal acquisition item.
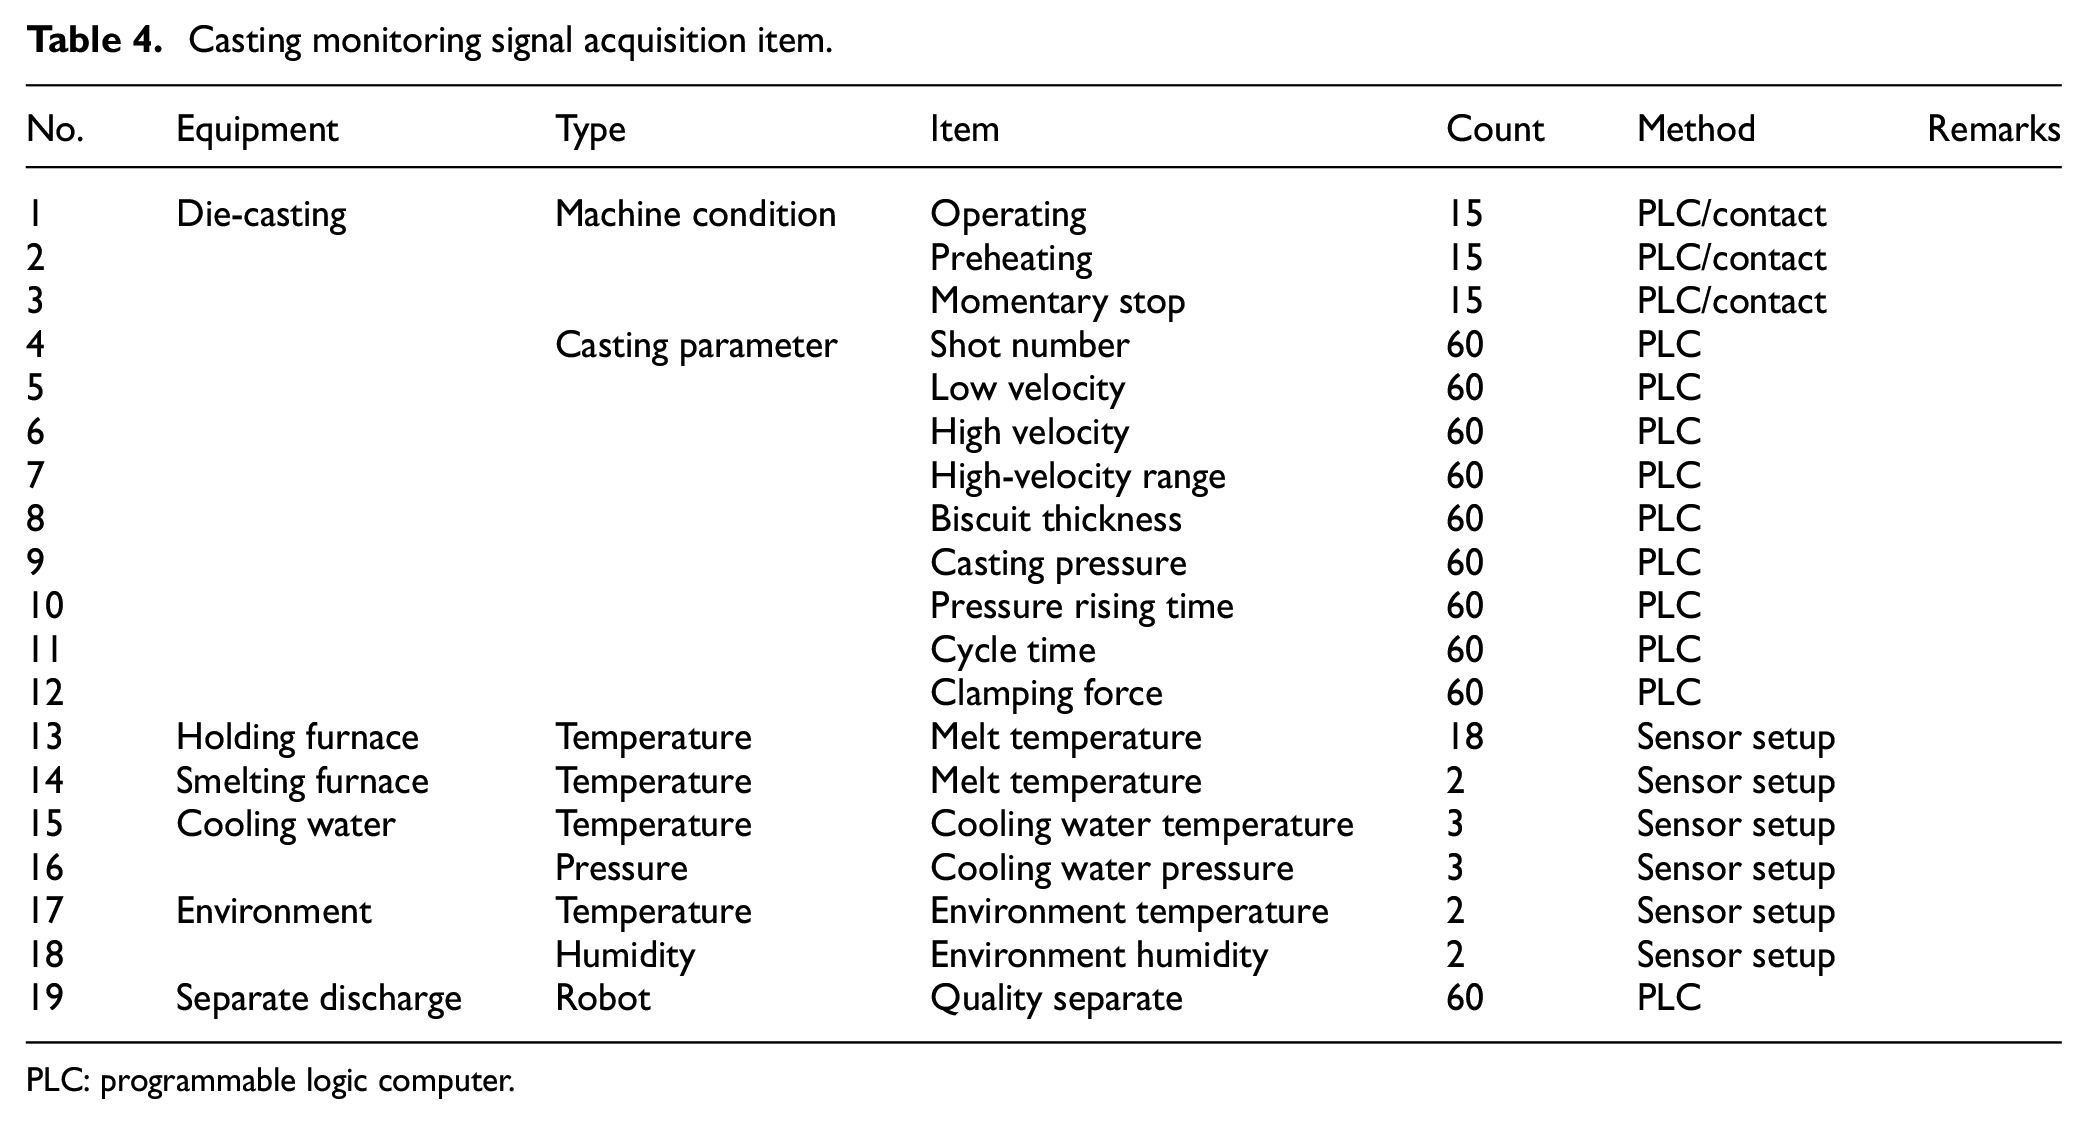
PLC: programmable logic computer.
In this study, data collection was carried out on 18 items in MES. The study focused on casting parameters that were directly related to die-casting quality. In addition, the influence of the casting conditions and quality was determined from the data (separate discharge) automatically separated by the robot when the casting condition setting was wrong.
Big data analysis of the relationship between casting parameters and quality
The 60 die-casting machines of “ABC” company were 350, 35, and 800 tons. Of these, casting condition analysis was performed at the 350-ton facility. Make-to-order (MTO) production was in operation, and the main product was manufactured with almost no planned outage. From 1 September 2017 to 30 September 2018, the smart factory (MES) was randomly sampled, and 1-year data were extracted and analyzed. The amount of data from the one facility per year was for 321,875 parts, which had seven data items each. This study analyzed 96% of the total number of automobile engine parts that had the largest amount of data. Thus, there were 309,896 pieces of data, of which 276,477 were for good parts (about 89%) and 33,419 for bad parts (about 11%).
The casting condition data analysis was performed using R programming (R 3.4.2, R Studio 1.1.383), which is widely used in big data analysis. Variables defined for data analysis were low velocity = L_velocity, high velocity = H_velocity, biscuit thickness = B_thickness, casting pressure = pressure, pressure rise time = Pressure_R.T, mold force = Mold_force, whether there was a fault = Fault, and lever state = Lever.
The analysis was divided into four stages: selecting target, IoT data collection/management, casting parameter analysis, and model assessment. The steps are shown in Figure 13 and described below.
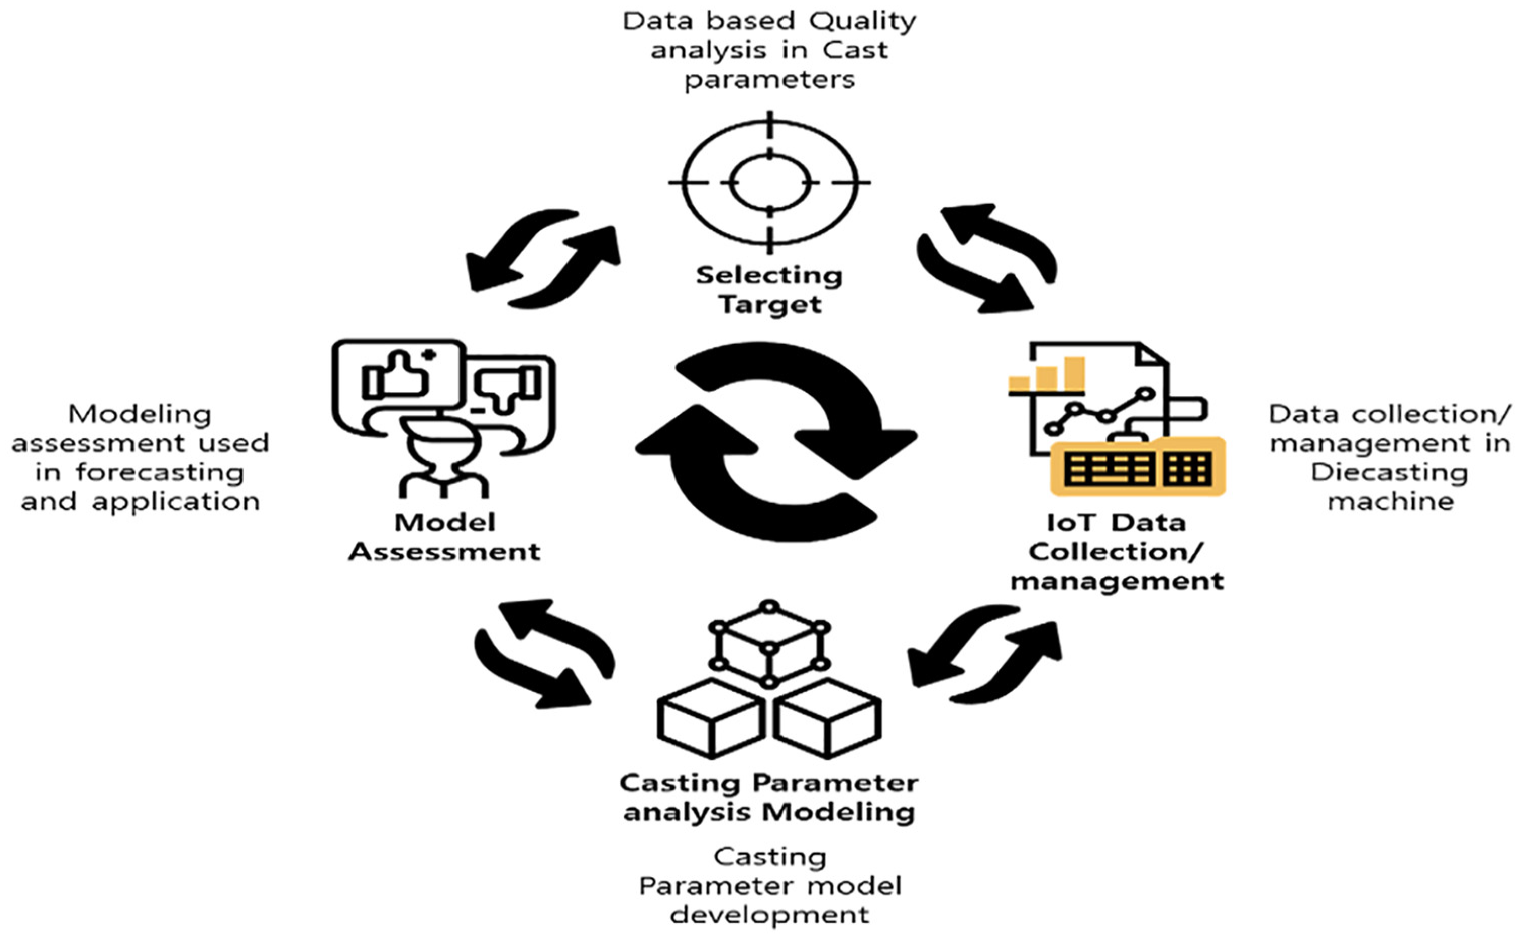
Overall data analysis overview.
Selecting target
In this study, we set goals that could be analyzed based on the data collected by the IoT, not the data entered by the operator.
We tried to identify the relationship between the data that could be collected by the IoT, namely, the casting parameters, and the data collected from the existing robotic arm (separate discharge). The robot automatically separated the cast products that had casting parameters set incorrectly. The IoT was used to collect the MES data from the robot using the existing automation device. In addition, only one product produced by one facility was analyzed. After 2–3 years of data collection, the data-driven casting parameters must be extended and the relationships determined separately for each product.
This study was based on the analysis of the influence of parameters and quality based on the big data collected by the IoT, unlike previous studies of die-casting which have used numerous chemical and physical methods.
IoT data collection management
Collecting and managing the data is the most important and time-consuming process. This step does the processing for collection and analysis to determine what data are available, evaluates whether there are enough data, helps solve any problems, and determines what the data quality is. Data cleansing (preprocessing) was performed by using data visualization for the initial search of the data.
Figure 14 shows the distribution of the casting parameter IoT data collected during the first year after the smart factory was constructed. Data cleansing was performed on extreme values and outliers. The data that were indicated as a preliminary number (24,598 pieces) were deleted to derive the conditions that affect good casting conditions and quality. Data were centered on cleansing.
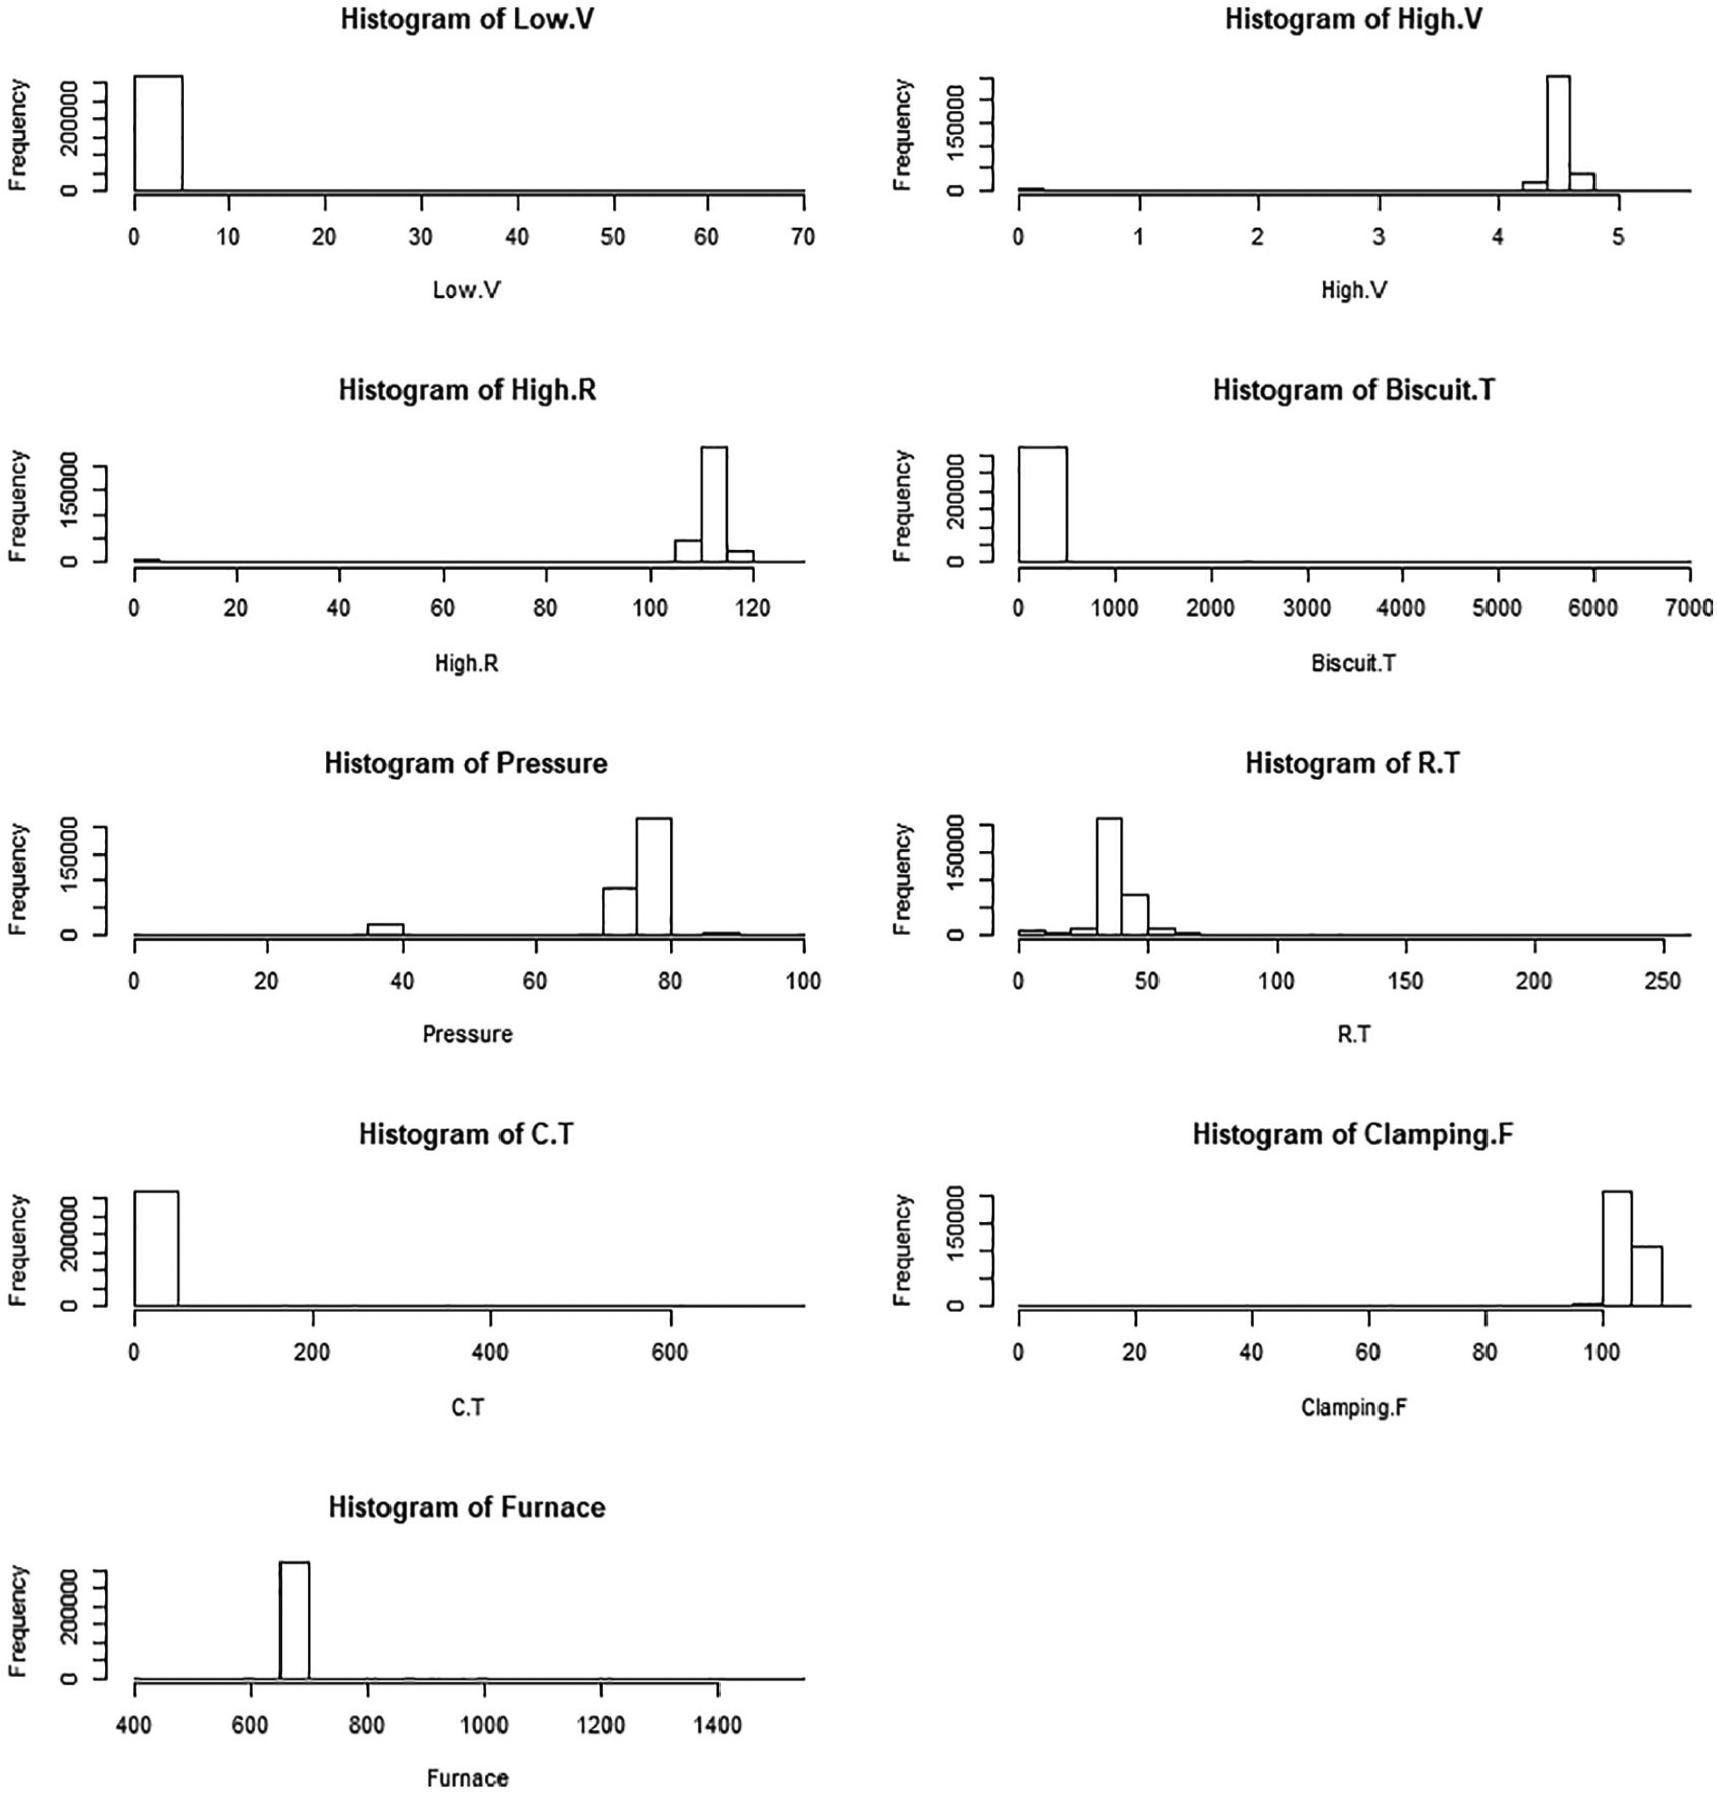
Cast parameter IoT data histogram before data cleansing.
Casting parameter analysis modeling
Useful insights were extracted from the data to reach the goal. The best way to present the data was found, as well as how to fit the model in the best viable way.
When a new casting condition is assigned to a pattern found through casting parameter data, a technique that precisely classifies the new casting condition is used. Supervised machine learning is often used in this classification analysis. Supervised machine learning includes logistic regression, decision trees, random forests, support vector machines, and neural networks. 25 In this study, we analyzed the relationship between casting parameters and quality and use logistic regression analysis, decision tree, and the k-nearest method to establish a model that can distinguish between good and bad when different casting conditions are input.
Linear regression analysis was performed to analyze the causal relationship between the independent variables, the casting parameter data, and the dependent variable quality (good 0, fault 1). The dependent variable quality was classified as either a good product or a fault product, and logistic regression analysis was used. To classify whether the set casting parameter belonged to the good product or the fault product, new product requirements were presented according to the MTO environment, the decision tree (decision tree), and the k-nearest neighborhood (k-NN) algorithm. A decision tree is a model that is easy to understand and can be used for categorical and numerical variables, so it is suitable for judging between good and fault products. For the same reason, k-NN, which can use both categorical and numerical variables, was also applied. In this study, we analyzed the relationship between casting parameters and quality and analyzed the three methods to establish a model that can distinguish between good and bad when different casting conditions are used as inputs. Recently, we tried to utilize advanced deep-run, but deep-run does not perform well if the amount of data is small. In this study, we constructed the system and collected the data for only 1 year. Therefore, we did not have enough data for deep learning. We used the learning algorithm. As a method for analyzing categorical data, decision tree and k-NN were used.
Logistic regression
A logistic regression model is a statistical model that shows the relationship between the independent variable and the dependent variable as a function. Explaining dependent variables using a linear combination of independent variables is similar to the general regression model but differs, in that the results are given as the probability of belonging to a particular class when the categorical data (y) are used as output. In addition, in the general regression model, the dependent variable has a value in the range −∞ to +∞, whereas the logistic regression model has a value in the range 0–1, expressed as an S-shaped logistic function.
The regression coefficients of the logistic regression model are used to describe the relationship between dependent variables and independent variables, as well as the general linear regression coefficients. 26 In this study, logistic regression was used to describe the functional relationship between categorical dependent variables (good or poor) and one or more independent variables (casting parameters).
Logistic regression was selected as an analysis model because it was not possible to use a linear regression model categorically with only two values of “good” or “poor” for quality. A binominal logistic regression model is analyzed by considering logit transformations for the probability

where
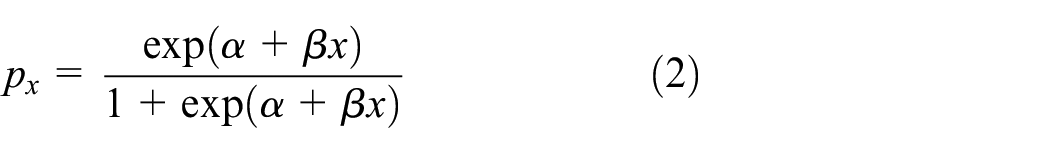
where the population parameter β determines the rate of increase or decrease of the S-curve. The sign of β indicates an increase or decrease in the curve, and the rate of change in the curve increases as |β| increases. If β = 0 in equation (1), the right-side term becomes a constant, so
When the number of samples is large, the above statistics are known to follow a standard normal distribution. If the observed value of the statistic is larger than a threshold value, the independent variable has a considerable influence on the response variable. 28
Based on the data obtained by preprocessing, 8000 good samples and 8000 defective samples were randomly chosen because the data of the good samples and those of the defective samples differed. In addition, 70% of the 16,000 data samples were used as learning data and 30% were used as test data.
The Akaike information criterion (AIC) was applied to the logistic regression model using the Step () function. The AIC is a criterion for simultaneously considering both the fitness and complexity of the model while removing insignificant explanatory variables. The AIC value is an effective way to exploit hidden relationships between response and explanatory variables. Generally, a good model has a low AIC. The AIC-derived values we obtained are shown in Table 5.
Results of AIC value.
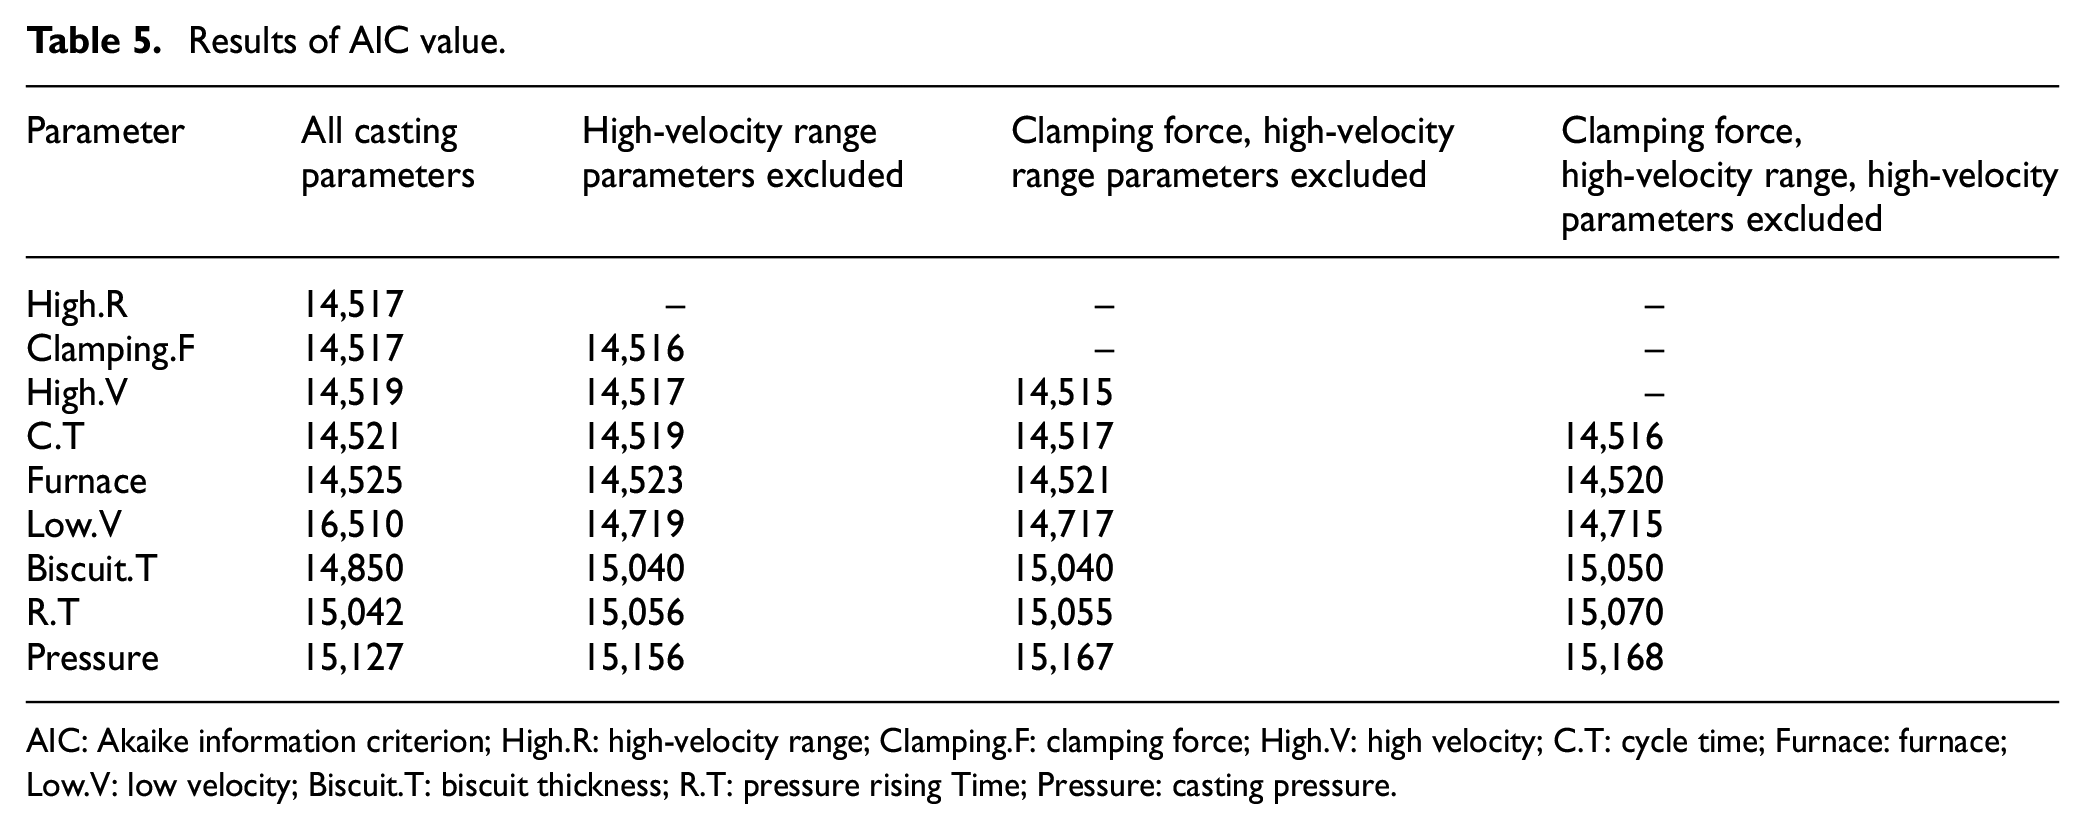
AIC: Akaike information criterion; High.R: high-velocity range; Clamping.F: clamping force; High.V: high velocity; C.T: cycle time; Furnace: furnace; Low.V: low velocity; Biscuit.T: biscuit thickness; R.T: pressure rising Time; Pressure: casting pressure.
The first AIC value is 14,519.18, which includes all nine casting parameters. The second AIC value is 14,517.31, where the high-speed (High.R) parameter is removed.
The third AIC is 14,515.54, where the high-speed (High.R) and clamping force (Clamping.F) variables are removed. The fourth AIC is 14,514.86, which has high-speed (High.R), clamping force (Clamping.F), and high velocity (High.V) removed. It can be seen that the fourth model with the lowest AIC is the most suitable model. Here, the AIC derivation value is obtained while eliminating the variables for which there is multi-collinearity.
This article analyzed through logistic regression how casting parameter conditions affect die-cast products. The logistic regression analysis results for the products of casting parameter conditions are as shown in Table 6.
Results of logistic regression.
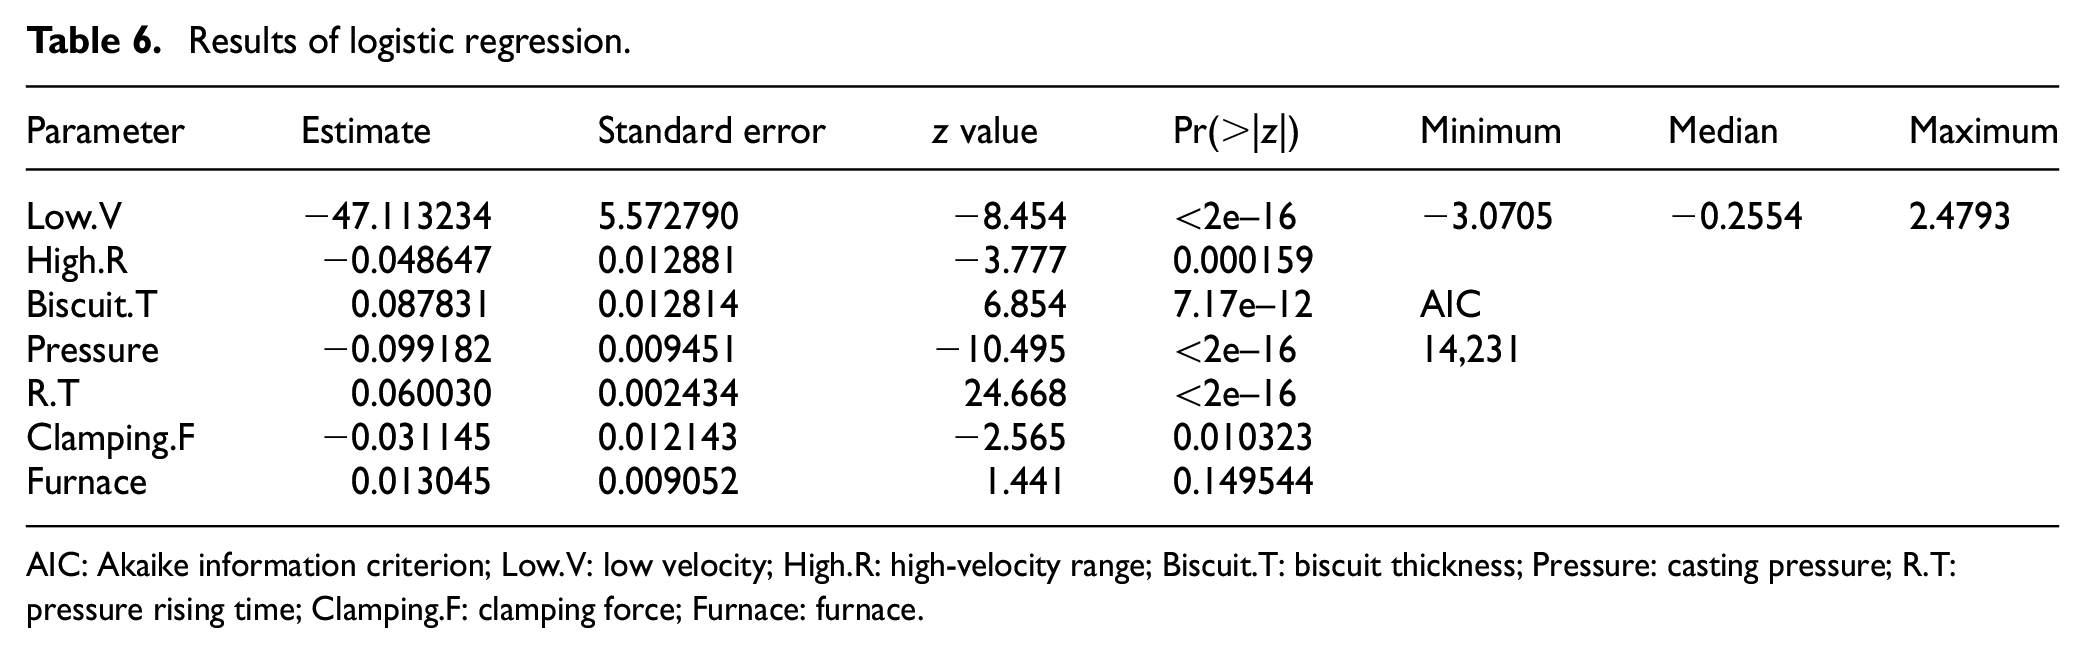
AIC: Akaike information criterion; Low.V: low velocity; High.R: high-velocity range; Biscuit.T: biscuit thickness; Pressure: casting pressure; R.T: pressure rising time; Clamping.F: clamping force; Furnace: furnace.
In Table 6, the variables with p values (Pr(>|z|)) less than 0.05 include low speed, high speed section, biscuit thickness, casting pressure, pressure rise time, and mold force but exclude furnace. All these parameters were statistically significant.
It is a limitation of this study that the analysis method cannot be used for the variables removed by multi-collinearity. In a statistical method, it is correct to set the fitness of the model after eliminating and processing the multi-collinear variables. However, because it is important to consider all the measured quality variables in the field for metal engineering research, further study is needed.
As such, logistic regression was performed to establish the relationship between casting parameters and the quality of the castings. To determine which of the derived parameters are classified as positive when the conditions of the derived foundry parameters are established, the data mining representative classification techniques decision tree and k-NN were used and the accuracy of the two models was compared.
Decision tree
A decision tree can easily understand and explain the analysis process compared to methods such as the discriminant analysis, regression analysis, neural network, and so on because decision-making rules are tabulated to categorize the group that is of interest into several groups or because the analysis process is expressed by a tree structure. In addition, in previous studies, this decision tree was utilized to derive the cause of abnormal situations in the manufacturing process and to perform an evaluation of this model. When defective products occurred, decision analysis was performed using 4M (man, machine, material, method) data. 29 This analysis has been performed as it is similar to this article to understand how the casting parameters are set in the event of a defect.
The decision tree model analyzes the data and shows the patterns between the individual variables as a combination of predictable rules. It is called a decision tree because its shape is similar to a tree. Decision trees are models for both classification and regression problems. Thus, both the category and the data in the form of continuous values can be predicted.
A decision tree is a method of creating a tree structure from the upper root node to a lower terminal node. In this case, the intermediate node and the reference value are designated in the intermediate node. When dealing with regression problems, two terminal nodes are created because the terminal node is responsible for the influence of the casting parameters on the quality, that is, the good and bad parts of the die-casting, during the manufacturing process of the automobile parts. When descending from the root node to an intermediate node, branching is performed at each node. In each region of several nodes, there arises a problem of finding the optimum of each region. Here, the numerical values for determining the optimum are homogeneity and impurity. As the purity increases and the impurity decreases, a good model can be derived. Entropy, which is one of the methods for evaluating good models, is used. Entropy can be expressed by the following equation, where d and m are the number of each record, and R and p represent the total number of categories/total categories. Therefore, the lower the entropy value, the higher the purity

In this case, when learning from the root node to the intermediate node, the misclassification rate decreases when going down to the terminal node. However, when more branches than a certain number are generated, the misclassification rate increases and overfitting occurs. At that point, pruning is needed to remove branches of the decision tree. The complexity of the decision tree is calculated by the cost function. In this case, CC(T) denotes the cost complexity of the decision tree, Err(T) denotes the misclassification rate for verification data, and L(T) is the number of terminal nodes. Weights are denoted by α 30

R programming provides three packages (caret, rpart, and party) for performing decision tree analysis. Each package differs in the way it prunes branches when making decision trees. The caret package uses binary recursive partitioning and the rpart package uses the classification and regression trees (CART) methodology.
Because these packages determine the variables to be pruned based on entropy and the Gini coefficient, the operation speed is relatively fast, but there is a risk of overcorrection. Therefore, when two packages are used, it is necessary to optimize the decision tree through the pruning process. Part packages use the unbiased recursive partitioning based on permutation test methodology. However, the level of the input variable is limited to 31. Therefore, a decision tree model is created when the branch eventually reaches the terminal node using the cost function. Comparing the decision trees for 0.23 and 0.01 points showed better results at 0.083, where the complexity parameter (CP) values are gentle at the pruning. Therefore, a decision tree model with a CP of 0.01 was selected. The CP is used to control the size of decision trees, and it is used to determine the optimal tree size. If another variable is added to the decision tree from the current node, the decision tree cannot be constructed if the cost is more than the CP. 25 The derived CP and frequency decision trees are summarized in the Table 7. Nsplit is the index, rel.error is the index associated with R-squared, xerror is the x validation error, and xstd is the standard deviation of xerror.
Summarized frequency decision trees.

CP: complexity parameter.
Therefore, we generated a decision tree model where CP is 0.01.
The decision tree model caret was used only for Biscuit.T, Pressure, and R.T variables, and many variables were eliminated. For accuracy of the model, many variables were removed, and only a few variables are used to show the whole parameter relationship. As shown in Figure 15, Biscuit. T <20.05 is the most important parameter.

Result of caret decision tree.
The decision tree model of rpart was also used for Biscuit.T, Pressure, and R.T variables, and many variables were eliminated. For accuracy of the model, many variables were removed and only a few variables are used to show the whole. As shown in Figure 16, Biscuit. T ≥20 is the most important parameter. More research is needed on models that can be analyzed considering other variables.

Result of rpart decision tree.
Table 8 compares the results of the caret package and the rpart package. The accuracy of the rpart package was higher by 0.001 than the caret package, and thus, the more suitable model for this study was the package with the slightly better results using the rpart package.
Comparison of caret and rpart.

ACC: accuracy; NIR: no information rate.
The results shown in Table 8 were derived. The accuracy of caret was 98%, and the sensitivity was 0.63. The specificity was 0.99. The accuracy of rpart was 98%, and the accuracy was the same, but there was a difference in sensitivity and specificity.
K-nearest neighbors
k-NN is a highly intuitive method of classifying an object in which k-nearest objects in the training dataset are found according to the similarity between samples and then assigned to groups of highest frequencies within the k set. Although it is a remarkably simple form of algorithm, it is an effective machine-learning method to find non-linear classification boundaries. k-NN is widely used in semiconductor industries for detecting abnormalities at manufacturing sites and classifying defective goods by utilizing inspection data.31,32
The k-NN method is a problem of identifying groups of data by calculating distances between data within a specific space and classifying whether the data belong to an existing group when new data are received. In this type of analysis, the Hammington distance, Manhattan distance, and Euclidean distance are used to obtain the closest point length. In this study, the Euclidean distance was used for the analysis. The Euclidean distance method is a commonly used method for calculating the distance between two points, and this distance can be used to define the Euclidean space. The values p = (
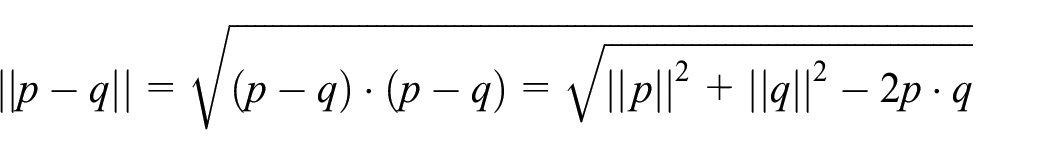
Therefore, by calculating this distance, we measure the distance between incoming data and make it dependent on the class. This learning method is simpler and does not require complexity because it classifies data-dependent classes only by distance of data.
Setting up k is at the heart of how well data are generalized. Having too many variables in the learning data causes overfitting, whereas too few causes underfitting. Therefore, if the value of k is large, the fluctuation due to noise can be reduced, but important patterns in the data can be missed. 33 Therefore, it is particularly important to carry out the analysis while adjusting the k value appropriately. Therefore, k was set from 1 to about 80 according to the number of analyzed data, and the optimal k value was derived as summarized in Table 9 and shown in Figures 17 and 18.
k-NN analysis results.

k-NN: k-nearest neighborhood.
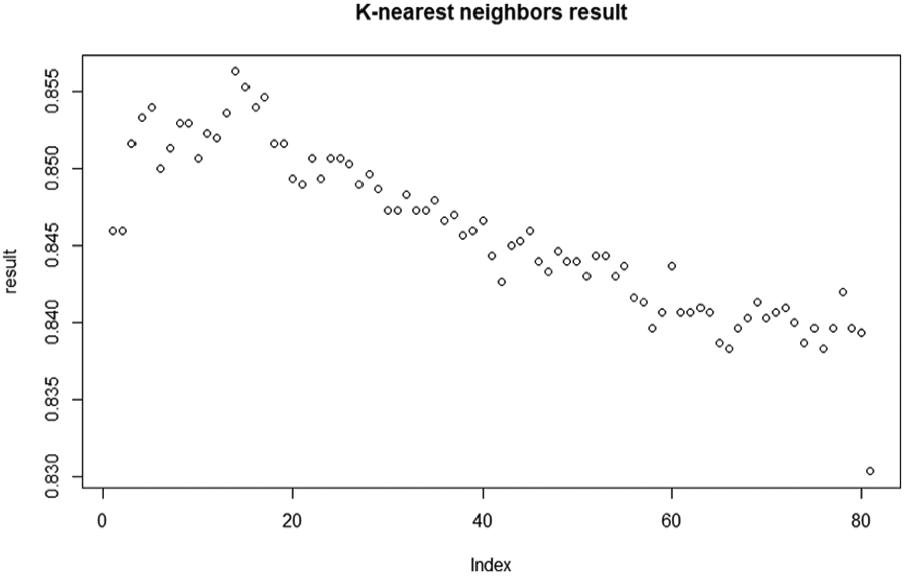
Find optimal k result.
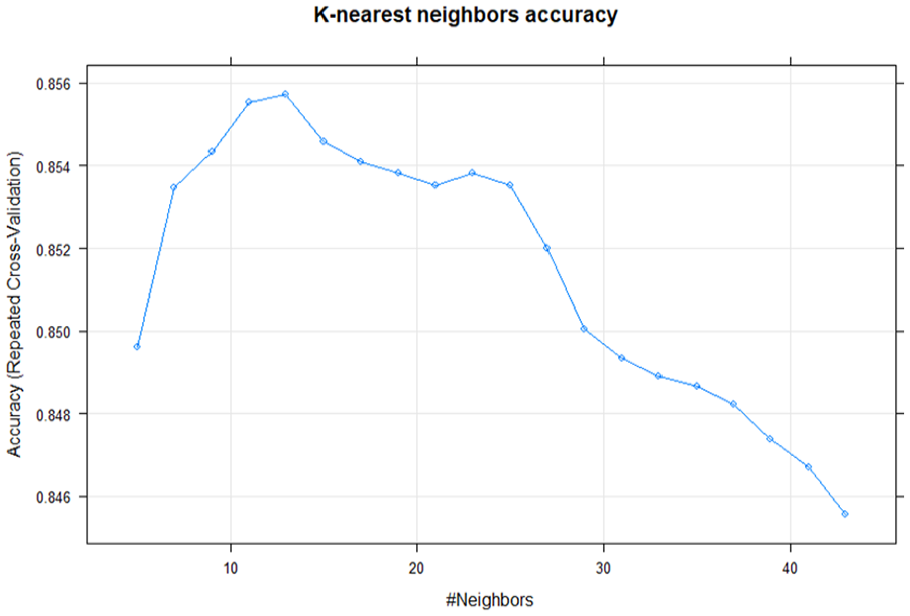
k-NN model accuracy.
Therefore, the 14th k had the highest accuracy. Therefore, the k-NN model was generated using k = 14, which resulted in an accuracy of about 85%.
Although the decision tree and k-NN analyses showed reliable performance in terms of class, the logistic regression model is more appropriate to the problem of determining how much the variable actually affects the casting process. In addition, too many decision variables appeared in the decision tree analysis, and when the pruning was performed, it was found that the considered variables were not suitable models, considering only three or four variables.
Comparison of decision tree and k-NN
Decisions trees have shown that the thickness of biscuit, rise time, and casting pressure have a significant effect on quality. The disadvantage of the decision tree is that the model is relatively unstable, and this study showed high accuracy, despite the use of two models. k-NN can be used to identify a relatively significant decrease in the accuracy of the classification using data in a high-dimensional form with a very large number of variables. Therefore, to derive important parameters for each product, using a decision tree rather than k-NN, as shown in Table 10, may result in a more accurate classification.
Comparison of decision tree and k-NN analysis results.

k-NN: k-nearest neighborhood; ACC: accuracy; NIR: no information rate.
Although it was hoped to present a detailed classification format for the k-NN model, k-NN has limitations in deriving the classification model for the model when there are too many variables. Therefore, although it was intended to be presented through a graph, the comparison between models was carried out based on accuracy due to limitations.
Although only a few parameters were shown as important variables in the data analysis, previous studies and on-site analysis considered different variables to further address the problem. Therefore, it will be necessary to draw up a plan to consider this throughout the enterprise. In the future, research will be carried out to identify the relationship between casting parameters using various algorithms and to develop algorithms that are suitable for them.
Conclusion
In this study, a smart factory (MES) was constructed for die-casting companies that produce automobile parts in Korea, and data analysis was conducted on data collected for 1 year. It can be seen that the entire process, from data collection to analysis of die-casting companies, was constructed and executed. Owing to national support through the smart factory support project, the number of smart factory builders in the domestic die-casting field is continuously increasing. However, most companies that have completed the installation use the smart factory only to monitor the real-time situation, and thus, the data collected by IoT cannot be utilized properly.
Therefore, we performed a company-wide data analysis study for “ABC” company from MES (data collection) to data analysis through a national project. We then modeled the casting parameters that had the greatest influence on quality. “ABC” company produces automotive parts using the aluminum die-casting technique. Aluminum die-casting has many factors that affect the final quality, but most of all, it is important to manage the casting parameters.
Arduino was used to collect data to study the conditions that the casting parameters produced in production. The information obtained from the die-casting facility was largely divided into the condition of the equipment, the casting conditions (parameters), and the melting furnace/hot-rolling furnace. The condition of the equipment was “operation,”“instant stop,” and “during preheating”; the casting conditions were shot number, low speed, high speed, high-speed switching position, high-speed range, biscuit thickness, casting pressure, spray, cycle time, mold force, and so on. The melting furnace/hot water furnace collected data, such as the temperature of the molten metal, the temperature of the hot water, and the amount of dissolved gas used.
In this study, the casting parameters (low speed, high speed, high-speed switching position, high-speed range, biscuit thickness, casting pressure, pitch height, pressure rise time, spray time, and cycle time) were collected. In addition, the logistic regression analysis, decision tree, and k-NN methods were used to determine the relationship between the 11 parameters and the quality of the defective products as automatically determined by the robot. Logistic regression analysis showed that the product was manufactured with statistical significance for the following parameters: low speed, high speed, biscuit thickness, casting pressure, pressure rise time, and mold clamping force. The furnace parameter was not statistically significant.
The decision tree and k-NN methods were used to perform classification according to the casting parameters when new casting parameter data were used as input. Although decision tree was higher in accuracy, both decision tree and k-NN used only some parameters. Further research focusing on data analysis is needed. Traditional logistic regression and decision tree and k-NN analysis have limited results to be derived. Therefore, the company wants to develop an algorithm to identify the relationship between parameters in the future and to create a model that can respond to different parameter conditions for different products.
In the future, we will investigate the relationship between the casting parameters and more products and then identify the casting parameters affecting each product. In addition, it will be necessary to establish measures to manage the casting parameters by product form/type.
Contribution
The importance of casting parameters has been studied in the past, and many studies have suggested that parameter management has a great influence on quality. Based on these studies, we have been using casting analysis simulation software to manage these casting parameters at die-casting manufacturing sites. However, even if the casting parameters of the same conditions are set, the defects continue to appear, and the reason for the failure is not revealed.
As the smart factory technology develops, the manufacturing field is changing from data center to data center. Therefore, we are building smart factories at many die-casting manufacturing sites, but we are not using the data collected through IoT and using it as a monitoring level. Our goal is to provide a basis for analyzing the data using the data collected through IoT.
Although SME die-casting companies in South Korea are carrying out production in line with smart factory revival policies, most of them are carried out by production workers registering them in their systems. For several reasons, only a few companies are using the MES system and collecting data via the IoT. When facility data are acquired through IoT, the accuracy of data increases and a manufacturing big data environment is established, which shows that management can be supported by utilizing a variety of data. This research shows that IoT data can be used for quality control of parts. This is expected to give insight to SME die-casting companies that want to introduce smart factories in the future. In addition, the need to develop algorithms to perform various analyses in the die-casting industry was derived. It is significant that researchers involved in data analysis have made it known that algorithms are needed in the field. And even if we build a system based on IoT, Korea’s small- and medium-sized die-casting companies are not able to utilize the data collected through the IoT. We can reduce the manufacturing defect rate through big data analysis of casting conditions in the die-casting field, and we can establish relationships between the data-based casting condition criteria and the actual casting conditions. A casting condition is derived to provide a focal point to concentrate on to reduce the defect rate.
Casting analysis simulation software is expected to result in competitiveness in quality related to casting parameters through pre-casting parameter management and post-data–centric casting parameter management. This is expected to contribute greatly to improving the productivity and reliability of die-casting manufacturers.
This article also provides an analytical process for data analysis of the die-casting industry and provides analytical sources that can be easily analyzed at the manufacturing site.
Limitations
IoT was used for data collection, but most facilities in the domestic die-casting field use Toshiba, Toyo, and Ube facilities as Japanese facilities. Because Japanese facilities do not disclose this facility protocol, it has limitations in facility data collection. Data that can be collected using IoT were limited to nine casting parameters and three plant states. Factory environment information (temperature and humidity) was determined at the manufacturing site by continuously using the existing digital thermometer. Therefore, environmental information was not considered to conduct research based on IoT data. In addition, numerous studies have shown that incorrect casting parameter settings have a significant effect on casting quality. In this study, we focused on studying the influence of quality on collected casting parameter data and did not consider other parameters.
In the analysis of the data, statistical techniques were used. It is necessary to investigate how to improve the accuracy of the model and solve the limitations encountered by eliminating variables due to multi-collinearity problems. In addition, it is necessary to accurately investigate and confirm the standards for separating and discharging of product by the existing robots. It is necessary to expand our research because it is not possible to derive general models by utilizing the data of only one facility. In addition, the existing model limited the identification of relationships. Therefore, it is necessary to utilize the collected data to develop algorithms focused on casting parameters. Because this study focused only on application for data analysis techniques, further detailed research on this should be continued.
In addition, it is necessary to analyze the information on the humidity and temperature of the casting site. However, this study focused on identification of the management method of the casting parameters, and so environment information is not considered.
Supplemental Material
DSN-18-0899.R1 – Supplemental material for Establishment of an IoT-based smart factory and data analysis model forthe quality management of SMEsdie-casting companies in Korea
Supplemental material, DSN-18-0899.R1 for Establishment of an IoT-based smart factory and data analysis model forthe quality management of SMEsdie-casting companies in Korea by Sangwoo Park, Kim Changgyun and Sekyoung Youm in International Journal of Distributed Sensor Networks
Footnotes
Handling Editor: Sang Do Noh
Authors’ contribution
S.P. designed the overall research structure and the performance model, K.C. specified the data model and data analysis, and S.Y. performed the experiments of logistic regression analysis.
Declaration of conflicting interests
The author(s) declared no potential conflicts of interest with respect to the research, authorship, and/or publication of this article.
Funding
The author(s) disclosed receipt of the following financial support for the research, authorship, and/or publication of this article: This work was supported by the public–private joint smart plant inference funded by the Korean government and Dongguk university grant of 2016.
Supplemental material
Supplemental material for this article is available online.
References
Supplementary Material
Please find the following supplemental material available below.
For Open Access articles published under a Creative Commons License, all supplemental material carries the same license as the article it is associated with.
For non-Open Access articles published, all supplemental material carries a non-exclusive license, and permission requests for re-use of supplemental material or any part of supplemental material shall be sent directly to the copyright owner as specified in the copyright notice associated with the article.