
Abstract
The study of the robust fatigue feature learning method for the driver’s operational behavior is of great significance for improving the performance of the real-time detection system for driver’s fatigue state. Aiming at how to extract more abstract and deep features in the driver’s direction operation data in the robust feature learning, this article constructs a fuzzy recurrent neural network model, which includes input layer, fuzzy layer, hidden layer, and output layer. The steering-wheel direction sensing time series sends the time series to the input layer through a fixed time window. After the fuzzification process, it is sent to the hidden layer to share the weight of the hidden layer, realize the memorization of the fatigue feature, and improve the feature depth capability of the steering wheel angle time sequence. The experimental results show that the proposed model achieves an average recognition rate of 87.30% in the fatigue sample database of real vehicle conditions, which indicates that the model has strong robustness to different subjects under real driving conditions. The model proposed in this article has important theoretical and engineering significance for studying the prediction of fatigue driving under real driving conditions.
Introduction
Road traffic accidents are one of the main causes of human casualties. According to the World Health Organization (WHO), 1 traffic accidents will jump to the fifth place in the main cause of death in 2030, far higher than infectious diseases such as AIDS and tuberculosis. As the primary cause of traffic accidents, fatigue driving has attracted wide attention from all walks of life in recent years. In 2014, NHTSA’s FARS database had 846 driving-related fatal accidents, which was basically consistent with the death data of the past decade; between 2005 and 2009, there were an average of 83,000 accidents related to fatigue driving each year, and 886 among them were fatal accidents (accounting for 2.5% of all fatal accidents). 2 Therefore, research on identification of driver fatigue state and early warning technology under real vehicle conditions is conducive to reducing road traffic accidents caused by fatigue driving.
Fatigue driving usually refers to the driver’s mental and physiological dysfunction after a long-time driving, which naturally leads to a decrease in the driver’s driving control ability. According to the sensor data source of the fatigue monitoring systems, the existing driver fatigue monitoring systems mainly fall into two types: intrusive and non-intrusive. The intrusive fatigue monitoring system mainly analyzes the physiological characteristics of the driving process by collecting the physiological data of the driver and realizes the monitoring of the driver’s fatigue state. The data used in such systems mainly include electroencephalography (EEG) signals, electro-optical (EO) signals and electrocardiography (ECG) signals.3–6 The results of other literature studies show that the main disadvantage of the contact fatigue monitoring system is that the system needs to install a data acquisition sensor in a certain part of the driver’s body, which may easily lead to distraction or discomfort of the driver, and thus its application in real conditions is restricted. Non-intrusive systems primarily monitor driver fatigue by extracting driver’s facial features and operational behavior characteristics.7–11 During the monitoring process, the driver’s normal driving will not be disturbed, and the data acquisition and fatigue monitoring can objectively reflect the driver’s actual operating behavior or state. 11 At present, the non-intrusive method has become popular in the field of driver fatigue monitoring. 12
A fatigue monitoring system based on driver’s steering wheel angle (SWA) information is a type of non-intrusive method. Studies have shown that after driving for a long time, the driver will suffer from lack of energy or fatigue. At this time, his ability to operate or control the vehicle will be greatly reduced, resulting in decline in steering wheel rotation accuracy and frequency.13,14 Therefore, by collecting the real-time operation data of the driver’s steering wheel, the fatigue characteristics of the direction angle data change are mined, and the driver fatigue level identification model is constructed to realize the effective detection of the driver’s fatigue level.15–17
Eskandarian and Mortazavi 18 established a monitoring model and method for the driver’s fatigue level by analyzing the amplitude variation characteristics of the driver’s direction operation data, and the correct recognition rate of the fatigue level is 85%. Berglund 19 used simulator data for fatigue driving experiments on 22 subjects, which collected state variables of 10 vehicles including SWA, steering wheel angular velocity, steering wheel torque, yaw rate, and vehicle lateral position. With the extracted 17 fatigue indicators and a linear regression model, the detection accuracy of fatigue detection reached 87%. Fukuda et al. 20 analyzed the statistical characteristics of driver’s SWA sequence and found that the periodicity of the time series has a certain internal relationship with the fatigue state, realizing the online identification of the driver’s fatigue level, and the correct recognition rate of the fatigue level reached from 76% to 88%. In addition, based on the statistical analysis of the driver’s direction angle data, Qu et al. 2 and others extracted 11 characteristic indicators reflecting the driver’s fatigue level, and constructed a SVM-based fatigue classification recognition model. The correct monitoring rate of the third-level fatigue hit 87.7%. However, most of the research data in the existing literature comes from the driving simulator environment, and the reliability of the fatigue monitoring system developed on this basis still lacks effective verification under real vehicle conditions.
The existing literature monitors a lot of work based on the fatigue of the driver’s direction angle, but these methods have extracted more statistical features of drivers’ operation time series, and shows little of their individual difference, which easily leads to the fact that the fatigue detection method is not robust enough under real vehicle conditions. Bittner et al. 21 reported the effectiveness of the existing fatigue feature indicator under actual road conditions. It was found that angle standard deviation with good performance in the driving simulation environment is not effective in the fatigue detection under real vehicle conditions. This is because the steering characteristics of the real vehicles are not only related to the fatigue level of the driver, but also related to the external environment such as the operator’s driving habits, steering ability, speed, and actual road conditions; Meanwhile, due to the random jitter on the road, the probability of mixing noise and drift in the SWA data is greatly increased, which leads to more complicated analysis of the SWA characteristics, feature selection, and performance optimization under real vehicle conditions.
In addition to the feedforward connection structure of the traditional network, the recurrent neural network realizes the recurrent connection between the neurons in the network, that is, the hidden layer units are not independent of each other, and the hidden layers are not only related to each other, but also the time series input before the time of the hidden layer unit is accepted, so that, in this structure, drivers’ operational characteristics and fatigue features can be transmitted in the direction of the time series. This advantage enables it to make full use of historical information and achieve a series of remarkable results in solving problems such as time-series nonlinear system modeling.22–25 This article makes use of the unique advantage of the recurrent neural network in processing time series data, designs the feature extraction model for the driver’s direction angle time series under real driving conditions, and deeply exploits the driver’s operational characteristics in the time direction. A robust driver fatigue feature learning model is constructed to solve the individual differences and random complexity faced by the driving fatigue detection system.
Background
Usually, the driving process can be considered as a typical nonlinear dynamic system. Mining the nonlinear characteristics of the time series data of the operational state is beneficial to the driver’s fatigue state analysis and identification. Under the real driving conditions, in order to ensure safe driving, the driver must constantly judge the driving state of the vehicle. Once the vehicle state is out of the estimation, it should be corrected in real time. When the driver is in a state of fatigue, the driver’s ability to perceive the environment, the ability to judge the situation, and the ability to control the vehicle will decrease, resulting in greater error tolerance to the vehicle and reduced control accuracy, and, consequently, the vehicle control variables and state variables will have a different amplitude or frequency with those in the awake state. Existing studies, Krajewski et al. 26 and Zhang et al., 27 have shown that fatigued drivers’ behaviors in operating the steering wheel become obviously abnormal compared with those in a non-fatigued state. For instance, the correction time interval of the steering wheel becomes longer and the instantaneous correction range becomes larger. Therefore, the driver’s steering wheel operating characteristics can reflect the fatigue state of the driver, and the nonlinear characteristics, irregularities, and individual differences implied by the steering wheel operation time series data also vary under different fatigue states.
Traditional artificial neural networks, also known as feedforward neural networks (FNNs), consist of a series of simple neurons. A simple FNN usually consists of an input layer, a hidden layer, and an output layer. The neuron response in the FNN is usually derived from the different degrees of excitation of all neurons in the upper layer, that is, mathematically can be expressed as the sum of the weights of all the neurons in the upper layer, but there is no connection between the neurons in the same layer of the FNN. There is no loop on the network structure, and there is no feedback connection between the output of the network and the model itself. Data pass through the neural network layer by layer from the input layer until the final output layer. The observations of all the neuron cells in the same layer of the traditional artificial neural network are processed independently of each other. However, the data in many tasks are rich in context information, and there is a strong correlation between them in time, such as, audio, video, and text, so FNN still has a lot of limitations in many tasks, especially the time series features with strong correlation in mining time dimension and thus the performance of traditional artificial neural network is not promising. The biggest difference between recurrent neural networks and traditional artificial neural networks is that the neurons between the hidden layers have temporal storage and recursion. The output of neurons at a certain moment can be used as the input of the next layer of neurons. The network structure is well suited for time series data and can maintain dependencies between the data. The classical recurrent neural network structure is shown in Figure 1, 28 in which the H layer is an implicit layer, which is connected through the loops on the hidden layer, so that the network state at the previous moment can be transmitted to the current moment, and the current state can also be passed to the next moment. For the expanded recurrent neural network, a repetitive structure can be obtained and the parameters in the network structure are shared, greatly reducing the neural network parameters required for training. Therefore, the recurrent neural network has a good advantage in studying the behavioral characteristics of the driver and the learning of fatigue characteristics.
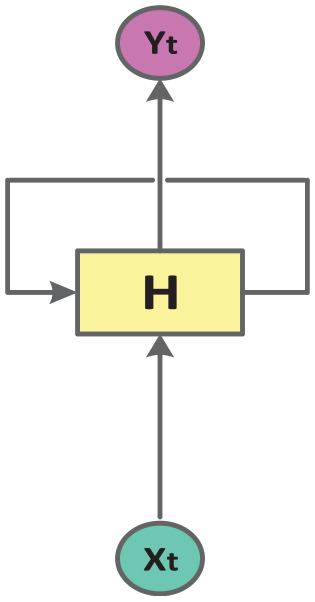
Traditional recurrent neural network model.
Methodology
Combining the self-organizing, adaptive learning and selective long-term memory ability of self-organizing competitive network, a new fuzzy recurrent neural network is constructed to extract fatigue characteristics, and the fatigue feature space of the driver is obtained. In this article, a four-layer fuzzy recurrent neural network model is designed, and its structure is shown in Figure 2.

An improved recurrent neural network model.
In Figure 2, the first layer is the input layer, and the input data are the spatio-temporal feature quantity of the SWA under real road conditions, and the input variable is
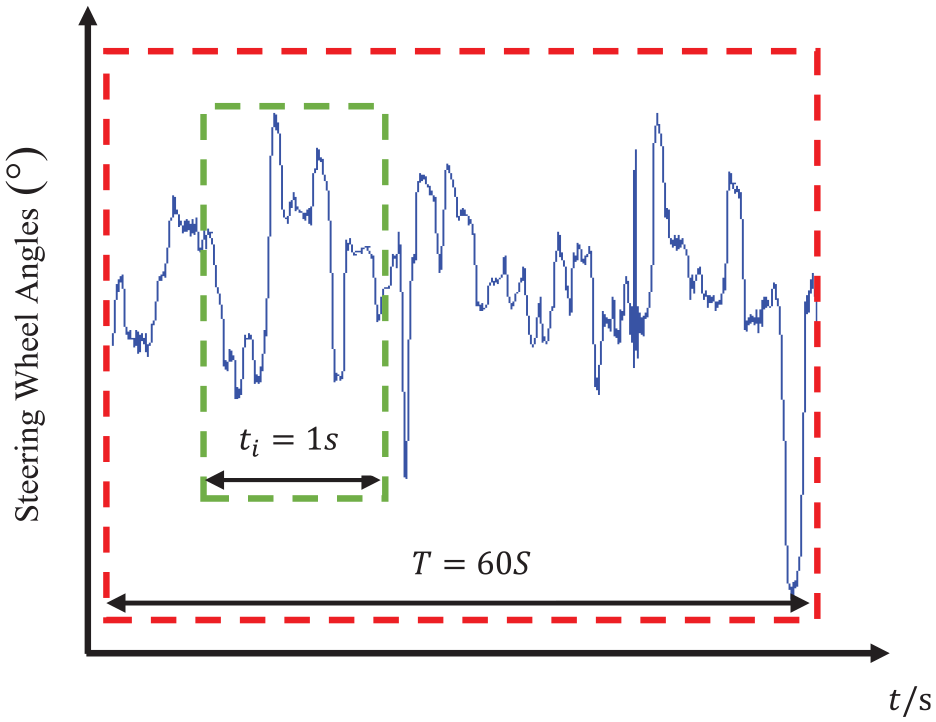
Time window and sample window of SWA sensor data.
In Figure 3, time window

In equation (1), f is the sampling frequency of the direction angle time series, and
In Figure 2, the second fuzzified neuron is blurred by a smooth Gaussian function, and the fuzzification of the second layer is expressed by equation (2)

The third layer is the hidden layer of the recurrent neural network. The neurons are not only related to the excitation output of the previous layer but also realize the information transmission of the neurons in the same layer, making weight influence on the neighbors and depicting the precise relationship between state and time under the real vehicle conditions. The forward propagation of the hidden layer can be expressed by equation (3)

In equation (3),

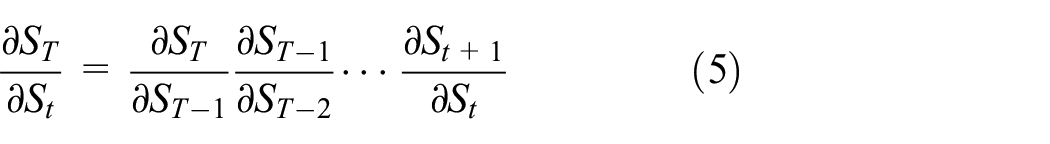
According to the chain rule, the Jacobian matrix
The fourth layer in Figure 2 is the competition layer, and the competition winner, output 1, is transmitted to the next neuron through the memory unit


In equation (6),
Experiment and results
Experiment platform and sample data
The structure of the real vehicle and road data acquisition platform is shown in Figure 4. Distributed sensors are mainly used for data acquisition of driver operating characteristics and vehicle status such as SWA, brakefroce, leftsteer, rightsteer, can_braking, can_thrott, and YawRate. The data collected by the sensor are processed by the VBOX system, to realize data storage, display and video monitoring, and so on.

Acquisition platform for driver operation and vehicle data.
With the data acquisition platform shown in Figure 4, the subjects’ facial video images are obtained. This article uses the facial-video-based expert scoring method to construct the driver fatigue state sample database. The method scores the fatigue status of a driver based on the driver’s facial expression and head posture. Wierwille and Ellsworth 29 first cited this method in the driver fatigue state assessment. The specific operation steps are as follows: the driver’s facial video is divided into video clips; multiple experts score the video clips according to the random sequence according to the driver’s blinking, scratching, yawning, closing the eyes, adjusting the posture, and other fatigue characterizations. The evaluation result is a continuous value of 0–100 points; the average of multiple expert scores is used as the fatigue score of the video. In this article, the driver’s fatigue state is set to three levels, that is, awake, fatigue, and very fatigue level. With the driver’s facial video as the evaluation basis, the driver’s operation characteristics and vehicle state data collected by VBOX are taken as experimental data. Considering the complexity of multidimensional spatio-temporal data, this article only takes the driver’s SWA data as the research object to test the feasibility of the designed model in this article. The time series distribution of the SWA when the driver’s awake, fatigued, and very fatigued is, respectively, shown in Figures 5–7 . As can be seen from Figure 5, when the driver is in the awake state, the frequency of the wheel-steering operated by the driver is relatively high, and the frequency of the substantial direction operation is low. When the driver is getting tired, the driver’s direction steering frequency is reduced, and the frequency in dramatic steering is increased as shown in Figure 6. When the driver is very tired, with the decrease of driver’s control ability, the time of non-operating the steering wheel increases, and at the same time, the driver quickly and dramatically turns the steering wheel, and the time series distribution is as shown in Figure 7. From the fatigue driving data of eight subjects, after data filtering processing, 790 fatigue driving samples were formed, and the fatigue state level distribution of each subject is shown in Figure 8. In the experiment of the article, the number of neural network layers is four layers, the input layer node, the fuzzy layer, the hidden layer, and the output layer node are all 60, and the learning rate is 0.42.
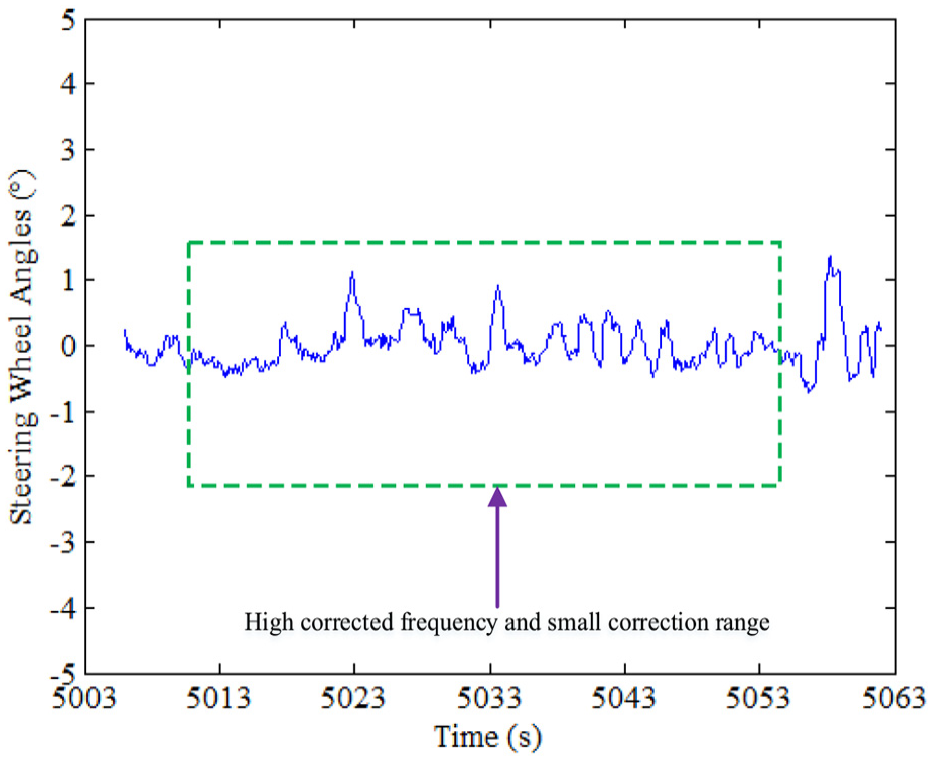
Time series of SWA at awake level.
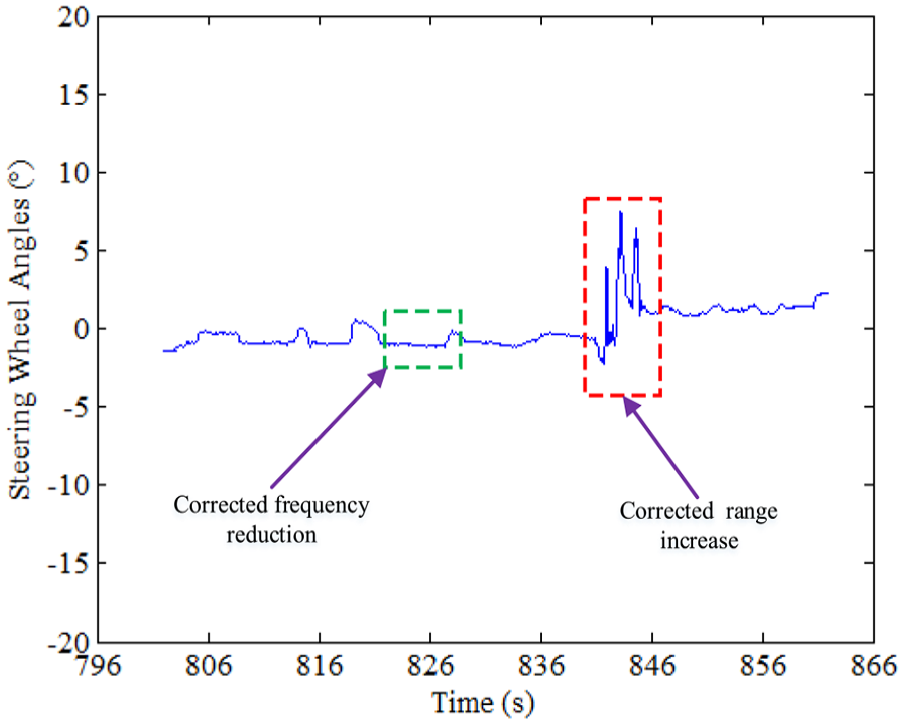
Time series of SWA at fatigue level.

Time series of SWA at very fatigue level.

Samples distribution of driver fatigue state.
Experiment results
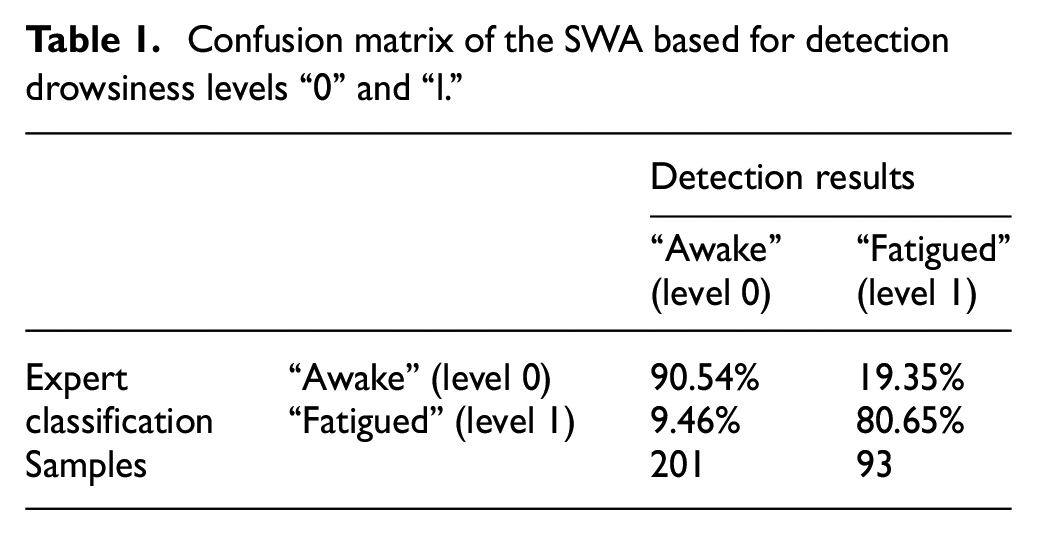
In this article, 60% of the samples are randomly selected from the 790 samples of eight subjects as training samples, and the remaining 40% are test samples. First, the “very fatigued” level is incorporated into the general “fatigued” level, that is, the fatigue level of the test sample is divided into two levels: awake and fatigued, and all the sample test results of the fatigue level “0” and “1” of the subjects are shown in Table 1. The test samples in Table 1 totals 315, including 222 cases of fatigue level “0” and 93 cases of fatigue level “1.” It can be seen from Table 1 that the correct detection rate of fatigue level “0” is 90.54%, and misjudgment rate is 9.46%. For the fatigue level “1,” the correct detection rate is 80.65% and the false positive rate is 19.35%. Second, the sample data are tested according to the three fatigue levels, that is, the fatigue states of the sample are “awake,”“fatigued,” and “very fatigued,” which are represented by “0,”“1,” and “2,” respectively. The results are as shown in Table 2: there are 315 experimental test samples, including 222 cases of awake state, 76 cases of fatigued state, 17 cases of very fatigued state, the correct recognition rate of samples in awake state is 90.05%, and the false rate is 9.91%, all of which are falsely judged as fatigue level 1. The correct recognition rate of the fatigue state sample is 80.26%, and the false rate is 19.74%. Among them, 10.21% fatigued samples are misjudged to awake, and 9.53% misjudged to very fatigued; the recognition rate of the very fatigued sample is 76.47%, and the false rate is 23.53%, among which 5.52% very fatigued samples are misjudged to awake, and 18.01% are misjudged to fatigued state. The average false positive rate is 9.68% and the average false negative rate is 13.99% from the all samples. Based on all the test samples in Tables 1 and 2, the average correct recognition rate is 87.30%.
Confusion matrix of the SWA based for detection drowsiness levels “0” and “l.”
Confusion matrix of the SWA based for detection fatigue levels “0,”“l,” and “2.”

SWA: steering wheel angle.
Discussion
The method proposed in this article uses the SWA data to detect the driver’s fatigue state based on the fact that the driver’s mental state can directly reflect its operational behavior. The steering wheel rotation is the most frequent and sensitive operation of the driver. Using the SWA makes the system more robust and reliable. The fatigue detection method based on the SWA can identify the three levels of fatigue status: “awake,”“fatigued,” and “very fatigued.” The method proposed in this article takes the driving sample data of eight subjects as the experimental object. The correct rate for fatigue state detection reaches 87.02%. The reliability of the detection system is ensured by the fact that the direction angle data in obtained in the real road environment and more accurately reflects the mental state and operational behavior of the driver than the data in the laboratory simulation environment. At the same time, the detection system has a very low rate of false alarms of “fatigued” state (9.46%) from Table 1, and the rate of false alarms of “very fatigued” state (9.53%) from Table 2. This detection system is also robust because the evaluation criteria of the system comes from the consistent evaluation results of multiple experts and multiple methods, which is based on facial video information, rather than the direction angle information. The universality of the standard evaluation method is resulting from its combination of the driver’s facial expression, head posture, and mental state conditions to comprehensively score the driver’s fatigue rating. The recursiveness of the evaluation criteria makes the detection system very robust.
Unfortunately, there’s little existing literature reporting the direction-angle fatigue detection method based on real vehicle conditions. It is difficult to have an objective comparison of the superiority of the method proposed in this article. Compared with the author’s previous research, the correct recognition rate of the proposed method, 87.30%, is higher than the previous results, 82.07% and 78.01%.15,16 Qu et al., 2 using the simulation environment sample data under the laboratory platform, with the SWA data, has obtained a correct recognition rate of 86.1%, which is lower than the correct recognition rate of this article, 87.30%. Comparing the directional data characteristics of the real vehicle environment and the laboratory environment, it is found that in actual vehicle conditions, there is a serious drift in the steering wheel corner sequence due to the randomness of the vehicle vibration. The irregular drift of the time series exists in the original data as the statistical features of an illusion, making the statistical feature extraction of the directional angles extremely difficult. Although the correct rate of the driver’s fatigue state detection in the direction angle is lower than that of the biomedical signal (The accuracy of estimation is about 96.5%–99.5%), 3 considering the actual driving environment, the method proposed in this article is more convenient and feasible.
Conclusion and future work
A fatigue driving characteristic learning model based on recurrent neural network structure is proposed. This model has solved the problem that the fatigue feature extraction of steering wheel operation data is difficult under real vehicle conditions. Considering the safety in real driving conditions, more researches were done in the past on the simulation angle data based on the laboratories and much less on the data based on the actual driving conditions. This article uses multi-distributed sensors installed in the real vehicle system, collecting data on driver operating characteristics and vehicle status such as SWA, brakefroce, leftsteer, rightsteer, can_braking, can_thrott, YawRate, and facial video, combining the time series distribution characteristics of steering data, and innovatively proposes a fuzzy circulatory neural network model. Taking 557 samples as the object, this method has achieved the fatigue state identification rate of 87.30%, surpassing the fatigue state detection based on laboratory simulation data.
Previous work of Qu et al. 2 has shown that the SWA, combined with vehicle yaw angle, vehicle lateral position, and other vehicle status data, has a higher fatigue state recognition rate in the laboratory simulation environment. Inspired by this idea, the integration of SWA, vehicle yaw angle, vehicle lateral position, and other vehicle status data under real vehicle conditions may improve the driver’s fatigue detection accuracy, which is a meaningful work for us.
Footnotes
Handling Editor: Xing Chen
Declaration of conflicting interests
The author(s) declared no potential conflicts of interest with respect to the research, authorship, and/or publication of this article.
Funding
The author(s) disclosed receipt of the following financial support for the research, authorship, and/or publication of this article: This work was supported by the Natural Science Foundation of China under grant number 61873043 and, in part, by the Natural Science Foundation of Chongqing under grant number cstc2018jcyjAX0048.