
Abstract
Human drivers have rich and diverse driving characteristics on curved roads. Finding the characteristic quantities of the experienced drivers during curve driving and applying them to the steering control of autonomous vehicles is the research goal of this article. We first recruited 10 taxi drivers, 5 bus drivers, and 5 driving instructors as the representatives of experienced drivers and conducted a real car field experiment on six curves with different lengths and curvatures. After processing the collected driving data in the Frenet frame and considering the free play of a real car’s steering system, it was interesting to observe that the shape enclosed by steering wheel angles and the coordinate axis was a trapezoid. Then, we defined four feature points, four feature distances, and one feature steering wheel angle, and the trapezoidal steering wheel angle (TSWA) model was developed by backpropagation neural network with the inputs were vehicle speeds at four feature points, and road curvature and the outputs were feature distances and feature steering wheel angle. The comparisons between TSWA model and experienced drivers, model predictive control, and preview-based driver model showed that the proposed TSWA model can best reflect the steering features of experienced drivers. What is more, the concise expression and human-like characteristic of TSWA model make it easy to realize human-like steering control for autonomous vehicles. Lastly, an autonomous vehicle composed of a nonlinear vehicle model and electric power steering (EPS) system was established in Simulink, the steering wheel angles generated by TSWA model were tracked by EPS motor directly, and the results showed that the EPS system can track the steering angles with high accuracy at different vehicle speeds.
Introduction
With the development of artificial intelligence and 5G technology in the past 5 years, the market for autonomous vehicles is extremely hot, but there is still a relatively long way to reach real industrialization. 1,2 At present, the industry generally agrees that the technologies that can take the lead to carry out are all autonomous driving technologies in specific scenarios, such as robo taxi, 3 auto valet parking, 4 and so on. What bothers researchers are complex traffic scenarios and the unpredictable behavior of traffic participants. 5,6 Some scholars also realize that studying human driving behaviors will not only help to bring a better riding experience to autonomous vehicles under mixed traffic scenes (autonomous vehicles, human-driven vehicles, and pedestrians sharing the road) but also improve the safety factor of all the vehicles. 7,8
Curve driving is a very common road scene in real transportation traffic. Compared with driving on straight roads, human drivers present more diversified characteristics on curved roads. Many scholars have studied the relationships between human drivers’ vehicle speed, steering wheel angle, trajectory, and external environment (e.g. other vehicles, weather, and lane markings) or internal factors (e.g. age, driving experience, physical and mental states). Kihan et al. 9 presented a test result conducted in the proving ground and concluded that the preview distance of expert drivers was longer than novices’ as the road curvature was increased, the overall steering input of novice was larger than expert drivers and novice drivers generally tended to maneuver more excessively and unsafely than expert drivers. Xiaomeng et al. 10 conducted a driving simulator experiment to evaluate the relationships between foggy weather, driver experience, gender, and driving behavior on a continuous S-curve, and it was found that drivers’ experience significantly influenced the maximum lane position (the maximum distance between the center of the simulator and the center of the lane), and nonprofessional drivers’ maximum lane position was larger than professional drivers’. Yong et al. 11 tested the curve speed control system on a sharp S-curve and found that the car decelerated on the first leg of S-curve, and then, it accelerated slightly before entering the sharp second curve. Kandil et al. 12 observed which strategy drivers normally use when negotiating curves, and they confirmed that participants normally looked at the tangent point. Kang et al. 13 used virtual driving simulator to observe human drivers’ behavior and they found that: when the driver was driving on the curves, they reduced vehicle speed and acceleration; when the driver was driving on the transitional road, they would increase vehicle speed and acceleration.
The aforementioned research collected human drivers’ driving maneuvers on curves through real vehicle experiments or driving simulators and made meaningful conclusions about the speed control, steering control, and where the driver looks when driving. This article focuses on the study of the steering control (i.e. lateral control) of experienced drivers. When it comes to lateral control of autonomous vehicles, the most classical and practical method is the preview driver model. Preview driver models are based on the theory of optimal preview controller, the first step is to construct a path error function by previewing the road, and the second step is to minimize the differences between the preview points and the desired trajectory of the vehicle over the preview distance. 14 Depending on the number and type of inputs, the effects of the preview driver models may vary widely. Another widely used method for steering control of autonomous vehicles is model predictive control (MPC). 15 For MPC, steering control of autonomous vehicles is usually solved by designing control laws that make the vehicles track desired trajectories by way of minimizing the error between the real path and the desired trajectory. However, due to the vehicle dynamic models exhibiting complex nonlinear terms and significant uncertainties, MPC usually has drawbacks in solving this kind of problem. In this case, some researchers proposed to use more complex modeling in classic nonlinear model predictive control (NMPC) or robust NMPC. 16 To make the above models have human drivers’ characteristics, it is usually necessary to set a suitable preview distance and reaction time in preview driver models, and an appropriate prediction horizon and control horizon in MPC. Many scholars have made the above models get closer to human driver’s performance. However, they did not reflect the exact human drivers’ steering maneuvers. 17 What is more, both the preview driver model and MPC need to set a desired trajectory in advance, 18 which is inconsistent with the actual driving behavior of human drivers.
At this time, data-driven modeling methods 19,20 provide new ideas in the implementation of human-like lateral control. Lin et al. 21 developed a neural network (NN) controller for human driver handling behaviors in a driver-vehicle-environment system and different NN architectures were employed and they found that radial basis function network model showed promise in modeling driver behavior. Linsen et al. 22 proposed to use reinforcement learning to simulate drivers’ behavior in terms of longitudinal and lateral actions in two driving situations. James et al. 23 developed an adaptive driver model for longitudinal movements of a vehicle, and the adaptive driver model incorporated a conventional feedback brake controller, and both fixed and adaptive NN controllers to produce the throttle demand. Olabiyi et al. 24 proposed a novel driver action prediction system that integrated both recognition and prediction systems and the proposed prediction system was based on a deep bidirectional recurrent NN, which enabled temporal fusion of both past and future context to learn the correlation between sensor data and future driver action. Of course, the deeper and more complex the NN is used, the larger the computational resources are required.
The above studies have achieved good performances in the human-like steering control of autonomous vehicles. However, an essential problem is that every driver has his/her driving habits and driving style, and driving habits and driving style are not very stable, which are easily affected by the external environment or internal factors. How to find the common characteristics of a certain kind of driver in normal conditions and combine them with the steering system of an actual autonomous vehicle to establish an easy-to-use steering control model is the problem that this study wants to solve.
Therefore, we first recruited 20 experienced drivers (mainly considering age, driving experience, and occupation) and carried out a real vehicle experiment on six curves (each curve consists of one circular curve segment and two straight line segments) with different lengths and curvatures, and collected driving data, including vehicle speeds, trajectories, and steering wheel angles. Then, the Frenet frame
25,26
was used to process the collected driving data. It was interesting to observe that the steering wheel angles of experienced drivers on the curved roads can be considered as a polygonal line. What is more, the shape enclosed by this polygonal line and the coordinate axis is a trapezoid. After considering the free play
27
of a real car’s steering system, the feature points (refer to the points where the steering wheel angles change in the trapezoidal steering wheel angle (TSWA) model) and feature distances (refer to the distances between feature points) were defined, and the TSWA model was established through backpropagation neural network (BPNN). The performance index and comparisons with MPC and single-point driver model showed that the proposed TSWA model can best reflect the steering maneuver characteristics of experienced drivers. At last, the steering wheel angle was tracked based on the existing electric power steering (EPS) system on the vehicle to realize human-like driving on the curve. The contributions of this article include the following: We conduct comprehensive field experiments with 20 participants and collect extensive data under different vehicle speeds to find the common characteristics of experienced drivers driving on curved roads. Considering the free play of a real car and carefully observing the change law of steering wheel angles in the Frenet frame, we establish the TSWA model with the inputs are vehicle speeds at four feature points and road curvature and the outputs are feature distances and feature steering wheel angle through BPNN. The comparisons between TSWA model, experienced driver, MPC, and single-point driver model show that the TSWA model is the steering control model with the best human-like effect. Benefit from the concise expression of the TSWA model, the steering wheel angles are tracked based on the EPS system with high accuracy at different vehicle speeds, which enables autonomous vehicles to realize human-like driving on curves.
The remaining article is organized as follows. The second section introduces the details about the real car field experiment for driving data collection. Experimental results of vehicle speed and steering wheel angle are presented in the third section. In the fourth section, we develop a TSWA model and validate its effectiveness. The simulation of steering wheel tracking based on the EPS system is depicted in the fifth section. Finally, concluding remarks are made in the sixth section.
Real car field experiment
To collect the driving data (including steering wheel angles, vehicle speeds, and trajectories) of experienced drivers on curved roads and further develop the TSWA model, a real car field experiment is conducted on six curves with different lengths and curvatures.
Participants
The subjects of this study are experienced drivers. So, 10 taxi drivers, 5 bus drivers, and 5 driving instructors are recruited as the representatives of experienced drivers. 28 Table 1 illustrates the average age, gender, driving experience, and annual vehicle kilometers traveled (AVKT) of all the participants.
Details of the 20 experienced drivers.
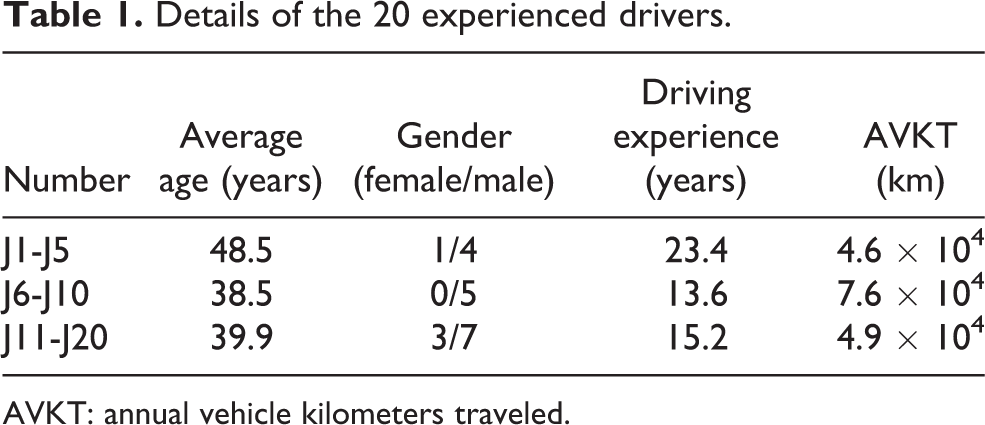
AVKT: annual vehicle kilometers traveled.
Among the participants, 4 are females and 16 are males, and the average age is about 41.7. The average driving experience is about 16.8 years, and the average AVKT is 4.5 × 10⁴ km/year. The relatively high age, rich driving experience, and long AVKT make experienced drivers not only have good driving abilities but also have relatively stable driving styles. 29 Because of this, we set four specified vehicle speeds (20, 30, 40, and 50 km/h), and the specified speeds are common driving speeds on urban roads. Before each run, experienced drivers are informed about the required speed and they are asked to keep this speed as much as possible. Experienced drivers drive on each moving direction (each experimental road has two moving directions) five times under four specified vehicle speeds, respectively. When experimenting, the weather conditions are good and the participants are in good physical and mental condition. The above considerations ensure that the collected vehicle speeds, trajectories, and steering wheel angles are the real driving data of experienced drivers under normal conditions. Li et al. 28,30 illustrated the detailed process of the experiment.
Experimental roads
The 6 two-lane experimental roads are shown in Figure 1.

Test fields with 6 two-lane experimental roads.
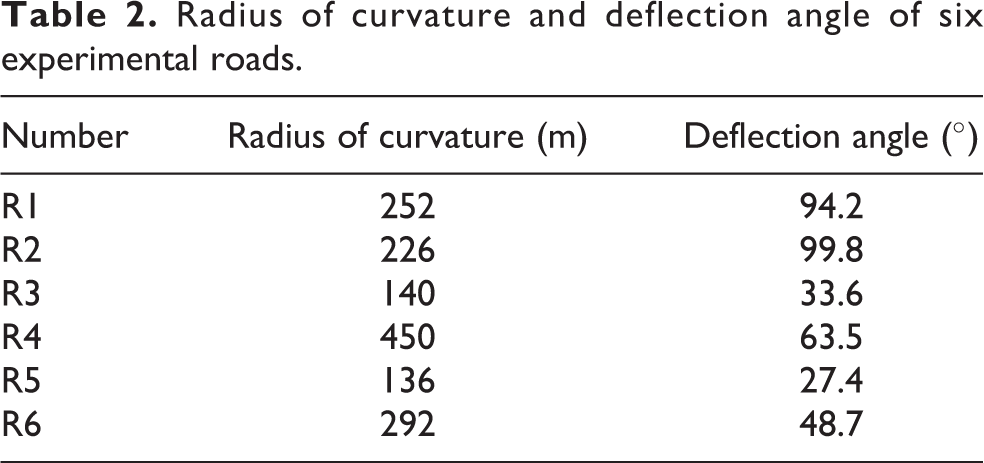
Each road can be approximately regarded as consisting of one circular curve segment and two straight segments and the experimental roads are all common urban curves. Table 2 presents the radius of curvature (denoted as r) and deflection angle (denoted as α) of the circular curve segment of each experimental road.
Radius of curvature and deflection angle of six experimental roads.
Experimental car and apparatus
In our study, one Honda Accord is used as the experimental car. A differential global positioning system (DGPS) and an integrated positioning system (INS) are installed on the top of the experimental vehicle (as shown in Figure 2). A measurement steering wheel (MSW) is mounted on the steering wheel of the original vehicle. 28

Experimental vehicles and DGPS/INS. DGPS: differential global positioning system; INS: integrated positioning system.
The vehicle speeds, trajectories, steering wheel angles, and sampling time are collected through the apparatus. The acquisition accuracy of the DGPS/INS is ±0.01 m; the type of MSW is Kistler CMSWB, the measurement range of steering angle is ±1250°, and the accuracy of MSW is ±0.1°. 30 The sampling frequency of all the apparatus is 20 Hz.
Experimental results
After finishing the real vehicle experiments, a lane-dependent Frenet frame is used to process the origin driving data (as shown in Figure 3). In the Frenet frame, the longitudinal component (termed as station) is alone separation line of the road and the lateral component (termed as lateral position) is along lane normal vector. For example, Si is the projected point of the point Pi . With the Frenet frame, we can map the collected time-series data to the specific locations on the road, making it easier to find the driving rules of human drivers at different positions of the curve. To distinguish the inside and outside lanes, it is specified that when the steering wheel is turned clockwise, steering wheel angle, vehicle speed, and lateral position are positive, otherwise, they are negative.

GPS sampling points in the Frenet frame. GPS: global positioning system.
Vehicle speed
During the experiments, experienced drivers are required to drive at four specified speeds, because we want to know how the steering wheel angles change under different vehicle speeds. Figure 4 shows one experienced driver’s vehicle speeds, and the mean value of vehicle speeds (

Vehicle speeds of one experienced driver under four specified speeds.
Since the actual amount of vehicle speed data is too large, we only present the vehicle speeds on experimental road R1 in Table 3.
Vehicle speeds on experimental road R1.

SD: standard deviation.
For illustration purposes, we define


where
From Table 3, it can be seen that experienced drivers can maintain vehicle speeds at a relatively small range, which basically meets the requirements of the experiment. Similar results are found on other experimental roads.
Steering wheel angle
Through the Frenet frame, it is convenient to observe the variation of the steering wheel angles along the road. Figure 5 presents three experienced drivers’ steering wheel angles on experimental road R2.

(a–c) Steering wheel angles of three experienced drivers under four specified speeds.
The first thing to note is that the steering system of a real car has free play. Steering free play is when the steering wheel can be moved back in forth in your hands, but the vehicle is not steering 31 (as shown in Figure 6). For the experimental vehicle used in this study, the amount of steering free play is about 4°–5°. It means the steering wheel is turned when the vehicle enters and exits the curve, but the front wheel does not rotate. Therefore, the steering wheel angles of these two places (① and ⑤ in Figure 5(c)) can be simplified into two straight lines with an amplitude of 0°.

Steering free play of a real car.
Secondly, due to the existence of complex factors, such as personality, emotion, and environment, even four specified speeds are set during the experiment, it is difficult to express the steering wheel angles of experienced drivers on the curved roads with a unified function. However, the changing trend of steering wheel angles is consistent because of the constraints of structured roads. So, the steering wheel angles of experienced drivers on the curve can be simplified as a polygonal line (②, ③, and ④ in Figure 5(c)). The same results are found in other experienced drivers’ steering wheel angles.
TSWA model
According to the above findings, the steering wheel angles of experienced drivers on the experimental roads can be considered as a polygonal line. The shape enclosed by this polygonal line and the coordinate axis is a trapezoid, so a TSWA model is established in this section.
Feature points
For the TSWA model, the positions where experienced drivers start and stop turning the steering wheel and the steering wheel angles on the circular curve segment are very important, because these parameters reflect the driving characteristics of different drivers. For illustration, six important points are defined in Figure 7.

Schematic diagram of trapezoidal steering wheel angle model.
To obtain a uniform expression of feature points for different road lengths, we also define four feature distances

where L
1, L
2, L
3, and L
4 are the four feature distances,
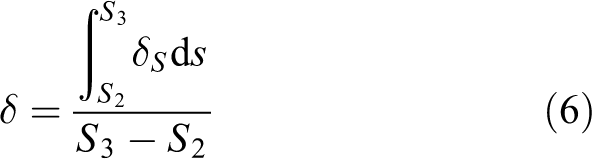
where

Part of the feature distances on experimental road R3. (a), L 1 (b), L 2 (c) L 3, and (d) L 4.

Part of the feature steering wheel angles on experimental road R3.
It can be seen from Figures 8 and 9 that the distributions of feature distances and feature steering wheel angles are very scattered, which makes it difficult to find the change rule of experienced drivers’ steering maneuver. Similar results are found on other experimental roads.
Data-driven model
In fact, due to the complex and changeable traffic environment and different driving habits of different drivers, it is difficult to develop a model of feature distance and feature steering wheel angle with traditional methods. However, the establishment of such a complex nonlinear model can be implemented with the development of data-driven modeling methods (e.g. NNs). Based on a large number of real vehicle data, BPNN is used to build the TSWA model. The hyperparameter settings are illustrated in Table 4.
Hyperparameters of BPNN model.

BPNN: backpropagation neural network; NN: neural network.
The inputs of BPNN model are road curvature (

where
Prediction performances of the BPNN model.

BPNN: backpropagation neural network; RMSE: root mean square error.
The prediction performances show that with the increase in the number of hidden layers, the value of RMSE generally decreases. What is more, the minimum RMSE of the BPNN model with three hidden layers is 0.65 and the maximum value is 1.01. It means that even a relatively simple NN is used in our study, it can achieve good prediction results.
Comparisons of steering wheel angles
To compare the differences between steering wheel angles of different models, MPC, single-point preview driver model, and TSWA model are, respectively, used to generate steering wheel angle sequences on the same curved road (experimental road R5) and at the same vehicle speed (30 km/h). The lane centerline is used as the reference trajectory in MPC and the single-point preview driver model.
For MPC, the input is steering wheel angle
Parameters for MPC.

MPC: model predictive control.
As for the single-point preview driver model, we select two commonly used preview time (tp ), and the neuromuscular delay time (td ) and reaction time of the driver (tr ) are also considered (as given in Table 7). The details of single-point preview driver model and optional range of parameter values can be referred in the literature. 35
Parameters for single-point preview driver model.

Figure 10 shows the comparison results of different models: Figure 10(a) shows the simulation results of MPC and Figure 10(b) shows the steering wheel angles of the single-point preview driver model.
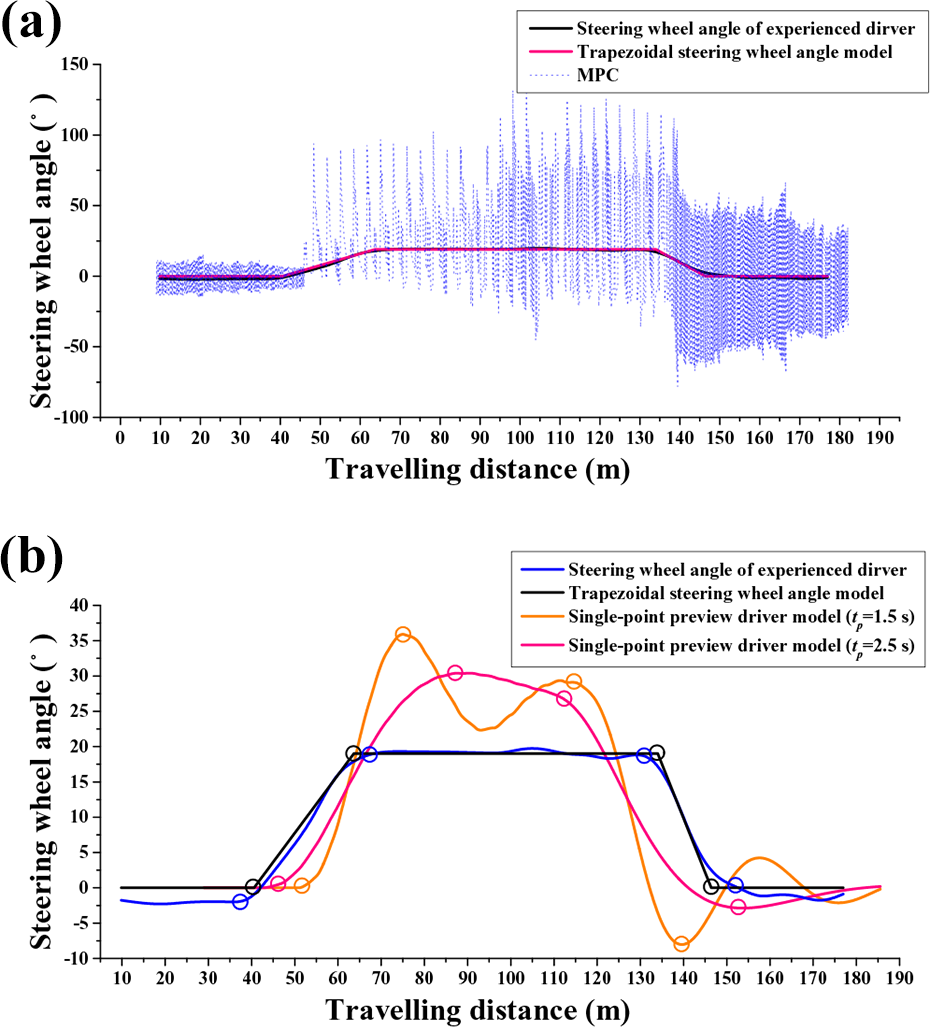
(a, b) Comparisons of steering wheel angles generated by different models.
From Figure 10(a), it can be seen that the changes of steering wheel angles in MPC have serious buffeting. It is obvious that the steering wheel angles generated by MPC have no similarities with the changing rules of the steering angles of the experienced driver. Compared with MPC, the steering wheel angles generated by the single-point preview driver model are more similar to those of the experienced driver. However, from the feature points (as shown in Figure 10(b)) of the steering wheel angle sequences, it can be seen that the position of the single-point preview driver model in entering or leaving the curve and the steering wheel angles in the curve are different from those of the experienced driver. What is more serious is that, with different preview time, the feature points of the steering wheel angle sequence change greatly. It is difficult to use a single-point preview driver model to characterize the steering wheel angles of experienced drivers.
Figure 10 also shows that the proposed TSWA model can best reflect the steering features of experienced drivers, especially for the feature points of the steering wheel angles of experienced drivers. What is more, the concise expression and human-like characteristic of the TSWA model make it easy to realize human-like steering control for autonomous vehicles.
Steering wheel angle tracking
After the TSWA model is established, the steering wheel angles are tracked based on the EPS system to realize human-like driving on the curve.
Vehicle model
A simplified two degrees of freedom vehicle model (i.e. bicycle model) is used in this study (as shown in Figure 11). It should be noted that to be closer to the real car, we built a nonlinear bicycle model.

Simplified two degrees of freedom vehicle model.
The dynamic model in the vehicle coordinate system is depicted as


where
The sideslip angles of the front and rear wheel are calculated as


where
The motion of CG in the inertial coordinate system


where
The lateral forces of front and rear wheels are given by Magic formula

where D, C, B, and E represent fitting constants. When y is
Vertical forces are needed in the calculation of D, B, and E


where
EPS system
In this study, the column type EPS is modeled and its schematic diagram is shown in Figure 12. Different from the traditional EPS system, in the process of automatic steering, human driver’s hands leave the steering wheel, that is, there is no driver’s hand force as input in the system, and the motor drives the front wheel to rotate directly through the transmission system. 34

Schematic diagram of the EPS system. EPS: electric power steering.
The equilibrium equations of reduction mechanism is

where Je
denotes the moment of inertia of the output shaft of reduction mechanism, Js
denotes the moment of inertia of steering wheel and column, Be
denotes the damping coefficient of the output shaft of reduction mechanism, Bs
denotes the damping coefficient of steering column,
The equilibrium equation of rack and pinion is

where Mr
denotes the equivalent mass of pinion and rack, Br
denotes the damping coefficient of pinion and rack, xr
denotes the rack displacement, Fr
denotes the axial force exerted by the steering resistance on rack, Ff
denotes Coulomb friction on rack (
The torque acting on front wheel is

where Jf
is the moment of inertia of the front wheel, Bf
is the damping coefficient of front wheel, TZ
is the aligning torque of front wheel, and
Additionally, the geometric relationships between each component are
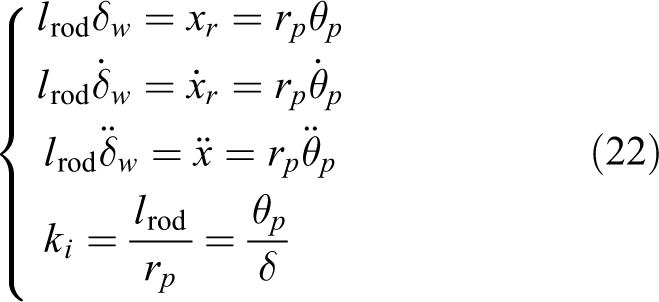
Combining equations (20) to (22), we can get


Simulation
The parameters of vehicle model and EPS system used in the simulation are given in Table 8.
Parameters used in the simulation.

According to equations (19) to (24), we conduct the simulation in MATLAB/SIMULINK (as shown in Figure 13).
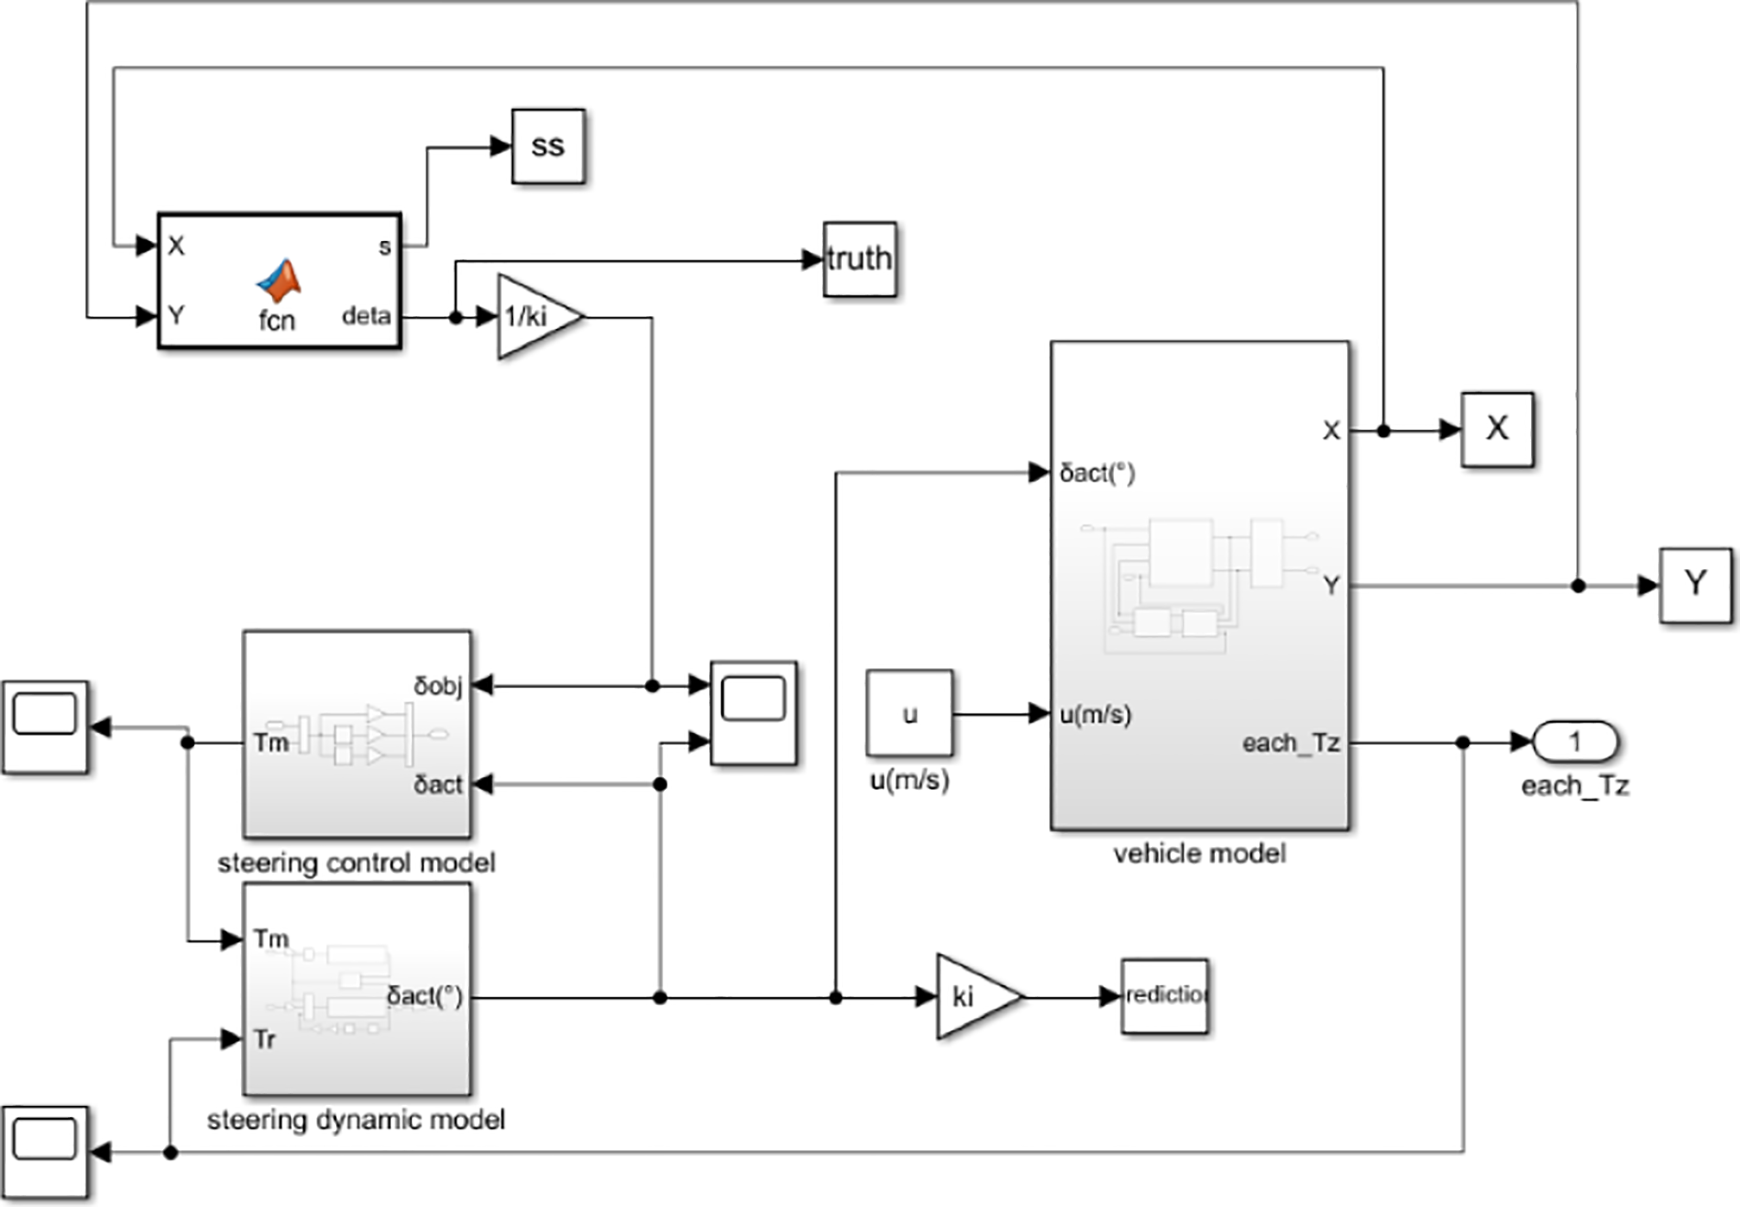
Simulation model of steering wheel tracking system.
The simulation results are shown in Figure 14. It should be noted that since the steering wheel angles generated by the TSWA model are all polygonal lines, we only use the simplest proportion–integration–differentiation (PID) control algorithm in the simulation.

Steering wheel angle tracking results.
The simulation results show that the steering wheel angle tracking effect under four specified speeds is very good. Compared with other more advanced control methods, PID controller is still a popular option in industrial field because PID has a simple structure and good stability. What is more, EPS is a device commonly equipped on cars at present, and it is very economical and applicable to deeply explore the function expansion of EPS systems in autonomous vehicles.
Conclusion
This study focused on exploring the characteristics of experienced drivers’ steering maneuvers on curved roads. Through real car field experiments, we collected thousands of pieces of driving data on six curved roads. One specifical point was that the participants were all experienced drivers, another specifical point was that four specified speeds were required during experiments. We made these two special settings because we wanted to study the changing rules of experienced drivers’ steering wheel angles at different speeds.
The collected driving data (including vehicle speeds, trajectories, and steering wheel angles) were processed in the Frenet frame. When processing the steering wheel angles, we also considered the free play of a real car’s steering system. In this way, the steering wheel angles of human drivers at different positions of the road can be observed intuitively, and it is also convenient to study the relationships between steering wheel angles and road curvatures. It was interesting to find that the shape enclosed by steering wheel angles and the coordinate axis was a trapezoid. A nature idea is to establish a TSWA model. After defining four feature points and four feature distances, we found the distributions of feature distances and feature steering wheel angles were very scattered, so we developed the TSWA model by BPNN. We compared the steering wheel angles generated by TSWA, MPC, and single-point driver models and the results showed the TSWA model not only had very concise expression but also can best reflect the steering maneuver characteristics of experienced drivers.
Benefit from the advantages of TSWA, steering wheel angle sequence with human drivers’ characteristics can be generated. Applying them to the steering control of autonomous vehicles is an easy way to realize human-like driving. A nonlinear vehicle model and the EPS system were established in Simulink, the steering wheel angle was tracked by the motor directly. The simulation results showed that the EPS system can track the steering angles with high accuracy at different vehicle speeds by only a simple PID controller.
What we want to emphasize is that we only consider the changing law of the steering wheel angles under normal conditions. The TSWA model also has drawbacks in practical applications. Firstly, we have only studied the steering behavior of experienced drivers under normal conditions. Secondly, all the experimental roads were free roads. This model cannot express the steering maneuver of every driver in complex traffic scenes. However, the TSWA is a basic model, and it does reflect experienced drivers’ steering characteristics on free curved roads. The third drawback is that the four specified speeds selected in this experiment are relatively low, although this is the result of considering driving safety. In the future, we will collect driving data of more drivers on more curved roads, and driving simulator is a good way of data collection at high vehicle speeds. The TSWA model also needs to be combined with the vehicle’s lateral control model to achieve human-like trajectory tracking of autonomous vehicles.
Footnotes
Declaration of conflicting interests
The author(s) declared no potential conflicts of interest with respect to the research, authorship, and/or publication of this article.
Funding
The author(s) disclosed receipt of the following financial support for the research, authorship, and/or publication of this article: This work was supported by the National Natural Science Foundation of China [Grant No. 51675235] and the Innovation Plan for Postgraduate Research of Jiangsu Province in 2014 [Grant No. KYLX1057].