
Abstract
The IEEE 802.15.6 standard emerged as the most suitable standard that fits the special requirements of wireless body area networks. It provides flexibility to designers by recommending the use of several medium access control layer techniques, but does not specify how to combine some or all these recommended techniques to form the most efficient wireless body area network medium access control for a specific scenario. Our goal here is to design a wireless body area network medium access control that provides an optimal combination of these basic techniques that are available in the standard, by taking into consideration the variability and heterogeneity of the sensors. The performance of the proposed techniques is evaluated using some of the standard performance measures such as throughput, delay, and energy consumption.
Keywords
Introduction
As both the widespread expansion of the Internet and the miniaturization and pervasiveness of all types of sensors have engendered the new paradigm of Internet of Things (IoT), with all its offspring, such as Internet of all things or Internet of everything, 1 the human body was no exception to this ubiquitousness trend. The medical, health, or well-being drives initiated equipping humans with various sensor types.2–4 This study will be bound by the network formed by the sensors and their access point. Other studies have considered the management of the generated traffic on a wider scale involving mobility and big data.5,6
Initially, regular wireless personal area network (WPAN) protocols, such as Bluetooth or Zigbee, were used as communication means. 1 However, as the human body is characterized by special properties, such as proximity and living tissues, a new communication protocol was required. The IEEE 802.15.6, also known as wireless body area network (WBAN), was conceived for this aim. 7
Due to the variability of these sensors, their applications, and requirements, three access modes were integrated at the medium access control (MAC) layer of the protocol. This concept ought to concurrently triage and treat multiple patients equipped with various medical sensors. There are many parameters in medical field to indicate vital signs.8,9
The IEEE 802.15.6 standard specification is not rigid and strict in all its clauses but left a design margin for practitioners and researchers, which will allow them to optimize the standard to specific scenarios. For time-referenced resource allocations, the time axis is divided into a series of superframes by the hub. The superframes are bounded by equalized length beacon periods. The hub selects the boundaries of the beacon period and thereby selects the allocation slots. A beacon from the hub at the beginning of each frame is broadcast with information about the structure of the frame.
In the contention-based access mode, the hub may use slotted ALOHA or CSMA/CA (carrier-sense multiple access with collision avoidance) protocols, depending on the PHY (physical layer). This category of slots is always located at the beginning of the frame, just after the beacon. This technique may be most suitable for sensors with emergency data, which is not sent on a scheduled basis but needs to be delivered immediately.
In the schedule-based access mode, the nodes send their data at fixed times of the superframe periods. Initially, it is the hub that assigns these slots to the requesting nodes. This technique is most suitable for sensors providing periodic readings of patients’ vital signs, such as temperature, blood pressure (BP), or heart rate. The polling-based access mode may be chosen if there is no need for pre-reservation or advanced notice in beacon or non-beacon modes with superframe boundaries. Once needed, the hub chooses some slots to be assigned to specific nodes from the current frame only. It then sends poll commands defining the number of slots of immediate polled access. These commands are for initiating the transactions for one data frame or more by the nodes or hub.
Our main contributions in this article are related to the customization of the IEEE 802.15.6 standard for various scenarios. First, we established a systematic mapping between body sensor types and the most suitable medium access methods to be used. Then, we specified the right parameters to be used in the contention-, schedule-, and polling-based access mode techniques of the standard for specific common scenarios. Finally, we designed a WBAN MAC that uses a combination of the three access techniques taking into consideration both the variability and heterogeneity of the sensors. A thorough performance evaluation has been conducted to validate our findings in terms of throughput, delay, and energy consumption.
The rest of the article is organized as follows: section “Related work” discusses related work, section “Model specifications” describes the proposed model, while section “Simulation results” presents and explains the simulation and results, and finally, section “Conclusion” concludes the article.
Related work
Not all WBANs have high quality of service (QoS) requirements, but most of them do require low power consumption for health monitoring, especially for outpatients or patients with implants. The first WBAN implementation did use IEEE 802.15.4 as the MAC protocol, and many studies were undertaken to evaluate its corresponding service performance.
Among these studies is the work by Choi and Zhou, 10 in which the effects of backoff parameters and different network components on the performance of unslotted CSMA/CA operation in the IEEE 802.15.4 MAC protocol were analyzed. Also in the study by Xia et al., 11 a new MAC protocol based on the IEEE 802.15.4 beacon-enabled mode was proposed to provide both reliability and real-time transmission for time-critical and delay-sensitive data in an environment such as WBAN.
After similar studies have been conducted in evaluating the performance of IEEE 802.15.4 in WBAN environment, a consensus was reached, by practitioners as well as researchers, that the current standard needs many improvements. This has led finally to the creation of a separate IEEE Standard for local and metropolitan area networks—Part 15.6: Wireless Body Area Networks. 8
The standard was originally established through a set of research works and is still undergoing continuous studies and improvements. For instance, in the study by Ullah and Kwak, 12 some numerical formulas were derived to determine the throughput and delay limits of IEEE 802.15.6 networks operating in an error-free channel. New mechanisms were also proposed to improve IEEE 802.15.6 MAC such as those in the studies by Lu et al.13,14 In the study by Lu et al., 13 the performance of the existing polling mechanism was studied for possible improvement, and it was suggested to include the poll message inside the acknowledgment (ACK) packet. In the study by Lu et al., 14 a coexisting mechanism was proposed to mitigate the co-channel interference of WBAN, while in the study by Boulis and Tselishchev, 15 the trade-offs created when combining two MAC techniques in IEEE 802.15.6, contention-based access and polling-based access, were investigated.
In the study by Jung et al., 16 the performance of the IEEE 802.15.6 WBAN MAC protocol was evaluated in terms of throughput, power consumption, and energy efficiency under unsaturated conditions. A discrete-time Markov chain model was developed and used to evaluate the performance of the CSMA/CA-based WBAN MAC protocol during contention access phases. Both the numerical and simulation results showed that there was an optimal number of nodes that may minimize the power consumption for certain user priorities. However, the energy efficiency always decreased as the number of nodes was increased. Moreover, the throughput and energy consumption increased in the case of higher priority nodes as the packet arrival rate was increased, while in the case of the lower priority nodes it decreased.
Other research studies, such as Al Ameen et al., 17 proposed a MAC protocol for WBAN to control the communication in implant devices. Normal traffic was handled using predefined wake-up table, while emergency and on-demand traffic were handled using a special wake-up signal. It was concluded that the proposed method was efficient in terms of both energy consumption and delay.
Rezvani and Ghorashi 18 improved the performance of the MAC protocol of WBANs using an adaptive resource allocation and traffic prioritization according to the medical situation (normal or emergency) of user and channel condition (presence or absence of fading).
In a more recent work, 19 the authors proposed a new MAC protocol for WBANs solely based on polling only. Furthermore, it defines a dynamic priority for the sensors based on their current sampling rates as well as on an estimate of the volume of pending data to be read in each sensor. The main objective being to avoid loss of data.
Similarly, Ullah et al. 20 proposed a new priority-based MAC protocol but that uses contention only and realizes various node priorities using the CSMA/CA backoff parameters depending on the user requirements. They derived an analytical model assuming an error-prone channel with saturated traffic conditions.
In the study by Bradai et al., 21 which has the essence of this study, the performance of the IEEE 802.15.6 MAC protocol was evaluated and compared to that of TMAC and IEEE 802.15.4. It was concluded that the three combined basic MAC protocols in 802.15.6 perform better in delay and throughput.
The effects of combining two of the MAC techniques on the network access performance and the energy cost were also studied by Boulis and Tselishchev. 15 Some results of combining the three techniques were reported in the study by Al-Mazroa and Rikli, 22 with the addition of a third MAC technique, namely schedule-based access. This work is similar to the study by Boulis and Tselishchev, 15 and it builds and extends on the study by Al-Mazroa and Rikli. 22 We conducted an in-depth study of how the combinations of these techniques affect the performance of various medical sensors carried by a hospitalized patient with some chronic diseases as shown in Table 1.
Comparison between our proposed work and the existing work.

MAC: medium access control.
Model specifications
The WBAN to be considered in this study consists of a number of medical sensors attached to a patient with BP. The chosen sensors may be classified into three categories according to the undertaken monitoring function.
Medical sensors
The considered setup was selected based on many consultations with professional medical personnel. The most important vital signs of a patient are body temperature, BP, heart rate, and electrical activity of muscles. A suitable medical sensor may be used to each one of these signs, namely, body temperature, BP sensor, electrocardiogram (ECG), and electromyogram (EMG). In a hospital, according to the severity of the patient state, he or she may be located in one of the following units: intensive care unit (ICU), step down, or general floor.
The data collected are summarized in Figures 1 and 2. Figure 1 shows the names and locations of the considered diseases and Figure 2 their severity and the sensors used.

Mapping between disease names, their symbols, and locations in the hospital.
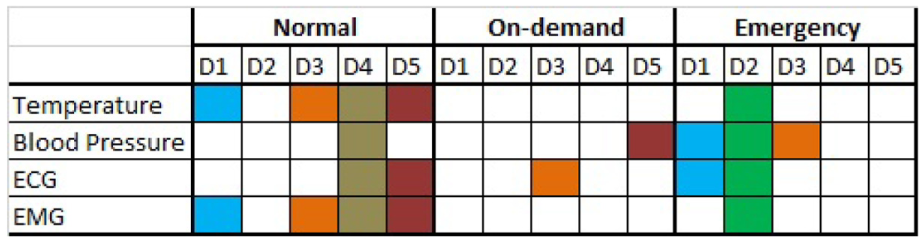
Mapping of four medical sensors to their type of operation for five diseases.
The mode of operation of the sensors may be divided into three categories:
Normal. These sensors are used in normal situations at which the patient state being monitored is not time critical. Nevertheless, continuous routine health monitoring of the patient is required. Scheduled access mode is the most suitable technique for this kind of function. In scheduled, the protocol standard allows the nodes to send requests to the hub to get permission to access specific slots freely, in every frame. Once they receive permission, the nodes consider the superframe periods as their wake-up periods.
On-demand. In this case, the requests are initiated by the coordinator, or the doctor, and are sent to the sensors to reply with the specific information about the patient state. Generally, these are done for the purpose of diagnosis and prescription. Polling access mode is the most suitable technique for this kind of function measure. It was chosen because there is no need for pre-reservation or advanced notice in beacon or non-beacon modes with superframe boundaries. It is the hub which chooses the slots, from the current frame only, to be assigned to some specified nodes.
Emergency. The transmission requests are initiated here by the sensors when the monitored health state exceeds a predefined value. Clearly, this kind of requests is unpredictable and cannot be generated in regular intervals. Thus, contention access mode is the most suitable technique for this traffic. Specifically, in our case, CSMA/CA is used for sending high-priority data frames in such emergency situations.
The mapping between the severity or mode of operation of the sensors and the access mode to be used in the protocol is shown in Figure 3.

Mapping between sensor types and access methods.
To conduct our experiments, we have selected the following medical sensors to represent each one of the previous three categories. The sensors are as follows:
Body temperature—a sensor to record the core body temperature from the right arm of the patient;
BP—a sensor to record the BP of the patient from his left arm;
ECG—records the electrical activity of the heart, and it is located on the chest of the patient’s body;
EMG—evaluates and records the electrical activity produced by the patient’s body muscles, and it is located on the left and right legs.
WBAN setup
The WBAN to be considered in our simulation model consists of five sensors and one coordinator as described in Table 2 and shown in Figure 4. Two sensors are located on the arms, two on the legs, one on the left chest, and the coordinator on the right lower abdomen.
Network parameters.

EMG: electromyogram; ECG: electrocardiogram.

Placement of the body sensors on the patient.
WBAN PHY specifications
The physical radio model is similar to the one used in SMA-WiBAN, 23 in which the specifications were taken from previous studies.24–28 The most important parameters chosen in our model are as follows:
data rate = 1024 Kbps;
receiver sensitivity = −87 dBm;
transmission power = −10 dBm;
transition time between receiving RX and transmitting TX = 20 µs;
slot allocation length = 10 ms;
number of allocation slots in a beacon period = 32;
five sensors and one coordinator, with their corresponding specifications, as shown in Table 3.
Sensor PHY parameters.

PHY: physical layer; BP: blood pressure; TEMP: temperature; ECG: electrocardiogram; EMG: electromyogram.
Simulation results
A simulation model was built for the proposed system using the Castalia simulation tool, which is based on the OMNeT++ platform. 29 The simulation model is for a WBAN system with sensors attached to a patient with BP, as shown in Figure 4. Three sets of experiments were conducted to analyze the performance of the system under various protocol combinations, as well as the effects of changing the basic sensor setup.
Effects of slot distribution
In this first experiment, the change in slot distribution in the three accessing techniques is investigated. Using our WBAN model, the slot assignment was set as follows:
Polling—fixed at one slot;
Scheduled—varied from 2 to 10, for the three nodes (2, 3 and 4);
Contention—varied from 1 to 25.
These slot distributions were varied under the constraint shown in equation (1). This must be satisfied in all considered cases.

Then, the simulation was run for a duration of 50 s, each time with a different traffic rate generated by the sensors. The three considered rates were as follows:40, 80, and 120 packets/s/node.
Transmission states
The corresponding results are shown in Figure 5. The contention–scheduled slot combination varies in the horizontal axis of each graph. The number of contention slots starts from 1 on the left to 25 on the right, with increments of 3 slots, while the number of scheduled slots starts from 10 on the left to 2 on the right, with decrements of 1 slot. The vertical axis shows the composition of the traffic carried over the network in different colors. Five types are shown as follows:
Fail, buffer overflow—represents packets that are dropped due to a buffer being full;
Failed, channel busy—represents packets being dropped because they reached the maximum retry limit;
Failed, no ACK—represents packets being dropped due to a lost ACK or the transmitted packet did not reach the destination;
Success, first try—represents packets transmitted successfully by the first trial;
Success, two or more tries—represents the packets transmitted successfully but not by the first try.
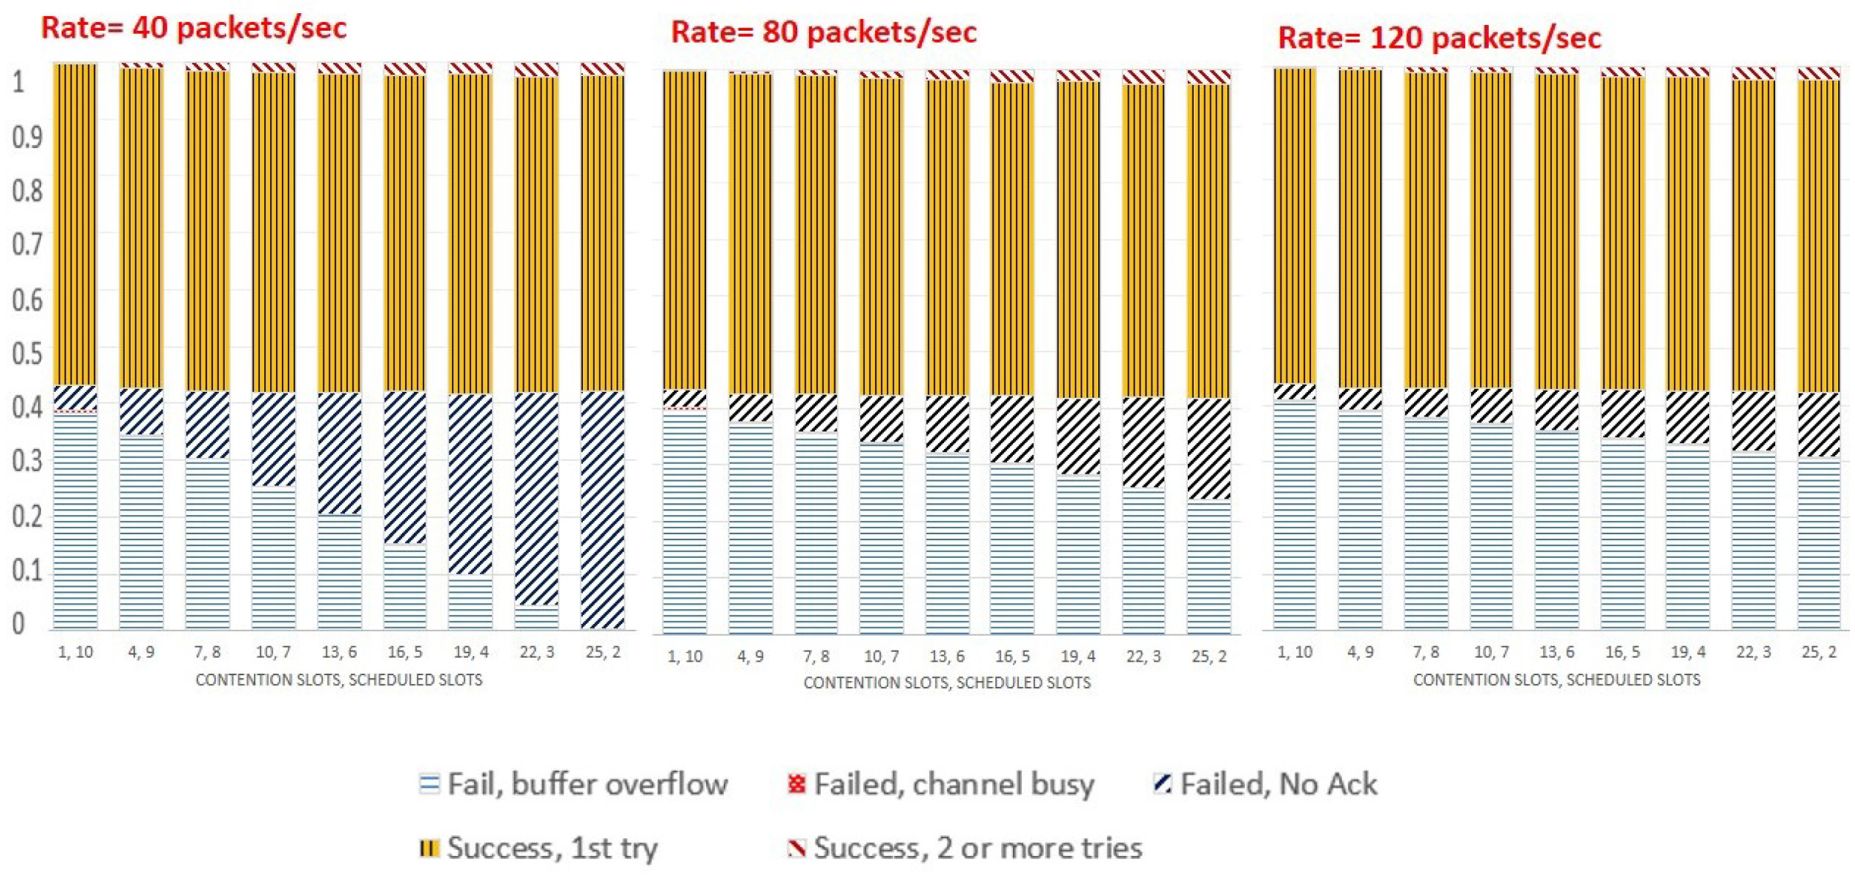
Effects of slot distribution on data packet outcome breakdown.
Note that the sum of all bars always adds up to 100%. This allows us to show the relative distribution of the packets. The following remarks may be observed:
The success from the first try was almost constant around 57%.
The success after more than one try starts very close to zero and then increases steadily as the number of contention slots increases, but stays below 2%.
The most important part is in the constituency of the packets being dropped. As the number of contention slots increases, more packets are being dropped due to either lost packets or ACKs, and less packets are dropped due to buffer overflow. Furthermore, as the traffic intensity is increased this trend weakens as most drop is due to buffer overflow. Contention has considerable overhead from sensing the channel. With the contention algorithm chosen by the baseline MAC, a node can take at least as much time sensing a clear channel as transmitting the packet itself. When the traffic is high, this waste of resources clearly outweighs any other advantage contention has.
The channel busy failure was minimal in all graphs (not visible); it is around 1/100 of buffer overflow failure.
Delay
The latency of successful packet was measured through the end-to-end delay, as shown in Figure 6. The same packet generation rates used in the previous case are used here as well. In this case, the x-axis represents the delay intervals, starting with delays from 0 to 20 ms and ending with delays between 220 and 240 ms. The y-axis represents the percentage of packets that fall in the respective delay interval. For each delay interval, the performance is shown for five (contention, scheduled) combinations, namely: (1, 10), (7, 8), (13, 6), (19, 4), and (25, 2).
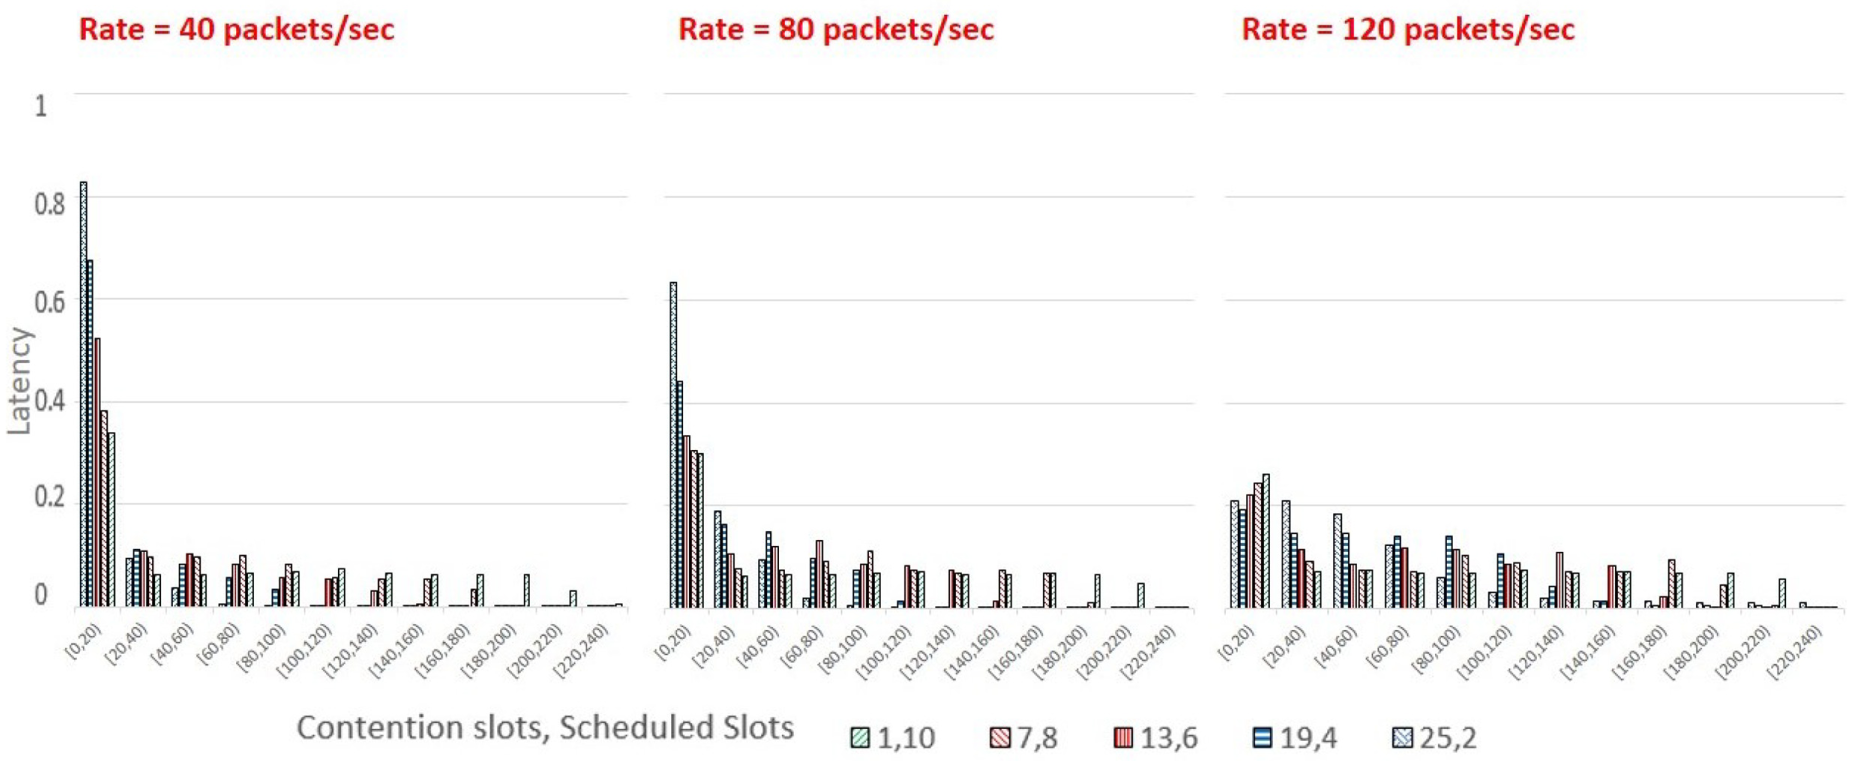
Effects of slot distribution on packet latency.
By inspecting these results, the following remarks may be observed:
For the rates of 40 and 80 packet/s/node, it may be noticed that around 83% and 63%, respectively, of the packets received were under 20 ms. Furthermore, the best performance was obtained with the combination of 25 contention slots and 2 scheduled slots.
However, for the rate of 120 packet/s/node, it can be noticed that only 26% of the packets received were under 20 ms and that the best performance was obtained with the combination of 1 contention slot and 10 scheduled slots.
Consumed energy
Figure 7 shows the average energy consumption in joules per sensor as the slot distribution for contention versus scheduled is changed from 1–10 to 25–2. It may be noticed that as the number of slots used by the contention sensors increases, the consumed energy also increases. Indeed, the energy increased by 36% when the number of contention slots went from 1 to 25. The reason for this being that the sensor of type Contention will need more time to sense the channel and send the packet as the contention time increases, which will consequently require more energy. This means that having a smaller number of contention slots and a larger number of scheduled slots is better for the consumed energy performance.

Effects of slot distribution on consumed energy.
Effects of traffic intensity
Using our WBAN, we focus now on the effects of changing the rate when the slot distribution is kept fixed. Using the results from the previous section, we have chosen three-slot combinations as shown in Table 4.
Three-slot combinations.

The simulation was run for 50 s. Figure 8 presents the results of data packet breakdown for these three cases ((a) for maximum, (b) for medium, and (c) for minimum). On the horizontal axis of each graph, the data rate is increased from 20 to 140 packets/s/node with increments of 20 packets/s/node. The vertical axis shows the breakdown of various traffic categories that may occur during packet transmissions.
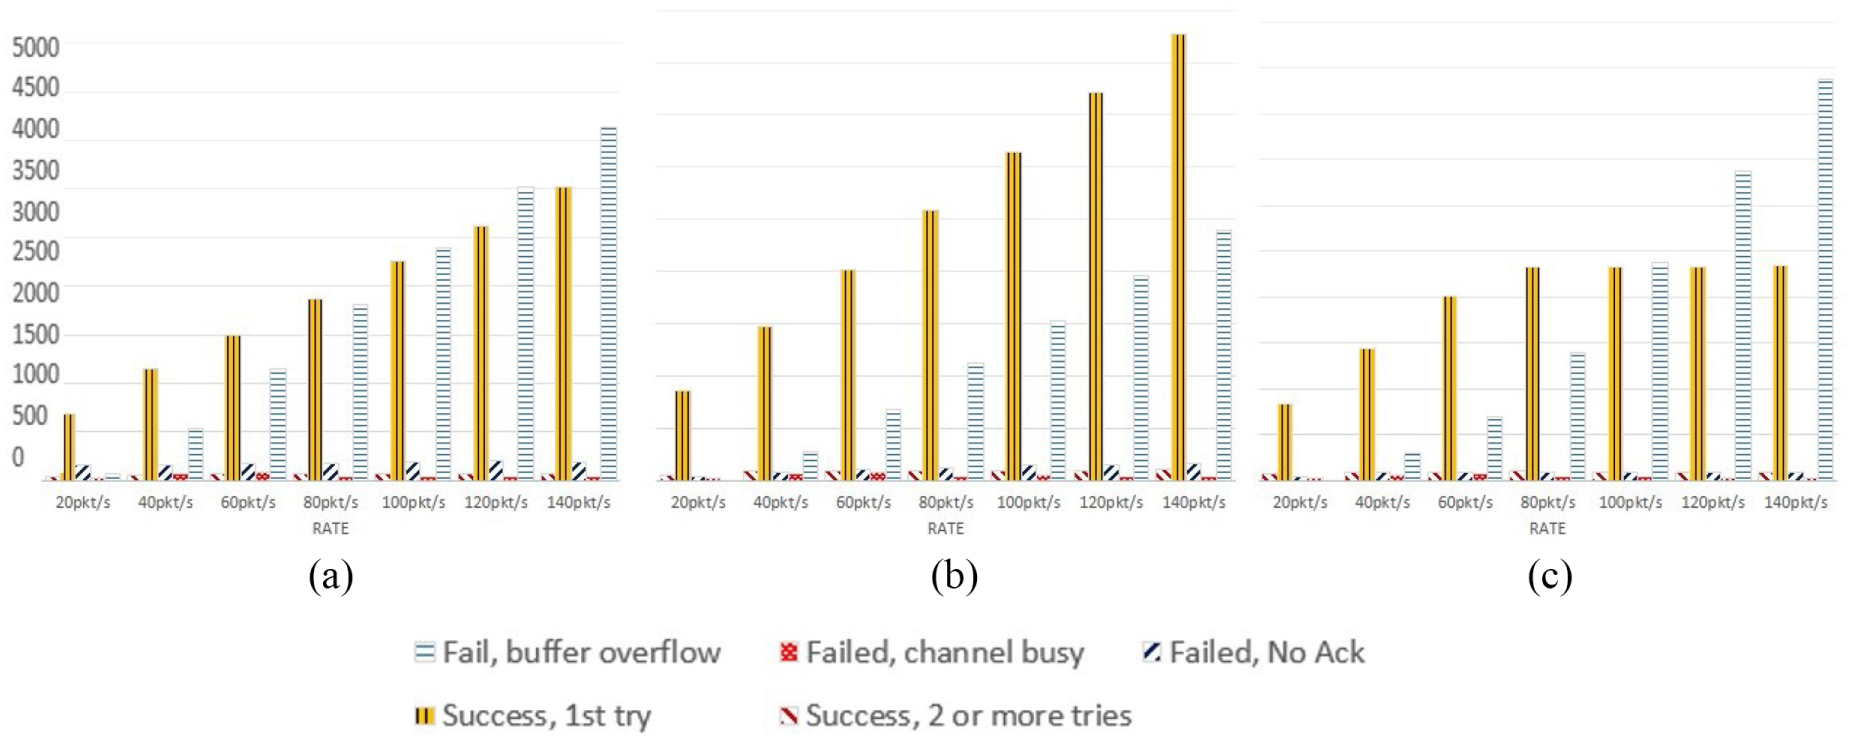
Data packet outcome breakdown of traffic intensity: (a) maximum: 10 scheduled, 1 contention; (b) medium: 6 scheduled, 13 contention; and (c) minimum: 2 scheduled and 25 contention.
We need to stress here that in the following graphs, the actual number of packets is shown instead of only the percentages as was the case in Figure 5. By observing the graphs, the following remarks may be drawn:
Failure due to the buffer overflow: Significant in most cases; Increased as the data rate increased; The highest was with 140 packets/s/node: 3600 packets in (a), 2300 in (b), and 4300 in (c), which is not monotonic with the increase in the contention slots.
Number of successes: Significant in most cases; Increased as the data rate increased; The minimum was with a data rate of 20 packets/s/node: 10% in (a) and 13% in both (b) and (c); The maximum was with a data rate of 140 packets/s/node: 44% in (a), 62% in (b), and 35% in (c), which is not monotonic as the failure rate but in the opposite direction.
For medium to high data rates, the medium case (b) is the best option in terms of delivering more packets with less failure: for a data rate of 80 packets/s/node or higher, it is better to use 13 slots for contention and 6 slots for scheduled;
For low data rates, the minimum case (c) is the best option in terms of delivering more successful packets: for a data rate of 60 packets/s/node or less, it is better to use 25 slots for contention and 2 slots for scheduled.
Effects of the number of sensor nodes
We are considering a basic setup of sensors, as shown in Table 5. The effects of adding one, two, or three sensors of certain type while keeping the total number of slots assigned to all sensors of the same type constant, is studied. This is carried out for each one of the three access modes (BP for contention, Temp for scheduled, and ECG for polling). Then, the effects of adding a sixth sensor from each type are compared. In each case, the performance measures to be considered are as follows: the breakdown of the number of failed and successful packets and the average latency per packet.
Basic setup characteristics of five sensors.

BP: blood pressure; Temp: temperature; EMG: electromyogram; ECG: electrocardiogram.
Contention-based sensors
In this scenario, a BP sensor, with contention access mode, is added next to the previous ones to make the total number of BP sensors two, three, and then four (and all sensors: six, seven, and then eight). In each case, the total number of slots assigned to all BP sensors is kept constant and is distributed as shown in Table 6.
Slot distribution of BP sensors.

BP: blood pressure.
After running the three simulations, some of the performance measures were taken. First, the dropped packets were checked. Figure 9 shows the number of dropped packets, in which the number of sensors is in the horizontal axis starting from five, in the basic model, to eight, with an increment of one sensor each time, and the vertical axis shows the number of dropped packets. The number of dropped packets increased steadily as the number of sensors that have contention access mode increased. This occurred because addition of one more contention leads to more traffic that induces more overhead on sensing the channel that causes more packet dropping. In comparison with the basic model, there was an increase of around 340 dropped packets with six-sensor, 601 packets with seven-sensor, and 811 packets with eight-sensor network.
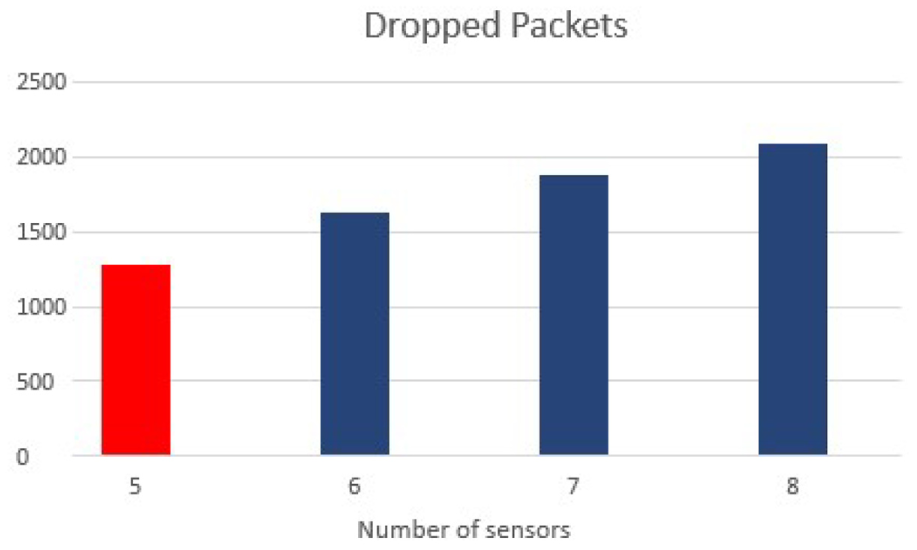
Dropped packets when increasing contention access.
Then, the data packet outcome breakdown has been checked, as shown in Figure 10. The breakdown consists of packets that failed to be transmitted due to buffer overflow and packets that are transmitted successfully from the first trial. The horizontal axis is as in the previous figure, and the vertical axis shows the number of packets. The number of failed packets increased linearly from 1115 to 1930 packets, and the successful ones decreased linearly also from 2593 to 1772 packets, when the number of sensors that have contention access mode increased.

Data packet breakdown when increasing contention access mode sensors.
Finally, the latency is studied in Figure 11. A histogram is used to show the end-to-end delay of successful packets when increasing the number of sensors that have contention access mode from 5 to 8. Around 2250 packets were received with a delay under 20 ms in the five-sensor case, while in eight-sensor case it decreased to around 2100 packets. This means that the latency is getting a little bit worst when the number of sensors of contention access mode is increased. This is due to the fact that adding more contention sensors produces overhead in sensing the channel that requires more time for the packets to be transmitted across the network from source to destination.
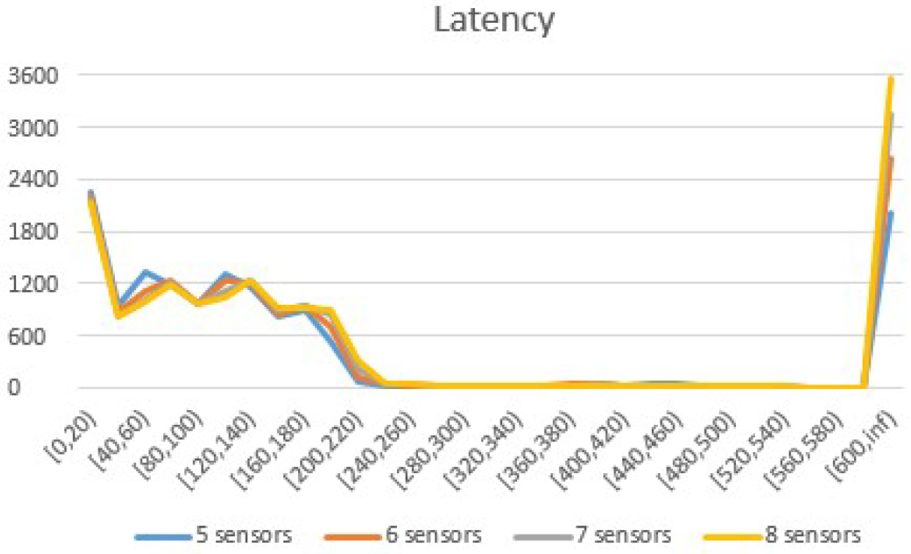
Latency when increasing contention access mode sensors.
Schedule-based sensors
First, we put a second temperature sensor which has scheduled access mode and locate it next to the previous one, so that we get a total of six sensors (seven nodes with the hub). Then, we put the third temperature sensor and locate it next to the previous one, so that we get a total of seven sensors (eight nodes with the hub). Finally, we put the last temperature sensor and locate it next to the previous one, so that we get a total of eight sensors (nine nodes with the hub). The slots are distributed as shown in Table 7.
Slot distribution of temperature sensors.

Temp: Temperature.
After running the aforementioned three simulation scenarios, some of the performance measures were taken. We first have checked the dropped packet when increasing the number of schedule-based access mode sensors from five sensors (basic model) to eight, as shown in Figure 12.

Dropped packets when increasing scheduled access mode sensors.
In comparison with the basic model, the number of dropped packets decreased in six-sensor network by around 150 packets and around 64 packets in seven-sensor network. However, the dropped packets increased again by around 265 packets, in comparison with the basic model. This means, adding one more sensor of schedule-based access mode performs much better in terms of dropped packets and adding two more performs better but not as much as one sensor, but adding three performs badly. This happened because as the number of scheduled increases from 1 to 2, the number of dropped packets due to buffer overflow increases, which leads to a decrease in dropped packets due to channel busy. The net result is a decrease in the total dropped packets. Then, it increases again when adding more because there are more buffer overflow and no ACK failure.
So, we can conclude that increasing the number of sensors that have schedule-based access mode does not always perform badly in terms of dropped packets, and it depends on the number of sensors added.
Then, in Figure 13, the outcome of data packet breakdown of the number of packets that failed due to buffer overflow and the ones that were successful from the first trial was checked. We may notice that when the number of sensors that have scheduled access mode is increased, the failure rate increases and then decreases again, while the successful rate decreases and then increases again. This means that increasing the number of sensors that have scheduled access mode does not always perform badly in the outcome of data packet breakdown; it depends on the number of sensors as mentioned in Figure 12.

Data packet outcome breakdown when increasing scheduled access mode sensors.
Finally, the latency performance is shown in Figure 14. As the number of sensors with scheduled access mode is increased, around 2250 packets are received with a delay under 20 ms in the case of five sensors, and only around 1370 packets in the eight-sensor case. This means that the latency gets worse when increasing the number of sensors of schedule-based access mode.

Latency when increasing scheduled access mode sensors.
Polling access sensors
In each case, an ECG sensor that has polling access mode is placed next to the previous one, so that the total number of sensors becomes 6, then 7, and finally in the third case 8. The slots were distributed as shown in Table 8.
Slot distribution of ECG sensors.

ECG: electrocardiogram; BP: blood pressure.
After running the three simulation scenarios, some of the performance measures were taken. First, the number of dropped packets when the number of sensors of polling access mode is increased is checked, as shown in Figure 15. The number of dropped packets increases when the number of sensors that have polling access mode is increased, with an increase of around 346 packets in the six-sensor case, 609 packets in the seven-sensor case, and 819 packets in the eight-sensor case.

Dropped packets when increasing polling access mode sensors.
Then, the outcome of the number of data packet breakdown that failed due to buffer overflow and successful from the first trial has been checked, as shown in Figure 16. We notice that when the number of sensors that have polling access mode is increased, the failure rate increases from 1115 to 1934, while the success rate decreases from 2593 to 1763. That is, adding polling-based access mode sensors looks similar to contention, with an advantage of the former.

Data packet outcome breakdown when increasing polling access mode sensors.
Finally, the latency performance is shown in Figure 17. The increase in the number of sensors that have polling access mode from 5 to 8 sensors made the number of packets received with a delay under 20 ms decrease from 2250 to 2130 packets only. This means that the latency getting a little bit worse when increasing the number of sensors of polling access mode.

Latency when increasing polling access mode sensors.
Adding the sixth sensor based on sensor access mode
Using the same previous scenarios, we add a sixth sensor node based on the sensor access mode (contention, scheduled, or polling) and run the simulation to check the results. We set the rate for all nodes to 80 packet/s/node and try to put 13 slots for contention and 6 slots for each node for scheduled access and 1 slot for polling. The slots were distributed as shown in Table 9.
Slot distribution after adding the sixth sensor.

BP: blood pressure; Temp, temperature; ECG: electrocardiogram.
After running the aforementioned three simulations, some of the performance measures were taken. First, the dropped packets for the basic model in comparison with six sensor scenarios were checked, as shown in Figure 18. The results for contention and polling access modes have similar performances, with 1622 and 1628 dropped packets in each case, respectively. In the case of the scheduled access mode sensor, only 1132 dropped packets were recorded. Therefore, adding one more sensor of scheduled access mode decreased the number of dropped packets by around 150 packets, that is, improved the performance in terms of dropped packets. However, the performance was getting worse when adding one more sensor of contention or polling access mode.

Dropped packets when adding sixth sensor based on sensor access mode.
Then, the outcomes of the number of data packet breakdown that failed due to buffer overflow and successful from the first trial are recorded in Figure 19, in which a sixth sensor is added based on the sensor access mode: in (a) a contention sensor is added, in (b) a scheduled is added, and in (c) a polling access mode sensor is added. The following remarks may be drawn:
Adding one contention access mode sensor: the failure rate increased from 1115 to 1448 and the success rate decreased from 2593 to 2245.
Adding one scheduled access mode sensor: the failure rate decreased from 1115 to 989 and the success rate increased from 2593 to 2744.
Adding one polling access mode sensor: the failure rate increased from 1115 to 1449 and the success rate decreased from 2593 to 2238.

Data packet outcome breakdown when adding a sixth sensor: (a) 6 sensors:1 contention, (b) 6 sensors:1 scheduled, and (c) 6 sensors:1 polling.
This means that adding one more sensor of scheduled access mode performs better than adding one sensor with contention or polling access mode.
Then, the latency for the three cases is recorded in Figure 20. The histogram shows the number of packets received with a delay under 20 ms. It drops from 2250 packets in the basic model to 2195 and 2194 packets when adding a contention or polling sensor, respectively. The same thing happened, but more noticeably, with the scheduled access sensor where it dropped to 2137 packets.

Latency when adding a sixth sensor based on sensor access mode.
Finally, Figure 21 shows the variation in the energy consumption in joules when adding one more sensor. With both the contention access mode and the polling access mode sensors, it increased by around 2% in comparison with the basic model. However, when adding one more sensor that has scheduled access mode the consumed energy decreased by around 11%.
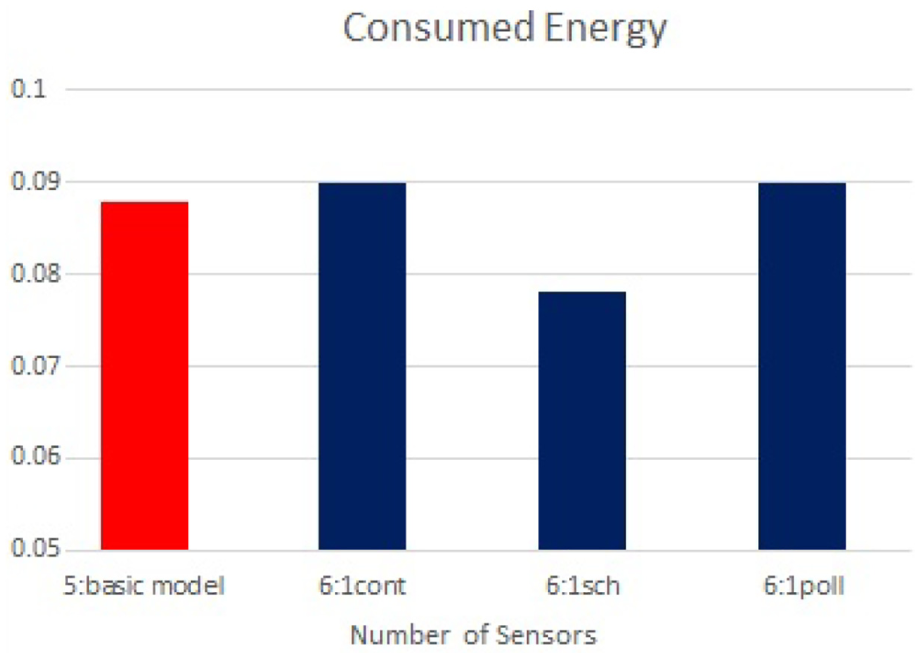
Consumed energy when adding a sixth sensor based on sensor access mode.
This means that adding schedule-based access mode sensor performs better than contention and polling in terms of energy consumption. This occurred because having more contention or polling requires more energy for the channel accessing mechanism; however, scheduled is fixed and does not require much energy.
Conclusion
Through this research, a WBAN model for a patient with high BP was built. The network consisted of heterogeneous medical sensors that use a combination of all the MAC access techniques in the IEEE 802.15.6 standard. The proposed model has been implemented using the Castalia simulator on the Linux platform. After studying how the performance of the specific WBAN was affected by changing the slot distribution, the traffic intensity and the number of sensor nodes among various MAC access techniques used in the standard, some rules have been set on how to optimize the operation of the network under these various conditions.
In particular, three experiments were used, and through the obtained results of data packet outcome breakdown, dropped packets, latency and energy consumption, we were able to select each time the best possible performance of the considered WBAN.
So, through the first and second experiments, it may be concluded that an increase in the number of contention slots would increase the number of dropped packets due to either lost packets or acknowledgments, would decrease the number of dropped packets due to buffer overflow, and would increase the consumed energy. This basically means that using a smaller number of contention slots and larger number of scheduled slots would be advantageous as it decreases the consumed energy.
Through the third experiment, after adding three more sensors of the same access mode, it was found that by addition of three more sensors of contention or polling access mode, the performance was getting worse in terms of dropped packet and a little bit worse in latency. However, when adding three more schedule-based access mode sensors, the performance was getting better in terms of latency and not always getting worse in terms of dropped packets.
In addition, using the same third experiment, after adding one more sensor of different access mode, it was found that contention and polling produced similar action when more sensors are added, namely, the performance was getting worse in terms of dropped packets and energy consumption but a little bit worse in terms of latency. However, when adding scheduled access mode sensors, the performance was getting better in terms of dropped packets and energy consumption but getting worse in terms of latency, when compared with contention and polling.
We hope that this research will provide more insight for designers and implementers for designing effective WBAN networks, and this may provide suggestions for suitable WBAN MAC design for patients in terms of throughput, delay, and energy.
Our future work will be in this direction but a combination of various WBANs for different patients in hospital. We may also consider other disease scenarios with different sensors.
Footnotes
Handling Editor: Salvatore Serrano
Declaration of conflicting interests
The author(s) declared no potential conflicts of interest with respect to the research, authorship, and/or publication of this article.
Funding
The author(s) received no financial support for the research, authorship, and/or publication of this article.