
Abstract
The coverage intensity of sensors is the most important issue on structural health monitoring technique. The geometric configuration of sensors must be optimized based on coverage intensity with proper objectives. In this article, a novel algorithm for optimal sensor placement in various steel frames was evaluated. These frames including moment-resisting frame, moment-resisting frame with base isolation, and moment-resisting frame with base isolation with steel shear wall were selected for case studies. This approach was proposed based on combination of common optimal sensor placement algorithm and nonlinear time history analysis. A new method called transformed time history to frequency domain approach was evaluated to transform nonlinear time history analysis results to frequency domain and then the effective frequencies according the maximum range of Fourier amplitude were selected. The modified type of modal assurance criterion values can be achieved from modal assurance criterion with the exact seismic displacement. All of novel optimal sensor placement processes were done through FEM-MAC-TTFD code modeled and developed in MATLAB by authors of this article. The results show that there is good relative correlation between the sensors number and coverage intensity obtained with modal and modified modal assurance criterion approaches for moment-resisting frame system, but for integrated frame such as moment-resisting frame with base isolation and moment-resisting frame with base isolation with steel shear wall, the modified modal assurance criterion approach is better approach. There is no significant difference between coverage intensity of sensors for top joints between modal assurance criterion and modified modal assurance criterion approaches for moment-resisting frame, moment-resisting frame with base isolation, and moment-resisting frame with base isolation with steel shear wall systems (R2 = 0.994, 0.986, and 0.724, respectively). It was found that if reference point is located in center of frame, there is significant difference between modal assurance criterion and modified modal assurance criterion approaches, and modified modal assurance criterion generated slightly better results.
Keywords
Introduction
The smart sensors, remote sensing, and decision-making knowledge are used in structural health monitoring (SHM) process to monitor and damage detection of structures. The placement of sensors is a key role on SHM and it must be optimized in terms of the number of sensors, increase accuracy, and damage detection with high reliability. During the recent years, the novel nonlinear optimization techniques were evaluated as a tool for SHM. The optimization process in optimal sensor placement (OSP) can be done with at least one objective function. Recently, many structures are being instrumented with optimal sensors in order to monitor during and after seismic events such as wind and earthquakes. The various techniques for OSP based on behavior of structure and cost-minimization were developed. In most proposed methods, an optimal configuration provides the best observability and controllability for the identified objective modes. The most widely used OSP approach is modal assurance criterion (MAC) algorithm.1,2 The MAC matrix is calculated from each of the two orthogonal modal vectors. The MinMAC method was evaluated via extending the MAC idea. This algorithm 3 was proposed to ensure modal correspondence between the various mode shapes. This algorithm can be regarded as a forward sequential addition algorithm, which adds one sensor at each iteration step based on the results of finite element method (FEM) dynamic analysis. However, the non-decreasing aspect of the MinMAC algorithm, that is, the maximum off-diagonal term does not decrease monotonically with the number of sensors. The modified type of MAC and MinMAC algorithm were applied to overcome this problem with using the contra decreasing approach. The forward–backward combinational extension (EMAC) 4 and co-ordinate modal assurance criterion (COMAC) 5 were defined based on original MAC. Another approach based on maximization of the determinant of the Fisher information matrix called effective independence (EI)6,7 was utilized for the structural modal identification and optimization. A restriction of the EI method, which allows sensor locations with low energy content can be associated. This approach is modified by considering driving point residue (DPR) coefficient.8,9 The kinetic energy (KE) approach 10 was evaluated based on the amount of kinetic energy instead of Fisher’s matrix. Some similar methods, for example, eigenvalue vector product (EVP) 11 and mode shape summation plot (MSSP), 12 were used through finding the maximum EVP and MSSP values. These calculations were done in order to prevent the placement of sensors on nodal lines. A different approach consists in minimizing the information entropy; 13 measuring the uncertainty in the system parameters was introduced. This approach is presented to make decisions between sensor configurations involving a different number of sensors in each configuration. The methodology has also been extended based on structural damage detection. 14 Most of the previous research activities focused on identifying the vibration characteristics of the systems regardless of the effect of the type of structural system. The sensitivity analysis of effective parameters,15,16 regularization methods, 17 model-updating methods, 18 wavelet transform, 19 genetic algorithm (GA),20,21 and artificial neural network (ANN)22,23 have been evaluated for OSP problems.
The common approaches to determine the success of OSP processes focus on two models, that is, p-median problems (p-mp)24,25 and covering problems. 26 The covering approach was categorized with set coverage problems (SCP)27,28 and maximal covering location problems (MCLP).29–31 These models require proper concepts in optimizing process such as demand points (output of simulation), service centers (sensors), and the radius of coverage. The most important parameter in the coverage analysis through smart sensors is the accessibility of a limited number of responses. The main concepts such as the unavailability of degree of freedom (DOF) and economic consideration are usually considered as limited condition for to modify OSP process. Most of the OSP methods use results of modal analysis (MA). In this research, an efficient method for OSP from the real behavior of structure subjected to seismic load was presented. However, the novel objective function of OSP process was evaluated with the combination of structure response and coverage intensity.
Research methodology
In this study, a set of two-dimensional (2D) steel moment-resisting frames (S-MRFs) with different stories was selected for case studies. All considered frames are classified into three groups including moment-resisting frame (MRF), moment-resisting frame with base isolation (MRFBI), and moment-resisting frame with base isolation with steel shear wall (MRFBISW). The main purpose of evaluating a novel approach for health monitoring of steel frames is to develop the existing MAC with worthier computational process and make the method more reliable regarding this issue. This criterion was carried out using the MA and nonlinear time history analysis (NTA) to make modified type of MAC method and estimate the OSP. A new method called transformed time history to frequency domain (TTFD) approach was evaluated to transform time history analysis results to frequency domain. Because the steel frame has effective natural modes, the modified-MAC values of the seismic waves corresponding to each level were calculated. The frequency domain obtained with the FEM-MAC-TTFD was used to analysis the near-field (NF) and far-field (FF) seismic waves in OSP process. This approach can consider the actual earthquake waves on MAC algorithm. The basic idea is applied to generate frequency amplitude from displacement that obtained from time history analysis. The deconvolved motion was estimated based on the integrated form solution of NF and FF waves. The selected steel frames were modeled into FEM-MAC-TTFD with their equivalent properties. The finite element is used directly to deconvolve the seismic NF and FF ground motions. The NF analysis was modeled and subjected to bidirectional excitation waves. Then, the relationship between time history analysis and modified-MAC can be expressed in frequency domain in terms of functions like amplitude and phase shift. The amplitude and phase of input earthquake and convolved waves can be expressed by Fourier Transform so it can be used to determine the deconvolved displacement in frequency domain. The modal behavior of steel frames and displacement of that from base to top floor belong to the main frequencies of time history analysis were used as the main variable in calculation of modified-MAC amount. The top displacement is also controlled in time history analysis, which is employed to make a limitation parameter in optimization process.
The proposed methodology can optimize the number and placement of sensors for SHM of steel frames subjected to seismic loads. The FEM-MAC-TTFD can optimize the sensor location to make proper detection after a natural disaster like earthquake. The multi-objective function and limitation of fiber Bragg grating (FBG) sensors must be defined in optimization process. The FBG can be used to measure strain, displacement, acceleration, or temperature. This sensor consists three layers: the core, the cladding, and outer coating. The general principle of such devices is that light from a laser or from a super luminescent source is sent through an optical fiber, experiences subtle change of its parameters either in the fiber or in one or several FBGs, and then reaches a detector arrangement which measures these changes. Compared with other types of sensors, FBG can solve the complex wire problems and make sequential measurement. This characteristic of FBG makes it possible the one-time measuring of large amount of data. However, the practical application of such sensors is limited due to their relatively high price. Therefore, taking into consideration the sensors cost, their number must be limited in optimization process of FEM-MAC-TTFD approach. The applied approach in this code to solve a multi-objective optimization problem is to assign a proper weight to each normalized objective function. In this respect, the problem is converted to a single objective problem with a scalar objective function. In this way, the coverage intensity issue and modified-MAC approach were considered to optimize the sensor location. In the proposed model, when coverage of all demands in a certain and standard distance for providing service is not possible, it is better that the points with higher demand were selected for priority.
The objective function of FEM-MAC-TTFD approach is given by equation (1). The first part of this objective function optimizes the sensor placement and the second part of that optimizes the coverage intensity of FBG sensors

where
Modeling
Structural molding specification
In this study, a set of 2D S-MRFs with 3, 6, 10, and 16 stories was considered as case studies, which are categorized as short-rise, mid-rise, and high-rise frames. The height of all stories and bay width of each frames are 3.2 and 4.0 m, respectively. The various structural systems such as MRF, MRFBI, and MRFBISW are considered for each frame. Furthermore, steel plate shear wall system has been selected in the middle-span of MRFBISW frames as part of the primary lateral force-resisting system. These frames are designed according to the UBC-97, AISC code, and ASCE equilateral force procedures. 32 Discretization of governing equation and numerical analysis of case studies were performed through FEM-MAC-TTFD code. The section properties of all frames and their characteristics are given in Table 1.
Section properties and characteristics of frames.

The linear elements that used for beam and column have two nodes and 6 DOFs. The beam–column connection was modeled with rotational spring to capture rotations in all directions (2D or three-dimensional (3D)). There are coupled translational DOFs between beam and column. The Bernoulli–Euler theory was considered for elements so that the effects of shear deformation and rotary inertia that are relevant to the Timoshenko beam theory are assumed to be small and hence disregarded in the modeling process. The stiffness matrix is partitioned to separate the actions associated with two ends of the member. 33
In this study, lead rubber bearing (LRB) system was selected as a BI. 34 The geometry of an LRB is shown in Figure 1. The nonlinear spring and damper elements was used to simulate horizontal and vertical stiffness of the LRB suggested by Nagarajaiah et al. 35 The influence of bilinear hardening model and damper in the damper element must be considered effectively. The initial values of LRB properties were considered based on experimental analysis and governing equation of motion as effective and equivalent. 36 Although this assumption may be considered as a gross approximation, it seems to work well in common base isolation systems. 37

The geometry of an LRB.
Statistical metrics
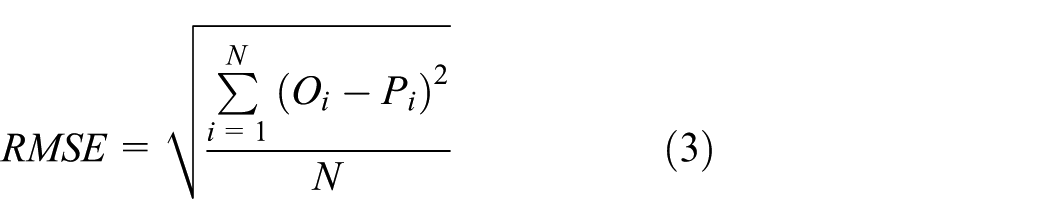
The statistical metrics were selected in this work to measure and examine the difference between two studied groups. Three statistical metrics, namely, mean absolute error (MAE), root mean square error (RMSE), and R2, were used to evaluate the performance two models. The metrics values are calculated by equations (2)–(4)


Verification
The verification of this novel approach was performed by statistical comparison between achieved results and Saiful Islam et al.’s 38 research on base isolation system. In this research, a nonlinear time domain analysis was also performed by choosing the proper ground motion that scaled with the site condition of Dhaka city in Bangladesh. The comparison between this study and Saiful Islam et al.’s research for top floor acceleration in the X and Y directions with scatter plots are shown in Figure 2. There are good agreements between this study and the reference research (R2 = 0.963 in the X direction and R2 = 0.975 in the Y direction). In this regard, the novel approach has good accuracy to discretize governing equation for NTA.

Top floor acceleration time history: (a) X direction, (b) scatter plot in the X direction, (c) Y direction, (d) scatter plot in the Y direction.
Analysis procedure
Modal analysis
Natural frequencies are the important characteristics of structure such as MRF, MRFBI, and MRFBISW systems. It can be used to analyze the results obtained by dynamic analysis. The MA of the frames to calculate natural frequencies was carried out. In this study, the FEM-MAC-TTFD code has been developed for dynamic analysis. This code determines the free vibration frequency and calculates mode shapes of fundamental frequencies as a part of dynamic analysis. The requirement criteria to perform the dynamic analysis: at least 90% of the mass must participate in the solution.
32
The necessary steps for dynamic analysis and OSP of MRF, MRFBI, and MRFBISW systems are shown in Figure 3. The mechanical properties were considered as the experimental test. Based on these tests TD,
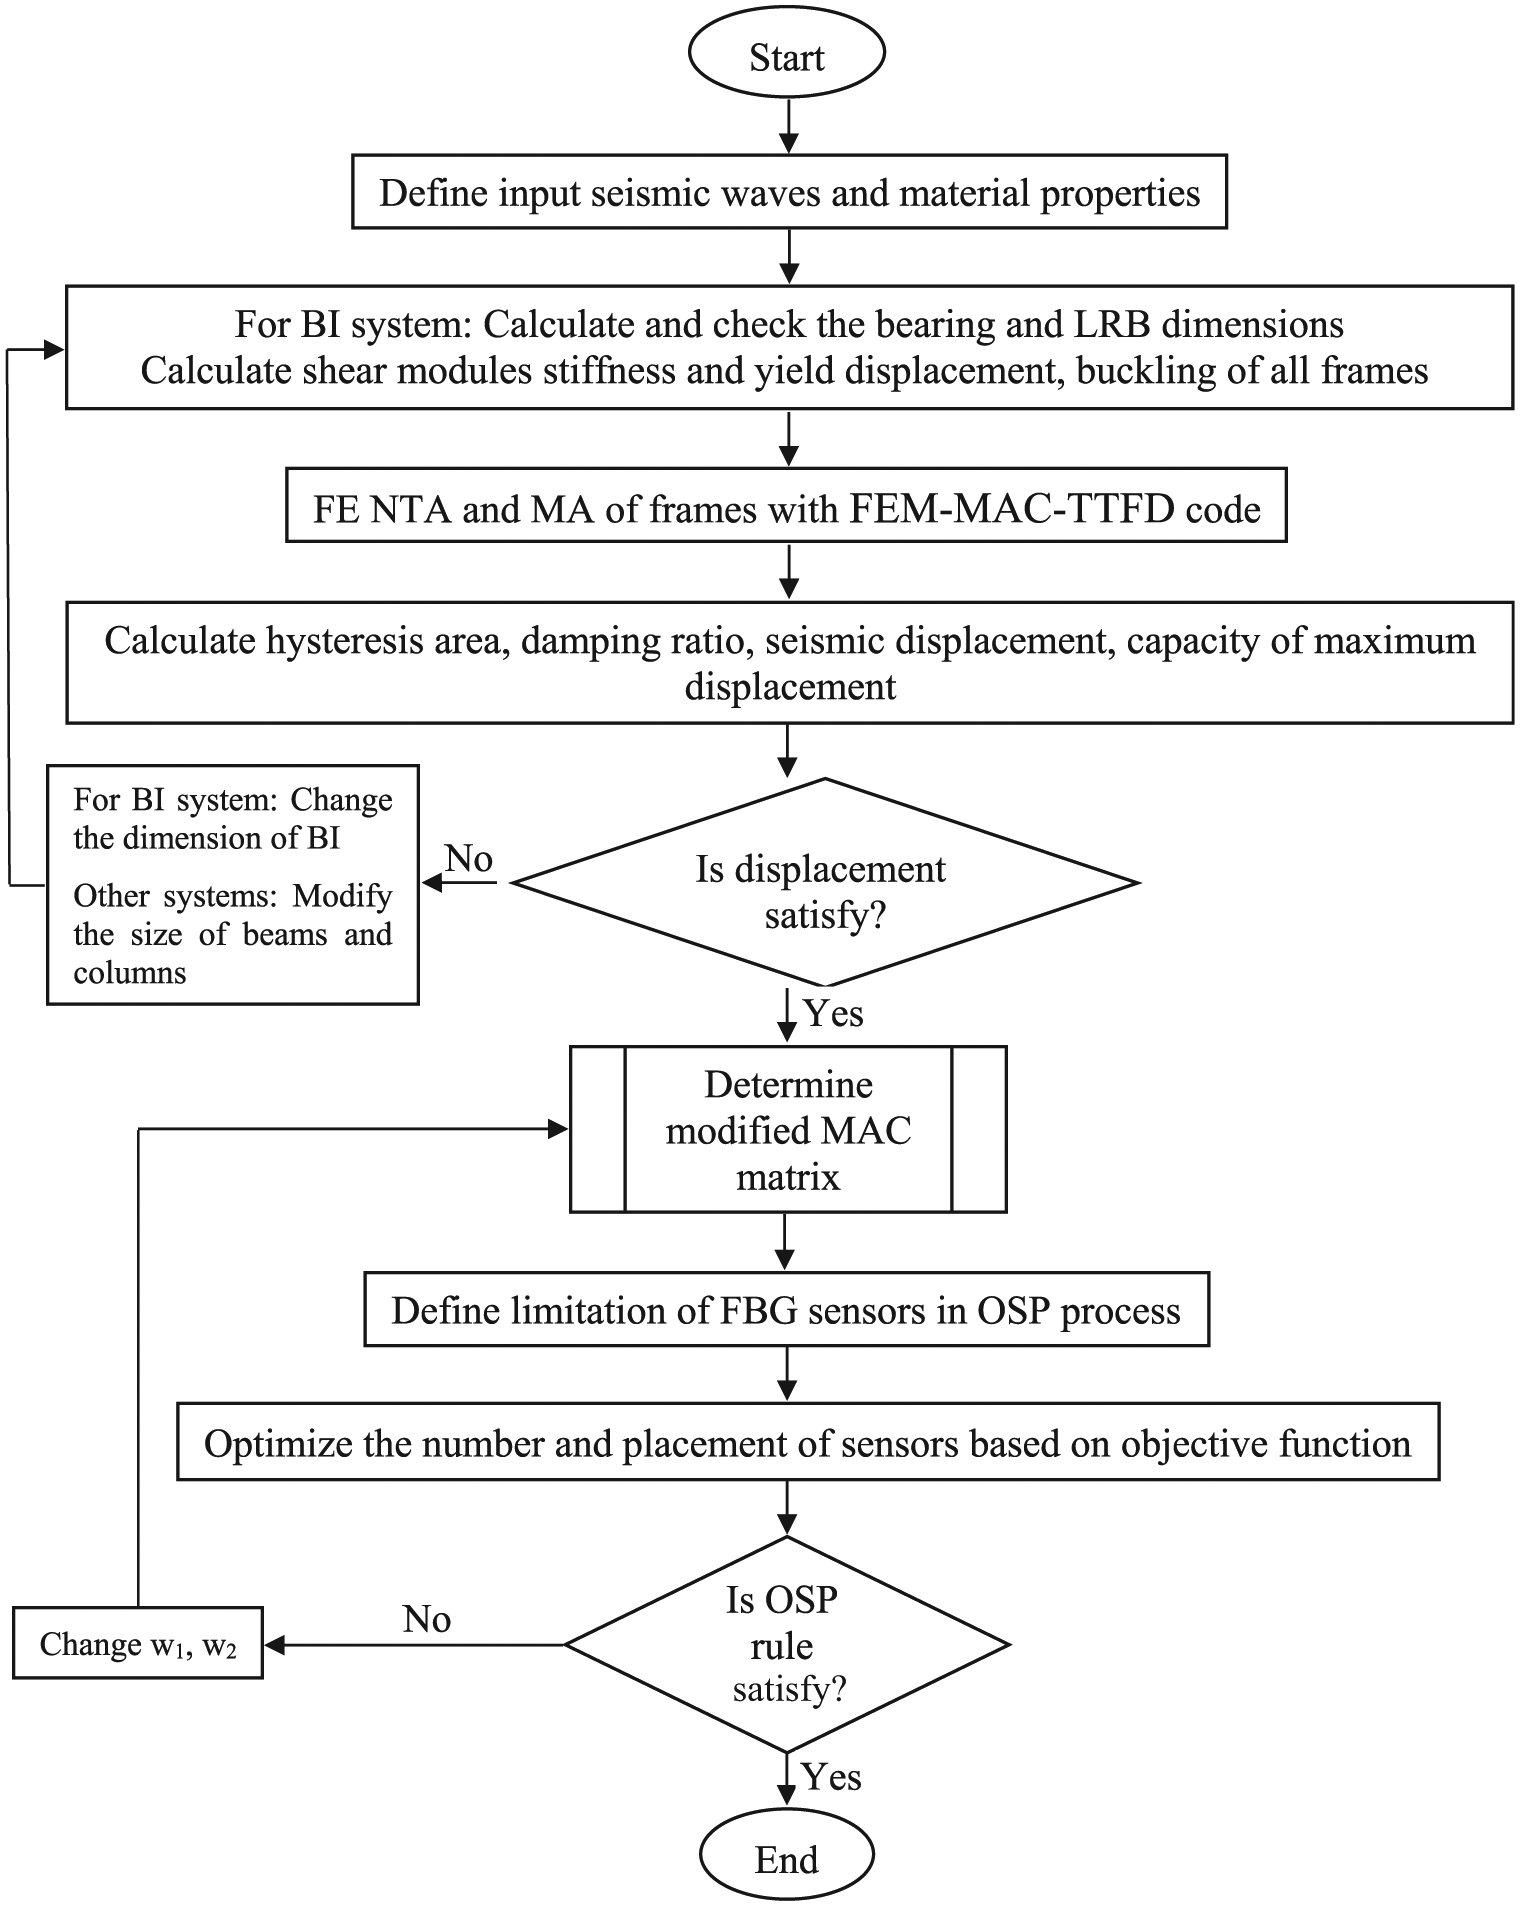
The steps of OSP for MRF, MRFBI, and MRFBISW systems.
The dimensions of designed LRBs.

LRB: lead rubber bearing.
The MA has been done for all considered systems, and the effective mode shapes including MRFBI were achieved. The first six normalized mode shapes of the MRF system with 6 and 16 stories with their frequencies are shown in Figures 4 and 5, respectively.

Mode shapes of the six-story frame: (a) first, (b) second, (c) third, (d) fourth, (e) fifth, and (f) sixth.

Mode shapes of the 16-story frame: (a) first, (b) second, (c) third, (d) fourth, (e) fifth, and (f) sixth.
Nonlinear time history analysis
The six sets of recorded earthquake ground motions including NF and FF seismic records were considered in NTA. 39 The parameters of the selected ground motion records are given in Table 3. NTA were conducted using the novel integrated FEM proposed in this study with FEM-MAC-TTFD approach. Figure 6 shows base shear versus time of 16-story with MRFBISW system subjected to NF (a) and FF (b) earthquakes. The comparison between short-MRFs system subjected to NF and FF earthquake shows that there is significant difference between them. The responses of this system subjected to the NF earthquake are comparatively more than FF earthquakes. The seismic response will be reversed with increasing elevation of the frames. In addition, it is found clearly that the seismic isolation system placed for the short-rise MRFs make significant reduction of base shear responses. The MRFBISW system can increase the stiffness and base shear in comparison with other systems.
The used seismic ground motion records.


Base shear time history of 16-story MRFBISW under (a) NF and (b) FF earthquakes.
OSP process
MAC approach
All the past studies have been developed based on intuitive placement, heuristic approaches, and systematic optimization methods. The MAC is a mathematical criterion to check the compatibility between two eigenvectors. MAC matrix is defined as equation (5)1,2

In this equation, the MAC values fall within the range between 0 and 1. Value 0 of MAC shows lack of any correlation between the off-diagonal element of matrix and 1 indicates a high degree of likeness between the modal vectors. Then, the maximum values of mode displacements for nodes corresponding to the maximum off-diagonal terms with square-root-of-sum-of-squares (SRSS) or complete quadratic combination (CQC) were calculated. Finally, these points are selected for initial placement of sensors. The MAC matrix of MRF system for the effective shape modes of 6 and 16 stories are shown in Figures 7 and 8, respectively. The trihedral diagram of the MAC matrix corresponding to the first six mode shapes of the MRFBI and MRFBISW with 6 and 16 stories are shown in Figures 9 and 10, respectively.

The MAC matrix corresponding to the first six mode shapes of the MRF system (six-story frame).

The MAC matrix corresponding to the first six mode shapes of the MRF system (16 stories).

The MAC matrix corresponding to the first six mode shapes: (a) MRFBI system and (b) MRFBISW system (six-story frame).
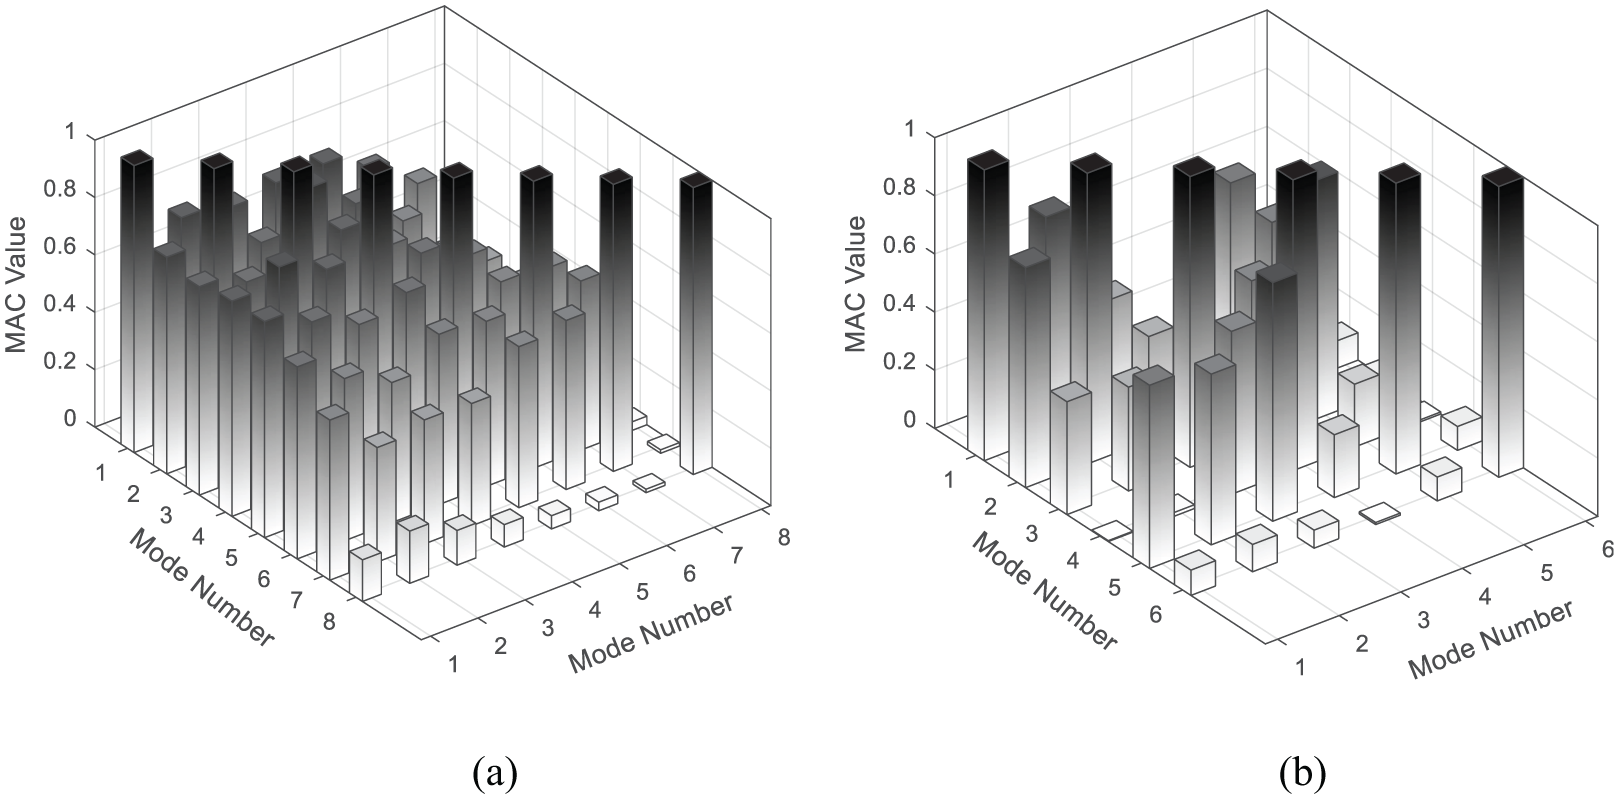
The MAC matrix corresponding to the first six mode shapes: (a) MRFBI system and (b) MRFBISW system (16-story frame).
TTFD (modified-MAC) algorithm
Any signal can completely be described in time or frequency domain, and so, the equivalent periods Tei are obtained. 40 Both representation data in time or frequency domain can transform to each other. These transformations, the so-called Fourier transformation and the inverse Fourier transformation, are given in equations (6) and (7), respectively


There was no precisely dynamic response on the past presented OSP algorithms, and the authors of this article developed the TTFD algorithm on the basis of NTA. The mathematical process of TTFD is given by equation (8). In first step of this approach, the results of the nonlinear analysis were used in order to obtain the exact sensor placement. The values of displacement–time output results in time domain must be transformed to frequency–domain in the second step of this approach based on equation (7). In the next step of TTFD approach, the effective frequencies according the maximum Fourier amplitude were selected. In fourth step of this method, the normalized seismic displacement of each effective period was considered. In this respect, these normalized displacement in Z (j = 1:n) direction act as mode shape in MAC analysis. In this equation, n is the number of levels of dam considered to install the FBG sensors. The modified type of MAC values can be obtained from MAC in the last step of this approach

In this study, a novel approach of OSP algorithms with combination of MAC and TTFD were utilized. The CQC method was utilized as a famous modal combination technique. However, after the time–frequency transformation, the corresponded values of time history analysis should be substituted with the MA outcomes. Hence, all of the required parameter values in the CQC, such as maximum modal responses, are replaced with transformed equivalent time history results. Figure 11 shows the flowchart of modified-MAC approach that was mentioned in Figure 3 as a subroutine.

The flowchart of modified-MAC approach.
Using equation (5), each time domain function can be translated to a frequency domain and make it possible to study the amplitude of the signal at each frequency. Figure 12 illustrates this transformation for MRFBISW system with 16 stories subjected to NF and FF earthquakes as a sample of applying the Fourier transformation of other systems. The alternative frequencies to create modified-MAC matrix for this system can be obtained from Figure 12. The reliability analysis methodology is illustrated by the comparison of obtained frequencies of this dynamic approach subjected to different initial seismic loads and modal reference research. The achieved frequencies for creating MAC matrix from MA and creating modified-MAC matrix based on Fourier amplitude values are shown in Table 4.

Fourier spectrum of 16-story MRFBISW subjected to (a) NF and (b) FF earthquakes.
Selected frequencies to create the MAC and modified-MAC matrix of 16-story MRFBISW.

MAC: modal assurance criterion; MRFBISW: MRFBI with steel shear wall; MA: modal analysis; FF: far-field.
The coverage intensity model
One of most important parameters on optimal placement of smart wireless sensors is coverage intensity. In fact, coverage intensity is the probability that a random point in the network be covered at least by one sensor. The sensing model utilized in this study is a probabilistic model which allows a realistic modeling of sensor coverage probability.
41
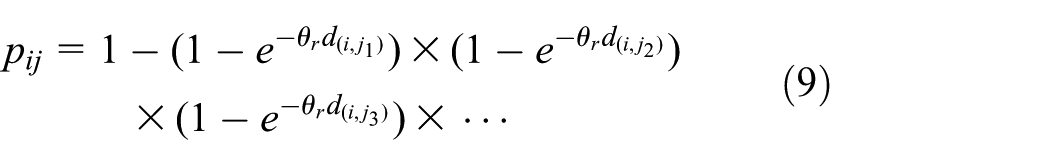
The coverage intensity of a sensor in the monitored area can be defined in every grid point that covered with a minimum confidence level. The probability of detection by a sensor varies exponentially with the distance between the target and the sensor. A target at distance d from a sensor is detected by that sensor with probability
Also another parameter called

If distance between nodes i and j decreases, the quantity of
Optimal number of sensors
The number of sensors must be able to give suitable information of SHM with modal and dynamic characteristics. The modified-MAC approach for NF and FF analysis and their results are reliable for deciding number and location of the sensors base on real behavior of structures. However, in evaluating the economic efforts, it should be noted that not only the number of sensors but also their location is important. The number of optimal sensors obtained with FEM-MAC-TTFD approach for all selected frames is shown in Figure 13.
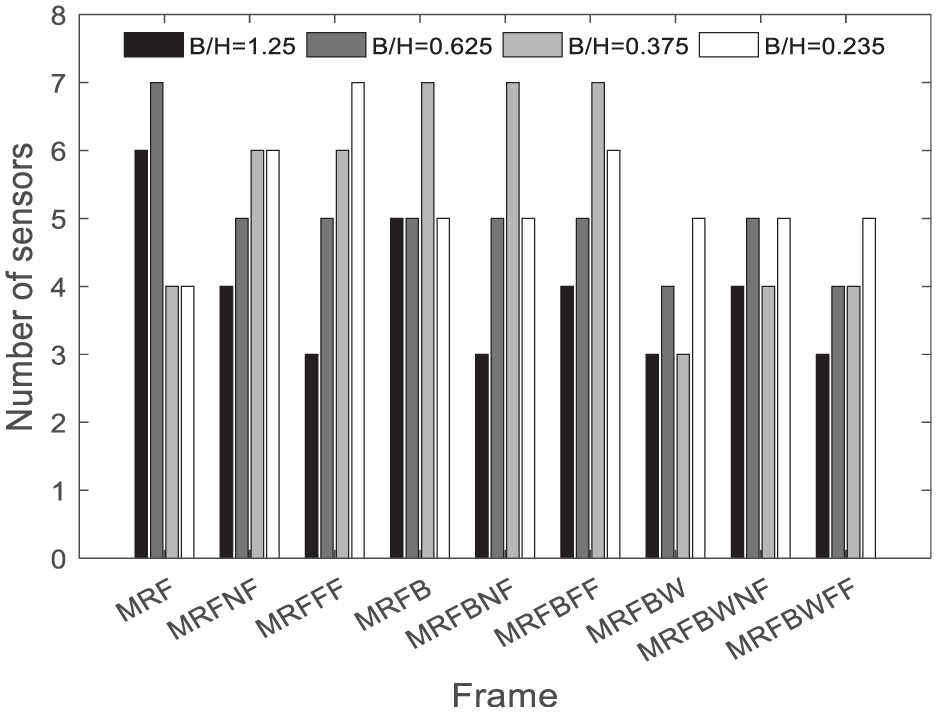
Optimal number of sensors obtained by utilized two strategies, in terms of B/H.
The statistical comparison between the performance of MAC and modified-MAC in OSP process for all systems is shown in Figure 14. The statistical difference values are given in Table 5.
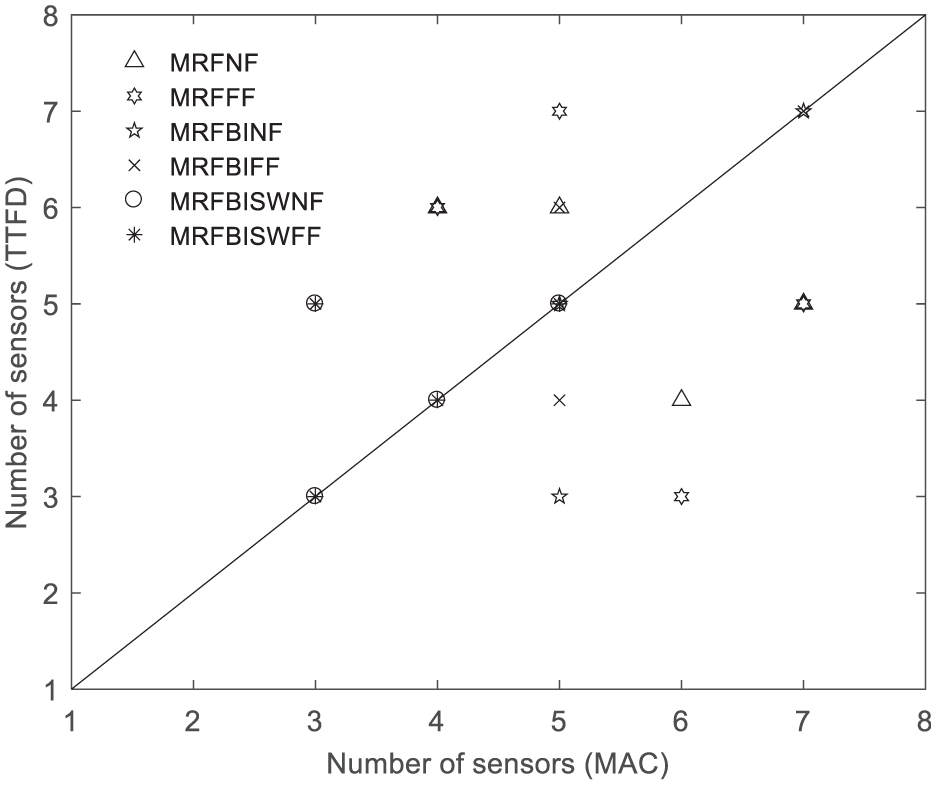
Comparison of number of sensors that calculated with MAC and modified-MAC methods.
Statistics values comparisons of the performance of different models studied.
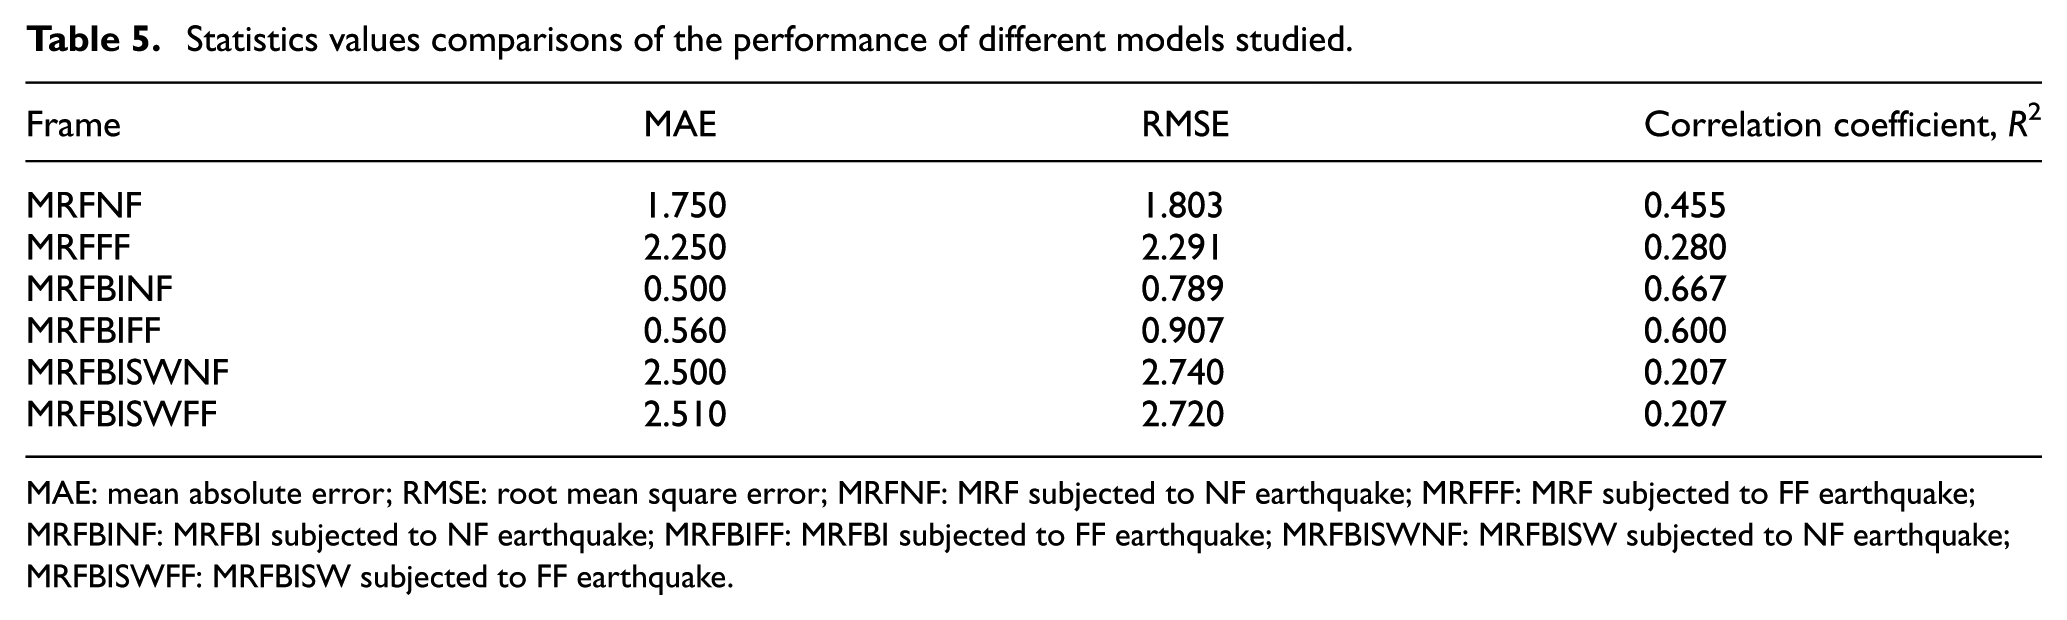
MAE: mean absolute error; RMSE: root mean square error; MRFNF: MRF subjected to NF earthquake; MRFFF: MRF subjected to FF earthquake; MRFBINF: MRFBI subjected to NF earthquake; MRFBIFF: MRFBI subjected to FF earthquake; MRFBISWNF: MRFBISW subjected to NF earthquake; MRFBISWFF: MRFBISW subjected to FF earthquake.
The results of MRFBI system had a small MAE of 0.500 and RMSE of 0.789, and a high R2 of 0.667 in the NF analysis. In the FF analysis, the MAE = 0.560 and RMSE = 0.907 were larger and R2 = 0.600 was lower compared with the NF case. Overall, the results showed that there is relatively positive correlation between MAC and modified-MAC approaches to find number of sensors in the MRFBI model. The results of NTA show that the MRFBI system has a greater dissipative capacity compared to MRF system, but this needs to be controlled as it creates higher story drifts. The steel shear-wall system can decrease in value of bending moment, shear force, deflection, and axial force for some columns and story drifts. In this context, the MRFBISW system was selected to control lateral drift of MRFBI system. The results of MRFBISW system had a big MAE of 2.50 and RMSE of 2.74, and a high R2 of 0.207. The results of this system showed that there is significant difference between MAC and modified-MAC approaches to find the number of sensors. Therefore, the modified-MAC performs better to obtain the optimal number of sensors in integrated system like MRFBISW for NF and FF analysis.
Coverage intensity
Coverage is a fundamental issue in sensor networks. The results of OSP methods for investigated frames showed similar performance for all past studies in terms of the minimum number of sensors with a simple objective function based on MAC value. But in SHM process, the number of sensors should be distributed in the height of structure to get the maximum coverage. For this purpose, a probabilistic model to determine the coverage intensity of sensors was discussed and then the coverage intensities based on the objective function were calculated. The objective function was defined as the sum of coverage intensities at the nodes according to equation (9). The coverage intensity was obtained individually for each category corresponding to the upper edge joints and center of the frames. In this study, the objective function was modified by coverage intensity as equation (1).
The proposed framework focuses on the determination of the number of sensors, their proper locations, and coverage to estimate better detection. In this context, selection the point reference to calculate coverage intensity is very important.
Figure 15 shows the average of coverage intensity values for top corner joints and center of the frames.

The coverage intensity values of the sensors for (a) top corner joints average (b) and center of the case study frames in terms of B/H.
The results of Figure 15 show that considering top corner joint to evaluate coverage intensity provides accuracy for all frames with various B/H factor. In this context, it is clear from Figure 15(a) that coverage intensity for B/H = 0.235 or high-rise structure is almost the same for all systems and for B/H = 1.25 or low-rise structure is often similar. The results of Figure 15(b) show that coverage intensity for B/H = 0.235 is almost wake for all systems and for B/H = 1.25 is almost same. Therefore, the results of coverage intensity for center point reference showed poor performance for some investigated frames in terms of the maximum coverage intensity. This performance is often wake for high-rise structures.
The statistical comparison between the coverage intensity of MAC and modified-MAC in OSP process for top corner joints and center of the studied frames are shown in Figure 16(a) and (b), respectively.

The statistical result of comparison between utilized two approaches for (a) top corner joints average and (b) center of the studied frames.
The statistical difference values for considering reference point in top corner and center joint are given in Tables 6 and 7, respectively.
Statistics values comparisons of the performance of different models studied.

MAE: Mean Absolute Error; RMSE: Root Mean Square Error.
Statistics values comparisons of the performance of different models studied.

MAE: mean absolute error; RMSE: root mean square error.
The results of Figure 16(a) show the coverage intensity determined from MAC were the closest to the modified-MAC calculation when the reference point is considered in top corner point. In this case, the values of coverage intensity are almost greater than 0.5 for all structural systems. Comparison between Figure 16(a) and (b) shows that the reference point located in top of frame provides better coverage intensity. This figure shows the greatest concentration within the vicinity of the 45° line in comparison to MAC and modified-MAC calculation for MRFNF and MRFBIFF systems.
This is in agreement with Table 6, in which MRF system has the most accurate coverage intensity among the four systems’ coverage intensity if the reference point is considered at center of frame. In the other words, in this system, the amount of the coverage intensity obtained by MAC has the closest value that was evaluated by the modified-MAC approach. In the table, the results of MRF system subjected to NF earthquake had a small MAE of 0.03 and RMSE of 0.038, and a high R2 of 0.974. The previously mentioned MAE (RMSE) values were, respectively, 150% (71%) and 206% (221%), smaller than the values obtained from MRFBINF and MRFBISWNF systems. In the FF analysis of MRF system, the MAE = 0.093 and RMSE = 0.109 were larger and R2 = 0.212 was lower compared with the NF analysis. Therefore, there are significant differences of the coverage intensity obtained with MAC and modified-MAC in FF analysis for all structural systems. Therefore, the modified-MAC performs better if the reference point is located in the center of frame for NF and FF analysis.
Statistical comparison of the coverage intensity obtained with MAC and modified-MAC approaches if the reference point is located in the top of frame is evaluated in Table 7. The results of MRF system had a small MAE of 0.01 and RMSE of 0.01, and a high R2 of 0.994 in the NF analysis. In the FF analysis, the MAE = 0.057 and RMSE = 0.096 were larger, and R2 = 0.933 was lower compared with the NF case. Overall, the results showed that there is definitely positive correlation between MAC and modified-MAC approaches to find coverage intensity of sensors in the MRF system. The results of MRFBI system show that there is relatively positive correlation between two approaches to calculate the coverage intensity. It was shown that base isolation increases the flexibility at the base of the structure, which increases energy dissipation due to the seismic force, and hence structure’s seismic demand drastically reduced as compared to the conventional fixed base structure. Therefore, there is good relative correlation between the coverage intensity obtained with modal and modified-MAC approaches. Furthermore, the obtained coverage intensity for MRFBISW system shows that there is weak correlation between two approaches. The integrated systems like MRFBISW increase the flexibility at the base and decrease the displacement and lateral story drift. Therefore, the coverage intensity must be calculated with the approach that considers the real seismic behavior of structure instead of modal analysis.
Conclusion
In this article, the modified-MAC was evaluated to find the optimum number of sensors and obtain the coverage intensity as a novel approach. Three steel frames were used to compare the MAC and modified-MAC approaches. There was no precisely dynamic response in the past studies on OSP, so the authors of this article designed and developed the modified-MAC (TTFD) approach. The main advantage of FEM-MAC-TTFD approach is its accuracy and simplicity. Structural behavior of frame can be obtained from a simple nonlinear FE model. There are some obscurities, for example, how many sensors are necessary to detect damage in frame and what is the acceptable level of MAC value for optimize sensor placement. This novel approach can reduce computational process and collect all of OSP processes in one criterion. In spite of assumption and simplification, this methodology can detect the sensor placement from nonlinear seismic analysis. Results showed that MAC and Modified-MAC could accurately obtain optimal number of sensors. However, modified-MAC generally outperformed MAC. There was relatively proper correlation between MAC and modified-MAC approaches to obtain optimal number of sensors in the MRFBI model. Results also indicated that modified-MAC provided the most accurate sensor calculation in both MRF and integrated structural system. This implies that the modified-MAC considers the real seismic behavior of structure in integrated systems such as MRFBI and MRFBISW.
The main advantages of this novel approach in SHM process are considering proper objective function to get the maximum coverage. The results of coverage intensity, if reference point is located in center of frame, showed poor performance for some investigated frames. However, if reference point is located on top of frame, coverage intensity has proper accuracy for all frames with various B/H factor. The similar results show that the MAC-modified approach is a better approach to obtain coverage intensity for integrated structures subjected to NF and FF earthquakes.
Therefore, this novel approach had the most advantage to outperform the existing OSP retrieval equations such as Li, 4 Kammer,6,7 Heo et al., 10 Papadimitriou, 13 Beygzadeh et al., 17 Jung et al., 21 and Hakima and Razak. 22
Footnotes
Appendix 1
Handling Editor: Paolo Barsocchi
Declaration of conflicting interests
The author(s) declared no potential conflicts of interest with respect to the research, authorship, and/or publication of this article.
Funding
The author(s) received no financial support for the research, authorship, and/or publication of this article.