
Abstract
Nowadays, Internet of things not only brings promising opportunities but also faces a lot of challenges. It attracts a lot of researchers’ attention and has important economic and social values. Internet of things plays a key role in the big data processing, especially in image field. Image de-noising still is a key problem in image pre-processing. Considering a given noisy image, the selection of thresholds should significantly affect the quality of the de-noising image. Although the state-of-the-art wavelet image de-noising methods perform better than other de-noising methods, they are not very effective for de-noising with different noises and with redundancy convergence time, sometimes. To mitigate the poor effect of traditional de-noising methods, this article proposes a new wavelet soft threshold based on the Chi-square distribution-Kernel method under the Internet of things big data environment. The new method alternates three minimization steps. First, the Chi-square distribution-Kernel model is constructed to find the customized threshold that corresponds to the de-noised image. Second, a freedom degree is considered, which is related to the customized wavelet coefficient of the Chi-square distribution-Kernel to be thresholded for image de-noising. Here, noisy image is first decomposed into many levels to obtain different frequency bands and the soft thresholding method based on Chi-square distribution-Kernel method is used to remove the noisy coefficients, by fixing the optimum threshold value using the proposed method. Third, the wavelet soft thresholding based on Chi-square distribution-Kernel method is adopted to handle the image de-noising, and a significant improvement is obtained by a specially developed Chi-square distribution-Kernel method. Finally, the experimental results illustrate that this computationally scalable algorithm achieves state-of-the-art de-noising performance in terms of peak signal-to-noise ratio, normalized mean square error, structural similarity, and subjective visual quality. It also shows a consistent accuracy, edge preservation, and detailed retention improvement compared to the classic de-noising algorithms.
Keywords
Introduction
The Internet of things (IoT) generates a large amount of data, including geographic data, image data, medical data, and so on, which are stored and processed in cloud computing. In this article, we focus on the image data process. During the process of image formation, transmission, and processing, images are interfered by noise. Thus, the quality of the image can decrease. To remove or suppress the noise in the image and improve its quality, many de-noising methods are proposed, such as linear and nonlinear filtering, spectral analysis, and multi-resolution analysis. However, these traditional methods largely depend on explicit or implicit assumptions to properly separate the true signal from the random noise.
Over the past decade, wavelet analysis in the time domain and frequency domain, which has good localization properties and the multi-resolution analysis characteristics,1–3 has received much attention from researchers in different areas, including pattern recognition, image de-noising, signal processing, and image compression. The wavelet analysis can effectively distinguish useful signal and noise, so it has become a notably effective image de-noising method.
At present, wavelet de-noising mainly includes three methods. 4 First, it adopts the wavelet’s singularity detection features 5 to separate the signal and the noise. Second, it uses a wavelet coefficient threshold function 6 to reduce the image noise. Third, the Bayesian criterion coefficient of the wavelet domain 7 is used for image noise reduction. The wavelet threshold shrinkage method is the most widely used in image de-noising because of its simplicity and effectiveness. The idea of wavelet threshold processing is derived from the Donoho and Johnstone 8 theory. Donoho first provided the general threshold de-noising formula based on an orthogonal wavelet transform, which made the complex de-noising problem easy to solve.
However, because of the lack of adaptability of the scale space, the threshold is difficult to determine. The result can lead to fuzzy image edge and poor de-noising performance. Thus, many scholars have introduced different wavelet coefficient scales and their corresponding threshold to reduce image noise, such as the hard threshold, 9 soft threshold, 10 VisuShrink threshold, 11 improved sub-band adaptive SureShrink threshold, 12 and NormalShrink threshold. 13 Although these de-noising algorithms can obtain good de-noising effect, much detail information is eliminated. The image quality seriously declines, and the pseudo Gibbs phenomenon may even be generated. To date, Wang et al. 14 proposed an optimized shape parameter method for image de-noising. Kadhim 15 presented a particle swarm optimization (PSO) algorithm to estimate the threshold value with no prior knowledge for these distributions. This process was achieved by implementing the PSO algorithm for kurtosis measuring of the residual noise signal to find an optimal threshold value, where the kurtosis function is maximal. Ji et al. 16 proposed a de-noising algorithm using the wavelet threshold method and exponential adaptive window width-fitting. Their method was divided into three parts. First, the wavelet threshold method was used to filter the white noise. Second, the data were segmented using a data window. Then, an exponential fitting algorithm was used to fit the attenuation curve of each window, and the data polluted by non-stationary electromagnetic noise were replaced with their fitting results. These methods have obtained good effects for image de-noising, but few works aim to improve the threshold function. Occasionally, their threshold functions are not better.
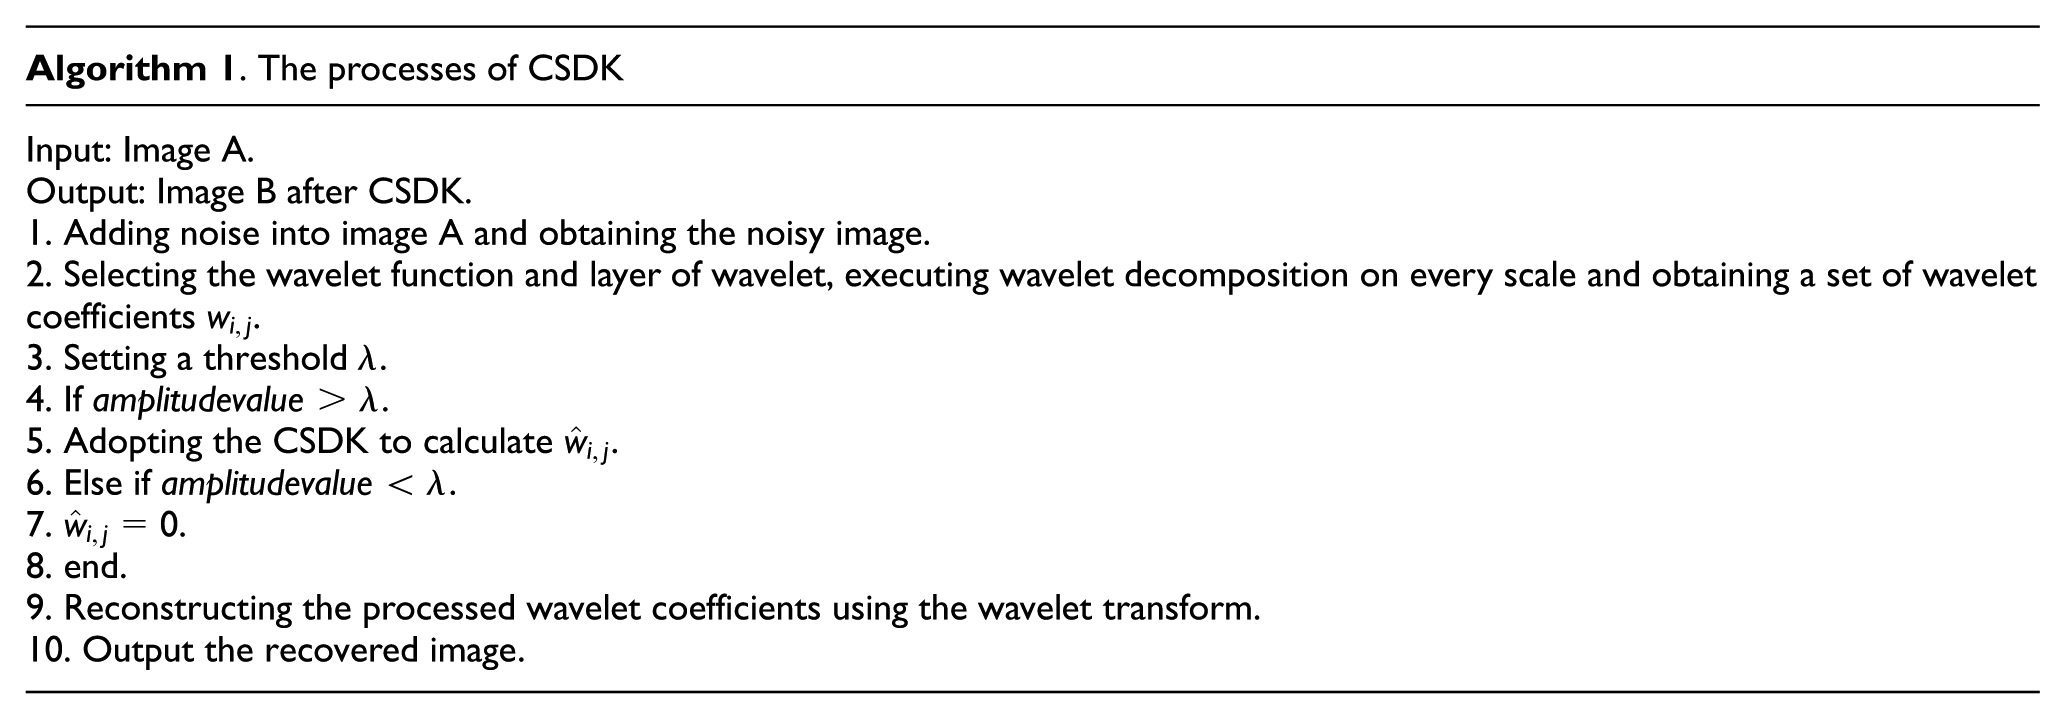
Our contributions in this article are as follows. We propose a new wavelet threshold function based on the Chi-square distribution-Kernel (CSDK) function for image de-noising. We also consider shape parameters on the wavelet coefficients to be thresholded. Hence, the soft transformation can achieve a high precision of the true signal until the noise is commendably separated by shrinkage. The wavelet soft thresholding based on CSDK is adopted to handle the image de-noising, and a significant improvement is obtained by a specially developed CSDK. To evaluate the performance of our new function, experiments were conducted on MATLAB to compare with other state-of-the-art methods. The results show that our new method performs better than other functions in terms of de-noising precision. Furthermore, the new function can enhance the image de-noising efficiency without the effect of layers or the number of image decompositions. New method can effectively remove noise and preserve the image details for de-noising image.
The remainder of this article is organized as follows. The Chi-square distribution related to this article is presented in section “Brief introduction of the chi-square distribution.” Section “Wavelet soft thresholding based on the CSDK method” illustrates the new threshold based on CSDK in detail, and section “Performance evaluation and analysis” presents the experimental results. The article is concluded in section “Conclusion.”
Brief introduction of the chi-square distribution
The presence of Gaussian white noise degrades images significantly and may hide important details and background on the images, leading to the loss of crucial information of original images.17–20 Traditionally, the first step toward removing related noise in images is to understand its statistical properties. Despite the theoretical appeal and the analytical simplicity of the Gaussian model, images of some natural scenes such as fog deviate from the Gaussian distribution. To mitigate this situation, various distributions such as the Weibull distribution, 21 the log-normal distribution, 22 the k-distribution, 23 and Cauchy distribution 24 have been suggested.
However, in the above distributions, the log-normal distribution provides a convenient choice, but fails in modeling the lower half of the image histograms and overestimates the range of variation. Weibull distribution is an empirical model with limited theoretical justification. K-distribution is a successful model for SAR image despeckling, but not for this article’s testing data. Meanwhile, generalized Cauchy distribution (GCD) is a symmetric distribution with bell-shaped density function as the Gaussian distribution but with a greater probability mass in the tails. GCD is a peculiar distribution due to the difficulty of estimating its location parameter and its heavy tail. Because it has no mean, variance or higher moments defined, GCD has a long convergence time. To alleviate the above problems, this article utilizes CSDK method for image de-noising. The following is illustration for chi-square distribution.
Supposing that n independent random variables
The probability density function (PDF) of the chi-square distribution is described as follows

The cumulative distribution function (CDF)

where

Block diagram of PDF (left) and CDF (right).
Wavelet soft thresholding based on the CSDK method
The flow chart of our new image de-noising method is shown in Figure 2.
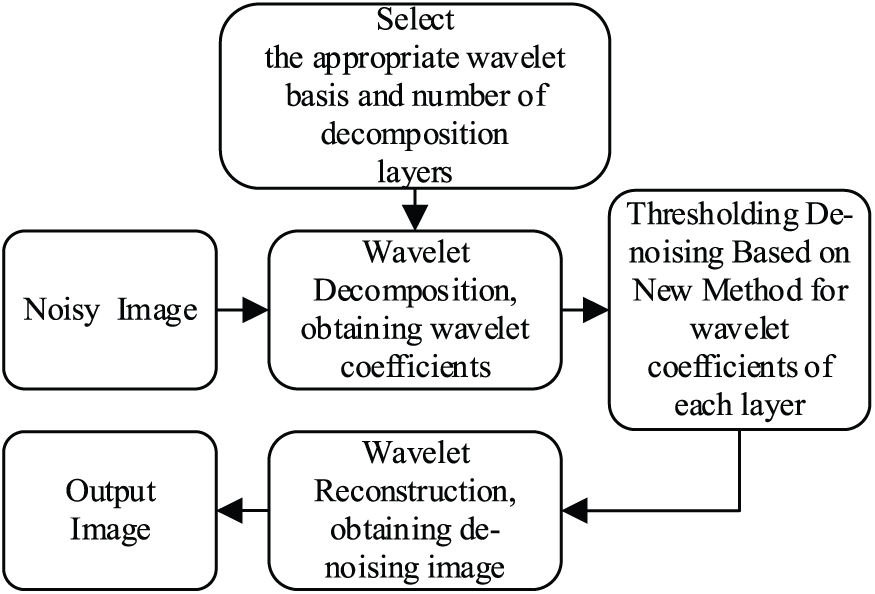
Block diagram of new image de-noising method.
CSDK model construction
The main hypothesis of our CSDK model is that a combination of the structure Gaussian kernel of an image can significantly improve its reconstruction. The Gaussian kernel function has three important properties, which are conducive to image post-processing.
The Gaussian kernel function 27 can be written as follows

where

Curve of the Gaussian kernel function.
Based on the principle of the Gaussian kernel function, we construct the CSDK model. The new function

In

Block diagram of CSDK function with different n.
Figure 4 shows that the CSDK retains the better properties of the chi-square distribution.
Wavelet soft thresholding based on CSDK
The new wavelet soft thresholding proposed in this article can be expressed as follows
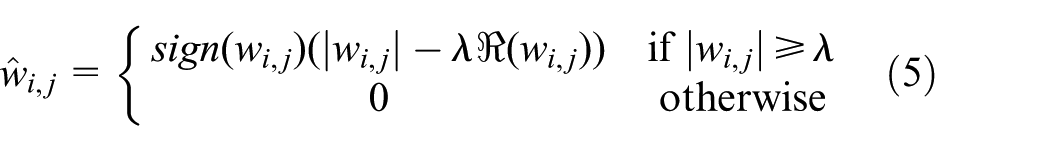
where

Block diagram of wavelet soft thresholding based on CSDK.
The properties of the new function are as follows.
Theorem 1
Continuity
There is no breakpoint, so
Proof
From its curve, we can know the domain, and the range of the function is
When

Therefore, the right-hand limit of the function is

When

Thus, the right-hand limit of the function is described as follows

When

Considering equations (8)–(10),
Thus, the new function is a continuous curve in its domain. Moreover, it compensates for the shortcomings of the hard threshold function.
Theorem 2
Monotonicity
Proof
When

The first derivative of

Regardless of
We use the identical calculation method: if
When

Therefore,
Theorem 3
Differentiability
Proof
The new function is continuous and monotonic, and its right and left limits are equal. Thus, it is differentiable.
Optimized threshold parameter
As we know, parameter

where
When multiple wavelet decompositions for an image are analyzed, the noise amplitude notably decreases with the increase in the number of image layers. However, the amplitude of image information increases. Therefore, this article proposes an optimized threshold parameter
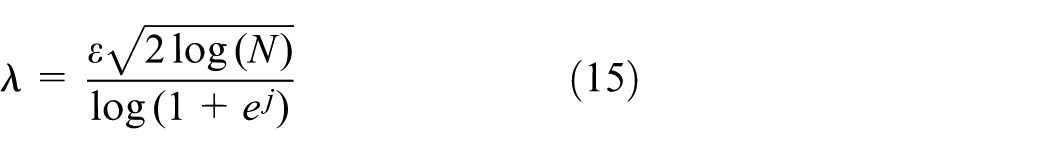
where j denotes the layer of image decomposition. In this formula, if j increases, the optimized
In summary, our new wavelet threshold function includes the following (


Then, we study the effect of j on the new wavelet threshold function. Suppose that N = 30 and

Block diagram of CSDK, when j = 2.
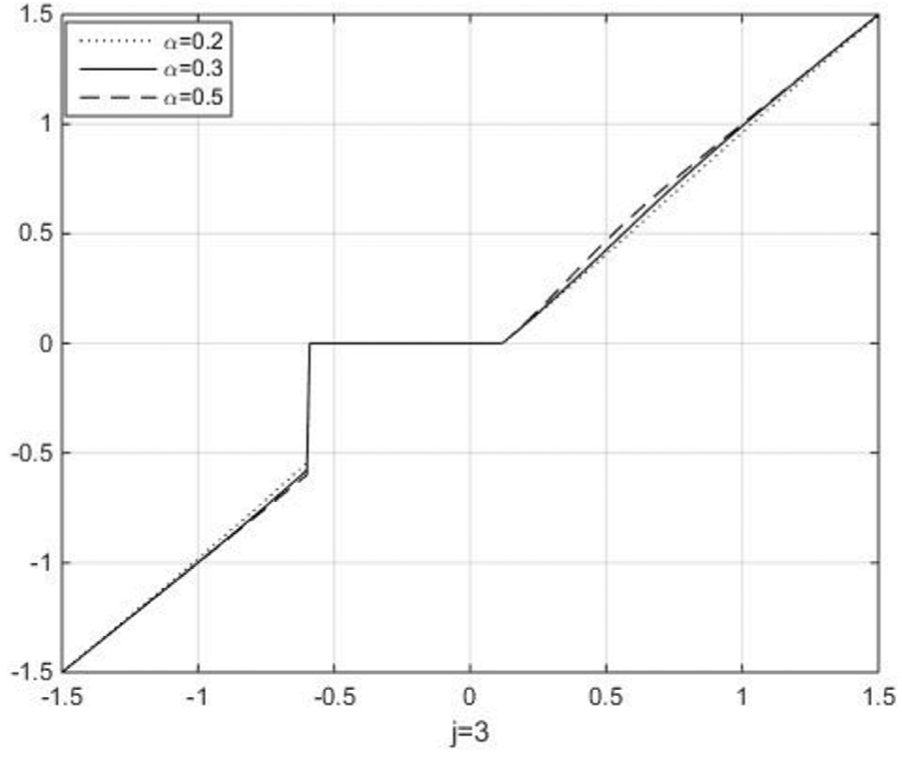
Block diagram of CSDK, when j = 3.

Block diagram of CSDK, when j = 5.
Performance evaluation and analysis
In this section, experiments are conducted to demonstrate the effectiveness of the CSDK with MATLAB R2014b, Core i7 CPU, 8 GB memory, and Windows 10 platform environment. In section “Evaluation criterion,” the evaluation criterion and its function are introduced to evaluate our new method. First, we experimented with different parameter values in the new function and analyzed their effect on the wavelet threshold de-noising in section “Performance evaluation of different parameters for image de-noising.” Then, we made a comparison to state-of-the-art threshold functions to verify the effectiveness of our new method in section “Effect of parameter
Evaluation criterion
The image evaluation criterion contains two aspects: subjective evaluation and objective evaluation. In this section, we mainly evaluate the new function with objective evaluation.29,30
In the new function, the shape parameter is adjusted to improve the effect on image de-noising. Two widely used indicators are employed to indicate the effect of image de-noising: the signal-to-noise ratio (SNR), normalized mean square error (NMSE), and structural similarity (SSIM). The SNR, NMSE, and SSIM are, respectively, calculated as shown in equations (18)–(20)

where N is the signal length; X(k) and S(k) are the noisy and original signals, respectively. Equation (18) shows that when the SNR is large, the processed image is close to the original image, which indicates that the image de-noising effect is good. Nevertheless, if the SNR is small, there is a large difference between the processed image and the original image, which reflects that the image de-noising effect is bad. Therefore, we use different shape parameters to verify our new method, and different SNRs can be obtained. According to the SNR, we can conclude a range of shape parameter (or its fixed value) with better effect on image de-noising

where

where
Performance evaluation of different parameters for image de-noising
As we know, the shape parameter significantly affects the image de-noising. Thus, the shape parameter selection is notably important.
According to the principle of Gaussian kernel function,

Testing images. Original images: (a) Lena, (b) Baboon, and (c) Barbara. Noisy images with Gaussian noise = 0.04: (d) Lena, (e) Baboon, and (f) Barbara. Gaussian noise = 0.3: (g) Lena, (h) Baboon, and (i) Barbara. Gaussian noise = 0.7: (j) Lena, (k) Baboon, and (l) Barbara.

Image Lena de-noising with different

Image Baboon de-noising with different

Image Barbara de-noising with different

Image Lena de-noising with different
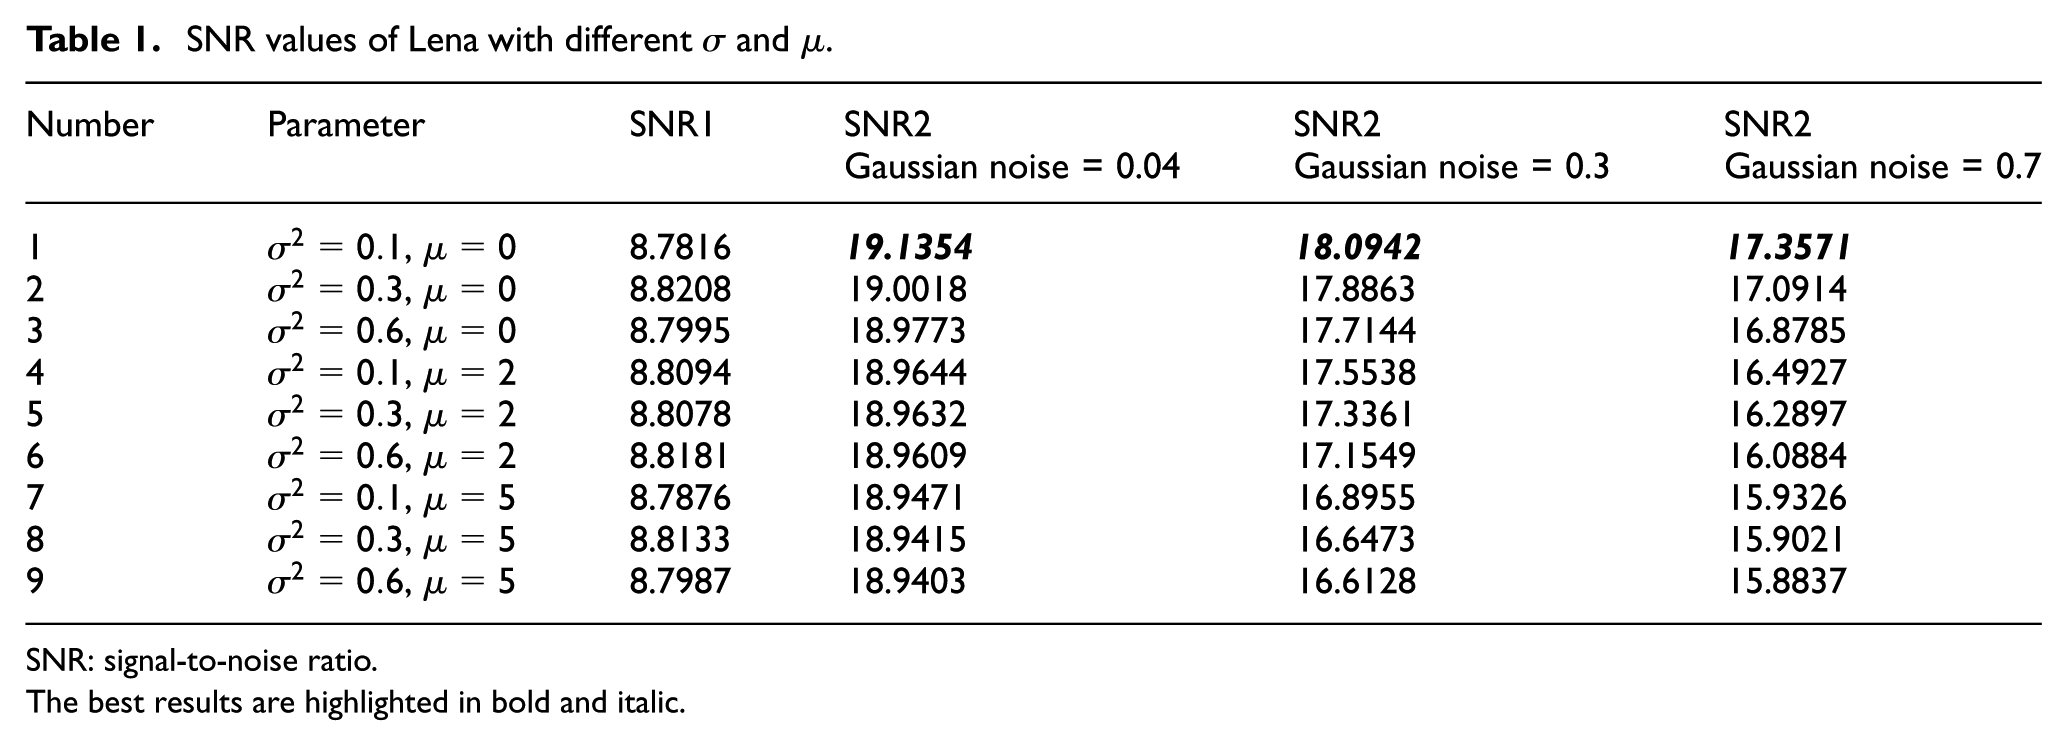
SNR values of Lena with different
SNR: signal-to-noise ratio.
The best results are highlighted in bold and italic.
SNR values of Baboon with different

SNR: signal-to-noise ratio.
The best results are highlighted in bold and italic.
SNR values of Barbara with different

SNR: signal-to-noise ratio.
The best results are highlighted in bold and italic.
Table 1 shows that when
Effect of parameter
on image de-noising
The analyzed parameters were manually optimized for the best PSNR, which is the metric in our evaluation. Let
SNR values of Lena with different

SNR: signal-to-noise ratio.
The best results are highlighted in bold and italic.
SNR values of Barbara with different

SNR: signal-to-noise ratio.
The best results are highlighted in bold and italic.
SNR values of Baboon with different

SNR: signal-to-noise ratio.
The best results are highlighted in bold and italic.
Obviously, with the increase in

Image Baboon de-noising with different

Image Barbara de-noising with different
Comparison experiments
In this section, we compare our method with state-of-the-art threshold functions (the wavelet based including soft threshold function, NWT 31 and SDL 32 ) and other famous non-wavelet-based image de-noising methods (EAF, 33 PNM, 34 EGL, 35 NLG 36 ) to demonstrate the effectiveness of our new method. In the simulated study, three images were used for testing: “Lena,”“Baboon” and “Barbara.”
In all experiments, the parameters of the references were set according to the above analysis:
In Lena test experiment, the de-noised image using the new method in Figure 16 is compared with the de-noised image of other de-noising methods. As observed, the new method successfully eliminates noise and obtains more accurate results than the other methods. Note that there are some spots in soft threshold function. SDL method indicates that the de-noising effect has better smoothness, but the image is fuzzy.

Image Lena de-noising results and experiment contrast: (a) soft threshold, (b) NWT, (c) SDL, (d) EAF, (e) PNM, (f) EGL, (g) NLG, and (h) the proposed CSDK.
Similarly, in Baboon and Barbara experiments (Figures 17 and 18), the new method effectively removes the baseline noise and retrieves the images better compared to other de-noising methods.
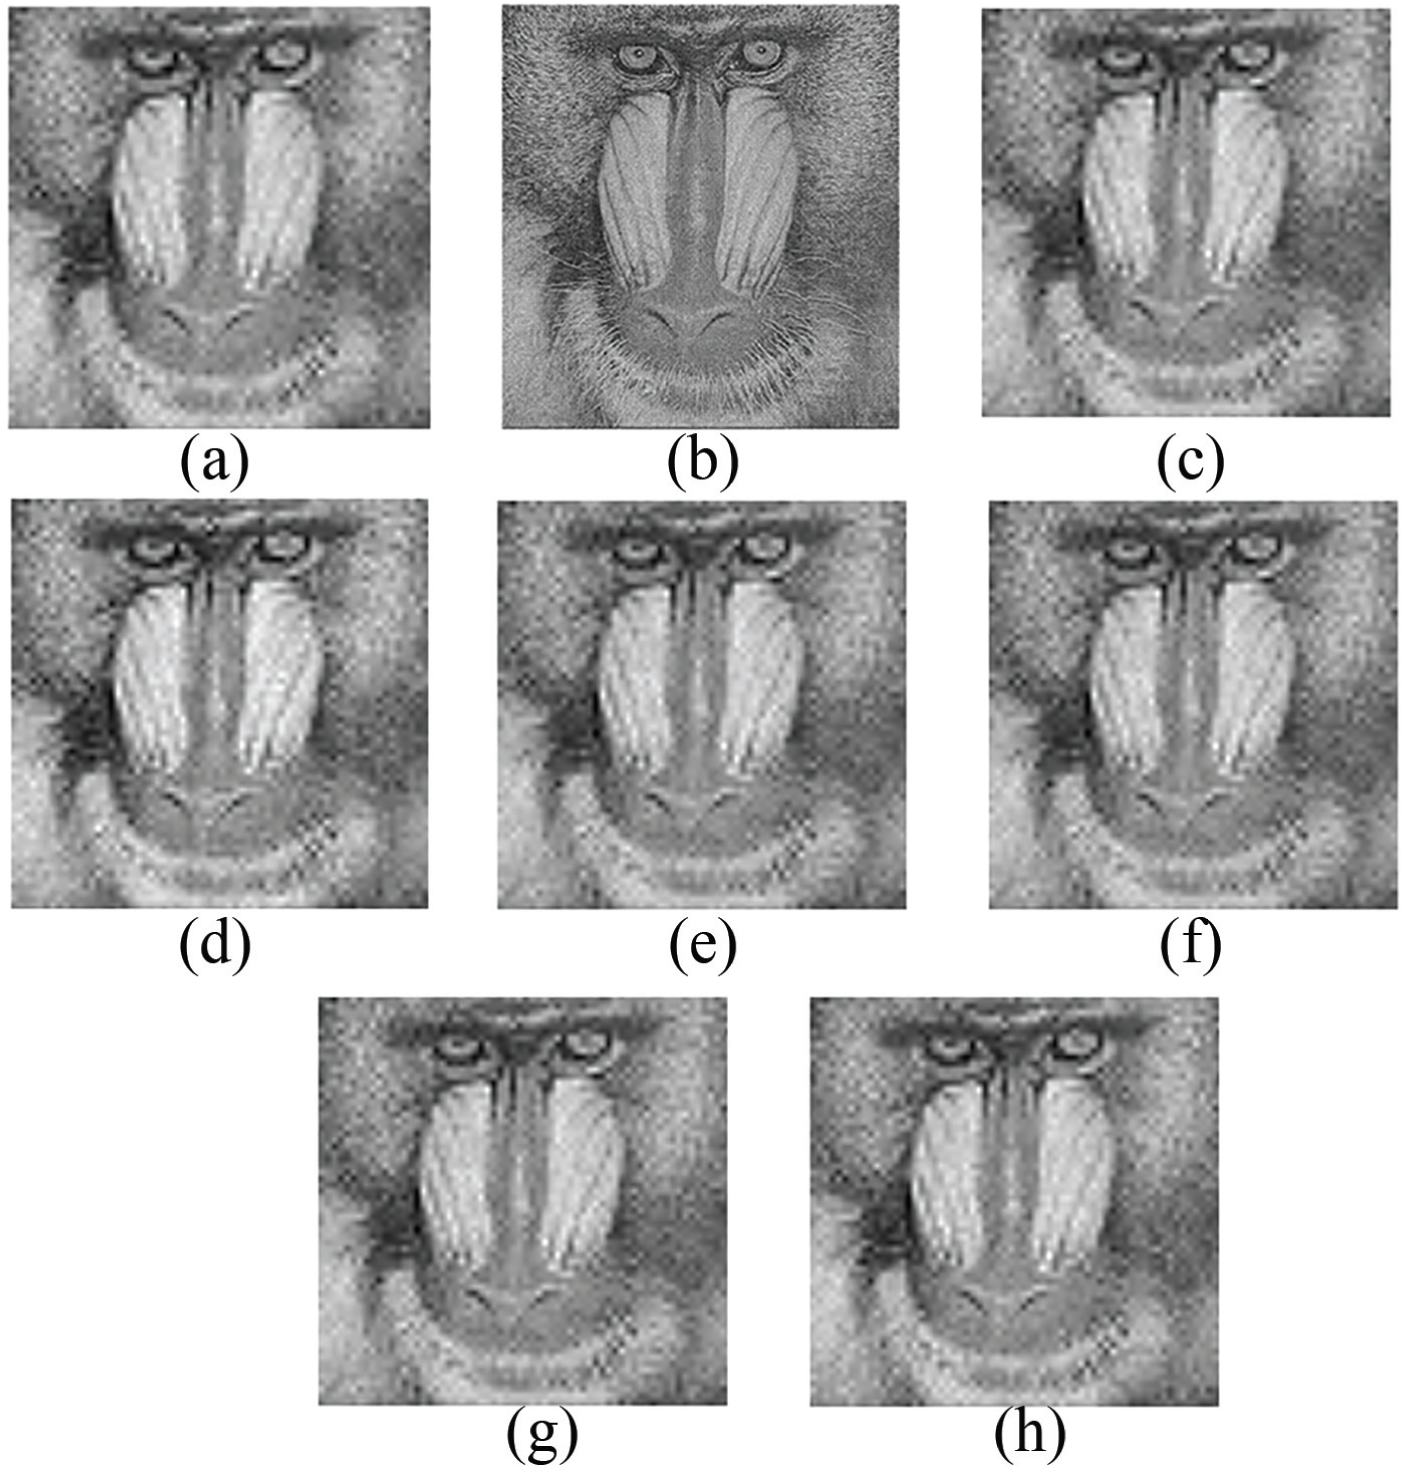
Image Baboon de-noising results and experiment contrast: (a) soft threshold, (b) NWT, (c) SDL, (d) EAF, (e) PNM, (f) EGL, (g) NLG, and (h) the proposed CSDK.

Image Barbara de-noising results and experiment contrast: (a) soft threshold, (b) NWT, (c) SDL, (d) EAF, (e) PNM, (f) EGL, (g) NLG, and (h) the proposed CSDK.
Tables 7–9 show the SNR, NMSE, and SSIM of the original noisy and de-noised image with different de-noising methods. According to Table 7, SNR2, NMSE, and SSIM with our new method are 18.9692, –8.8180, and 0.9846, respectively, which are the largest values among the methods; the soft threshold function has the second largest SNR value (18.9387), followed by PNM (18.8827) and EAF (18.7109). Overall, the table shows that our new method obtains better effect than the other methods.
Comparison of Lena with different methods.
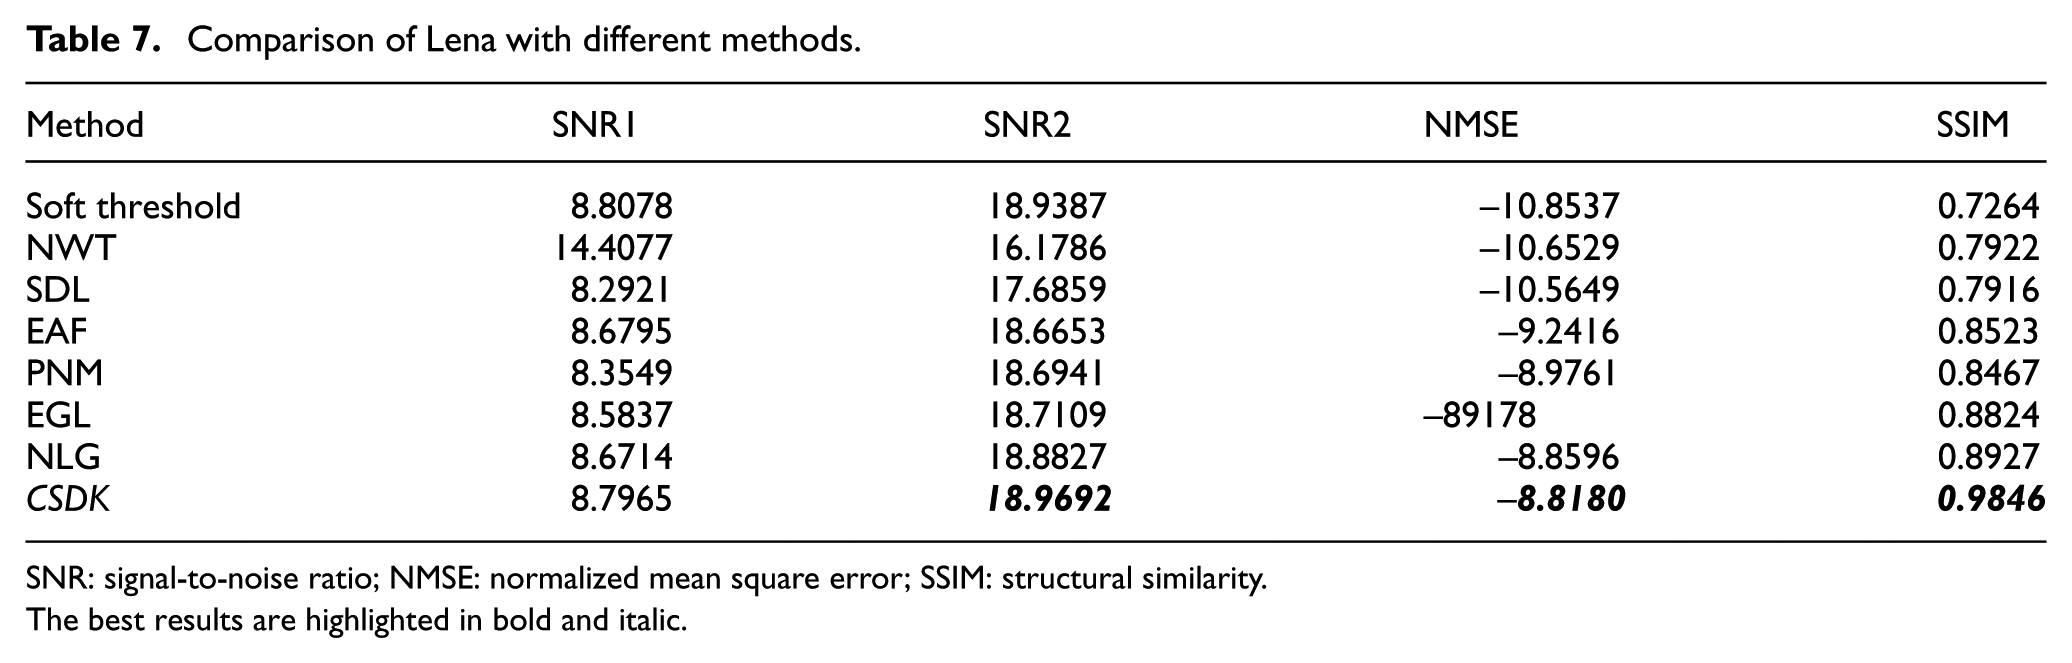
SNR: signal-to-noise ratio; NMSE: normalized mean square error; SSIM: structural similarity.
The best results are highlighted in bold and italic.
Comparison of Baboon with different methods.
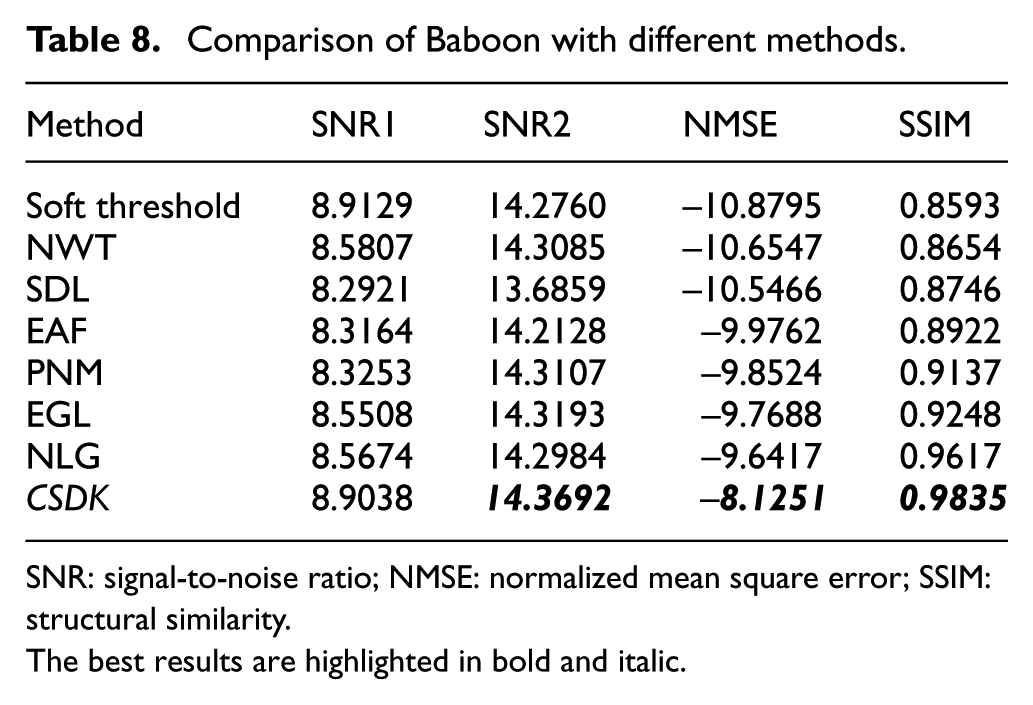
SNR: signal-to-noise ratio; NMSE: normalized mean square error; SSIM: structural similarity.
The best results are highlighted in bold and italic.
Comparison of Barbara with different methods.

SNR: signal-to-noise ratio; NMSE: normalized mean square error; SSIM: structural similarity.
The best results are highlighted in bold and italic.
Similarly, Tables 8 and 9 imply that the new method outperforms the current de-noising methods and successfully recovers the desired images. The values of SNR, NMSE, and SSIM of the proposed adaptive de-noising algorithm are slightly higher than that of the other compared state-of-the-art methods. It shows that the proposed algorithm has a stronger ability to enhance the edges and the texture regions of the image, and preserve the smooth regions of the image while removing the noise.
To demonstrate the robustness of proposed method, we also select three medical images as shown in Figure 19. We add the same noise for them and obtain the de-nosing results shown in Tables 10–12. The results also show that our method is better than other de-noising methods in terms of medical images.

Testing medical images: (a) image 1, (b) image 2, and (c) image 3.
Comparison of image 1 with different methods.

SNR: signal-to-noise ratio; NMSE: normalized mean square error; SSIM: structural similarity.
The best results are highlighted in bold and italic.
Comparison of image 2 with different methods.

SNR: signal-to-noise ratio; NMSE: normalized mean square error; SSIM: structural similarity.
The best results are highlighted in bold and italic.
Comparison of image 3 with different methods.

SNR: signal-to-noise ratio; NMSE: normalized mean square error; SSIM: structural similarity.
The best results are highlighted in bold and italic.
Conclusion
This article proposed a new wavelet threshold function based on the CSDK function for image de-noising. The new idea was embedded in two aspects: introducing the CSDK function into the soft threshold function and improving the shape parameter
Direction of current and future work includes the following:
Continuation on parameter
Speeding up the algorithm can be done using transfer learning method.
Except wavelet soft thresholding, more state-of-the-art de-noising methods can be analyzed and improved.
Footnotes
Handling Editor: Ximeng Liu
Declaration of conflicting interests
The author(s) declared no potential conflicts of interest with respect to the research, authorship, and/or publication of this article.
Funding
The author(s) received no financial support for the research, authorship, and/or publication of this article.