
Abstract
The device-free channel state information indoor fingerprint localization method may lead to phase offset errors, strong fingerprint noise and low sampling classification accuracy. In light of these characteristics, this article presents an indoor localization algorithm that is based on phase difference processing and principal component analysis. First, during the offline phase, this algorithm calculates phase differences to correct for random phase shifts and random time shifts in communication links. Second, the principal component analysis method is used to reduce the dimensionality of the denoised data and establish a robust fingerprint database. During the online phase, the algorithm trains a back-propagation neural network using the fingerprint data and determines the modelled mapping relationship between the fingerprint data and the physical localization after carrying out the phase difference correction and the principal component analysis–based dimensionality reduction. The experiments show that compared with existing fingerprint location methods, this algorithm has the advantages of significant denoising effectiveness and high localization accuracy.
Keywords
Introduction
In recent years, location-based service (LBS) has greatly increased the convenience of our daily lives. 1 According to previous studies, 80% of a human life is spent indoors. 2 Thus, there is a need for more accurate localization service indoors for staff monitoring, supermarket commodity localization, hospital patient calling localization, human traffic condition monitoring and other device-free localization applications. Information on the locations of people has gradually become an urgent problem in the field of indoor location research. The localization accuracy of traditional radio frequency (RF) signals depends on the receiver’s signal quality. Meanwhile, the signals usually used for localization contain noise and various errors. The outdoor line-of-sight (LOS) transmission conditions are vastly superior to those of indoor environments, and these conditions are very important in permitting the linear path propagation of the signal and thus achieving greater accuracy. Therefore, the global positioning system (GPS) has achieved excellent positioning effect in outdoor environment. However, GPS cannot achieve continuous localization in complex indoor environments, as it can outdoors, and it is easily affected by the multi-path effect and increased localization errors.
The wide deployment of indoor Wi-Fi has led to the rapid development of an indoor localization method based on the traditional received signal strength information (RSSI). However, the numeric value of this signal comes from the estimated result in the medium access control (MAC) layer, which causes unstable numerical fluctuations and serious errors; thus, high localization accuracy cannot be achieved using this method. Compared with RSSI, channel state information (CSI) can also be obtained from normal commercial Wi-Fi. Under the surrounding conditions, CSI has a more fine-grained awareness degree and contains a multi-path effect, power attenuation and other information. CSI has been found to be much more stable than RSSI for a given location. 3 In this situation, the indoor localization technique based on CSI signals has become a good choice in solving indoor localization problems. In modern communication techniques based on 802.11n orthogonal frequency division multiplexing (OFDM), some commercial network interface controllers (NICs) that use the 20/40 MHz bandwidth can extract the sub-carrier amplitude and sub-carrier phase from the CSI signal features, and they illustrate the effects of reflection, refraction, attenuation and other superposition errors on every transmission links.
Traditional indoor localization systems using CSI can be divided into two types: first is the geometric location method based on distance and
4
the second is to use the fingerprint database as the standard feature data. The fingerprint-based localization method is divided into two phases: the offline phase and the online phase. The offline phase builds the fingerprint information in the database and compares it with the test point. In the online phase, real-time sampling values are matched with the fingerprint database, which enables us to calculate their precise locations. For example, the fine-grained indoor fingerprinting system (FIFS)
5
exploits a weighted average of CSI amplitudes over three antennas to achieve fine-grained localization, while the amplitudes and calibrated phase information of CSI are exploited by DeepFi
6
and PhaseFi,
7
respectively. Xie et al.
8
propose a CSI-based indoor signal propagation model to estimate the distance between a transmitter and a receiver. Spot-Fi
9
conducts trilateration localization using multiple receivers. The geometric location method has the characteristics of low algorithm complexity and fast computing speed, but it requires at least two nodes to assist in the localization, and its accuracy is entirely dependent on the LOS transmission distance (the quality of the distance accuracy). The fingerprint-based localization method represents another method that is not dependent on the LOS transmission-based measurements and requires only one Wi-Fi access point to complete the localization. Wang et al.
10
uses only amplitude information to conduct the localization, primarily because the signal may display random time offsets and random phase offsets during its transmission in space. PinLoc
11
represents a data-processing method that is intended to reduce the phase offset, but it does not consider the co-existence of random time offsets and random phase offsets. They use a simple transform to achieve sanitization results. For every received channel response, the slope they calculate is the correlation of the difference between the current phase function and the first data when the measurement noise
An indoor fingerprint localization algorithm that is based on principal component analysis (PCA) and phase difference (PD) corrections, that is, the principal component analysis and phase difference sanitization (PCA-PD) algorithm, is proposed in this article. First, the offline phase is used to correct phase information in the communication link. Second, based on PD filtering, the system uses the PCA method to reduce the dimensionality of the data and establish a robust fingerprint feature database. A mapping relationship model between the sampling signal and physical locations is established using a BP neural network in the last step of the offline phase. During the online phase, the final location was estimated through network model computing based on differential phase pre-processing. The final location estimation is obtained by computing real-time sampling values and fingerprint values.
System model and relevant definitions
The localization methods based on fingerprint databases obtain accurate localization results by finding one-to-one correspondences between physical locations and the fingerprint databases, which are constructed using the signal features in real-time sampling. Device-free fingerprint localization means localization without carrying any devices. A BP neural network is employed as the model used in training and classification based on the fingerprint data. This neural network includes an array of mapping collections

where matrix N refers to additional white gaussian noise, whereas H refers to the channel frequency response (CFR); therefore, the CSI matrix can be illustrated as

H is the CSI matrix between the transmitter

Figure 1 shows 100 measurements of 114 sub-carrier phases in channel 1 of the 3 × 1 antenna beams (including one transmitting antenna and three receiving antennas) for a communication system employing the 40 MHz bandwidth. The raw phases of locations 1 and 2 are represented in Figure 1(a) and (b), and their unwrapped phases can be found in Figure 1(c) and (d). From these four panels, we conclude that the CSI phase shows different curves in different propagation environments, which also verifies the localization feasibility and shows that the CSI phase can be used as a signal feature fingerprint.
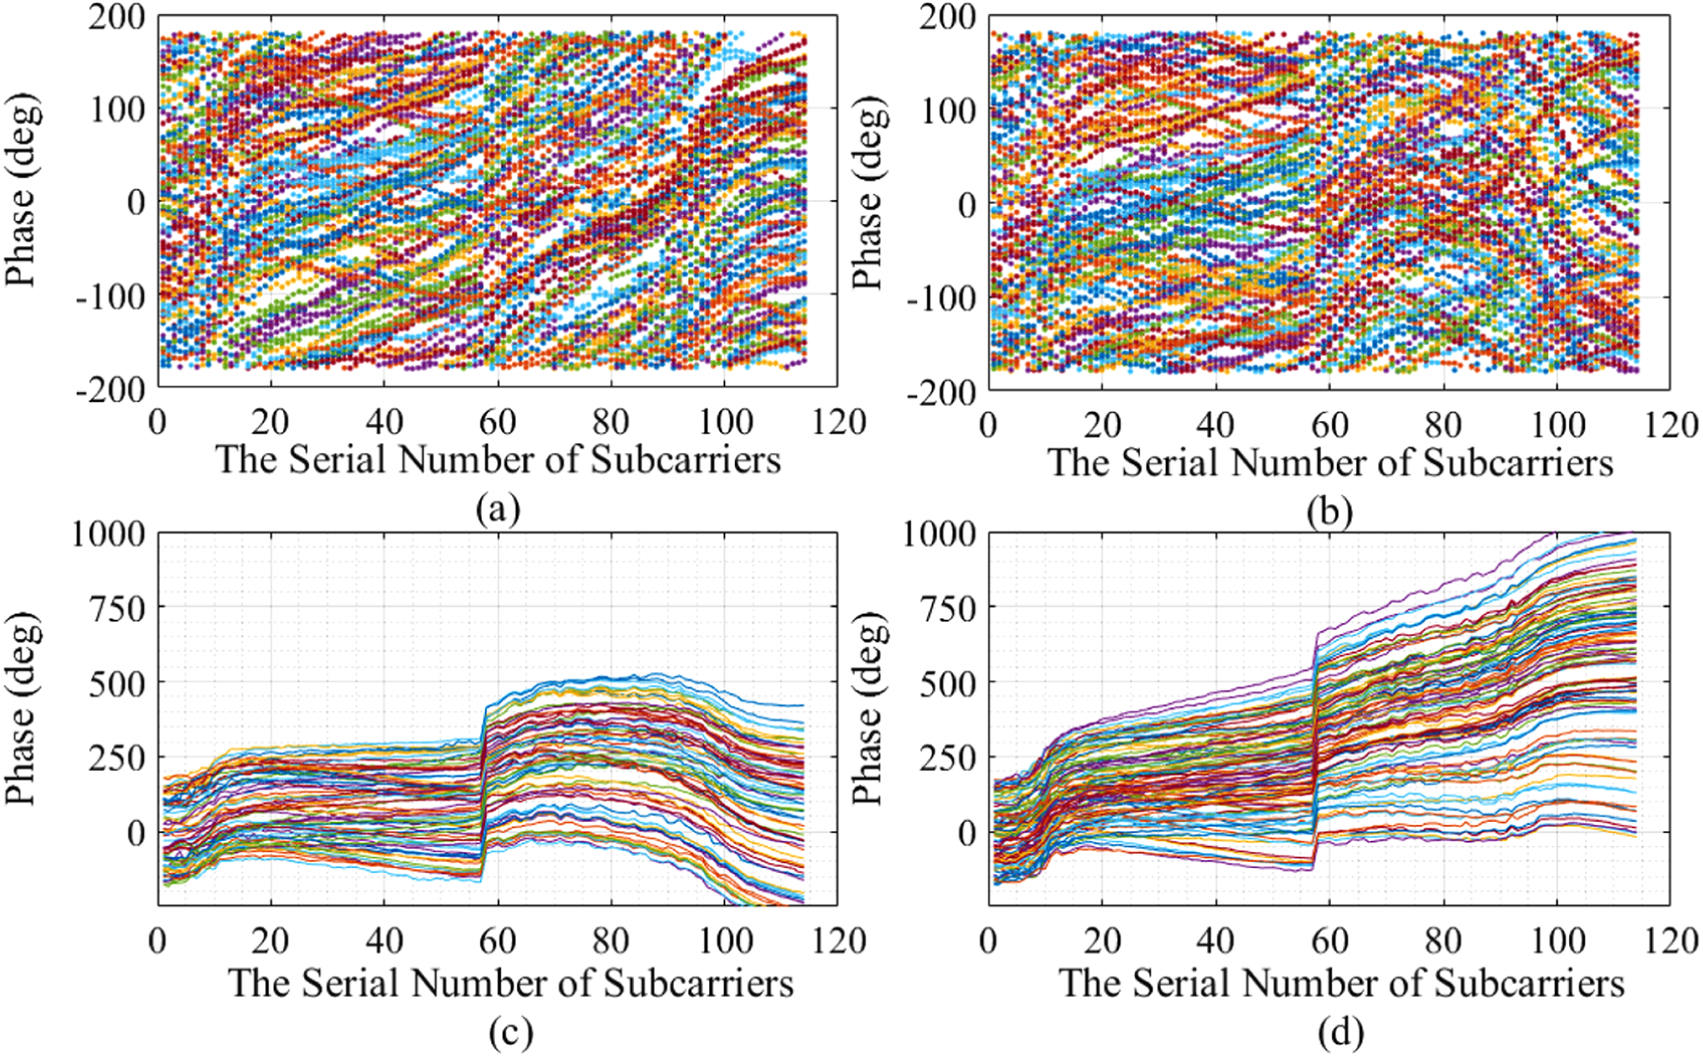
Raw phase and unwrapped phase for two locations: (a) raw phase for location 1, (b) raw phase for location 2, (c) the unwrapped phase for location 1 and (d) the unwrapped phase for location 2.
The noise reduction process includes three stages, specifically inter-group data noise reduction, intra-group data noise reduction and very large reductions in the dimensionality of the data. Inter-group data noise reduction involves removing errors due to continuous sampling, and intra-group data noise reduction involves removing the set
Definition 1
Suppose
Definition 2
Defining
Definition 3
We define the measured phase value

Definition 4
The random time offset and random phase offset of the
Definition 5
We define the phase value difference of the adjacent sub-carrier as

Definition 6
We define the sub-carrier phase correction as

PCA-PD indoor localization system
Localization system architecture
The proposed rules of PD relate to noise reduction between the CSI phase sampling data, and noise reduction of the CSI sub-carriers are very important to the system. As shown in Figure 2, the PCA-PD processing of the characteristic data is conducted in both offline and online phase simultaneously. This processing includes removing errors (specifically inter-group errors) generated during successive data sampling, correcting outliers among each communication link among the sub-carriers (intra-group errors) and PCA reduction of the dimensionality of the fingerprint data. The obtained fingerprint feature information is stored in the database for use in training the BP neural network. The mapping between the phase information and the physical location fingerprints is established through continuous learning and calculation. Finally, during the online phase and after the aforementioned PCA-PD processing has been performed, the real-time test point values of the phases yield estimates of physical locations by supplying inputs to and analysing the outputs from the BP neural network model.

Position system operation framework.
Noise reduction for inter-group errors
The signal received by the receiver changes due to the multi-path transmission effect of the signal, and continuous CSI phase sampling at the same physical position over a short period of time also produces errors. The range of phase values after unwrapping the raw phase is


When Q reaches the minimum value, the following condition is satisfied


Inter-group data denoising process: (a) the sampled phase, (b) the phase difference, (c) the valid phase and (d) the valid phase difference.
From the previous four steps, the error produced between the sampling point values of the phase is removed. By analysing and comparing the differences between the data of the sub-carriers, the incorrect data packets and error packets are removed. This method achieves remarkable results in reducing the noise in the sampled data from the perspective of global optimization.
Noise reduction for intra-group errors
Because the denoising range of the intra-group data depends on the error condition between the sub-carriers, different phases display diverse inter-group error values. The phase error of the offset also exists for all of the data packets. The differences among the sub-carriers in six consecutive data samples are shown in Figure 4(b)–(g), which show the error offset. The error fluctuation point marked by the circle indicates the location where the abnormal phase offset is generated.

Intra-group data denoising process: (a) the unwrapped phase, (b) unstable phase difference in 30th phase, (c) traps point of inverse tangent in 31th phase, (d) unstable phase difference in 32th phase, (e) traps point of inverse tangent in 33th phase, (f) unstable phase difference in 34th phase and (g) traps point of inverse tangent in 35th phase.
At the same time, as shown in Figure 5, sub-carriers 55 and 58 display

Wrapped phase produced
The specific steps used to reduce the above phase error in intra-group data and clearly demonstrate the noise reduction filtration algorithm are as follows:


Dimension reduction and BP neural network model
After noise reduction in inter-group data and in intra-group data, the phase pre-processing method can effectively eliminate noise, and its performance is better than that of other methods. The original phase values are subjected to noise removal in inter-group data and noise removal in intra-group data. The specific steps used to apply PCA to the fingerprint data set to reduce its dimensionality are as follows:


where the A expressed as
The linear transformation matrix composed of the first P largest eigenvectors can then be obtained as W


The system uses a standard BP neural network with a three-layer model structure. This structure includes an input layer, a hidden layer and an output layer. The input layer includes P neuronal cells and represents a simplification of the normalized phase values of the sub-carriers. The output layer includes 25 neuronal cells that represent 25 grid cells at the corresponding locations in the physical grid space. BP neural networks adopt gradient-correction methods to learn their weights and thresholds. Two important aspects that affect the learning efficiency of the BP neural network model are the number of hidden nodes and the learning rate. The level of learning efficiency determines the speed with which the error decreases in the initial stage. At the same time, gradual learning based on the fingerprint data set leads to non-convergence of the learning process and cannot meet the requirements of localization. The system compares the final errors through the choice of parameters and after 3000 epochs for different values of the learning rate and the number of hidden nodes. The 25-grid-cell model training process is as follows:

where l is the number of nodes in the hidden layer, and f is the hidden layer. The algorithm chooses the following function


where


The performance of the model can be determined by comparing the output of a given standard physical location grid number with the output corresponding to the physical location of the grid cell after the BP neural network has been trained. The feasibility of the proposed localization algorithm is verified.
Experimental study
Experimental configuration
The verification of the performance of the algorithm is carried out in an actual experimental scenario. To collect CSI data, three desktop computers are used to realize the functionality of an entire localization system, and these machines are used to represent a transmitter, a receiver and a data processing machine. Two of these machines are equipped with Atheros 9380 NICs and run version 16.04 LTS of the Ubuntu operating system. To transmit to the receiver desktop, the transmitter uses one antenna in the injection mode. The receiver desktop works in monitoring mode to receive data using all three antennas. The data-processing desktop is connected to the router through a cable, and the antenna is connected using a 1.5-m external antenna. The length and width of the experimental site are 15 m × 10 m, and the site contains 5 × 5 grid cells with lengths and widths of 0.96 m × 1.1 m, respectively. These features of the experimental site are shown in Figure 6(a) and (d), respectively. The height of the antenna from the ground is 1 m. The position of the antenna is shown in Figure 6(b) and (c). The parameters of the tool are modified, 17 and the data packet transmission rate of the transmitter is adjusted to 1500 packages per second. A total of 3000 CSI data samples are collected at each position, and the final error is determined after 1500 learning epochs. Finally, the best network learning efficiency is determined according to the error. The different nodes and learning rates used in the actual learning process influence the final error of the BP neural network algorithm. Based on the final error and learning time, the following conclusions can be drawn by analysing the actual data. The number of hidden nodes in this system is set to 21, and the learning ability of the BP neural network is optimized.
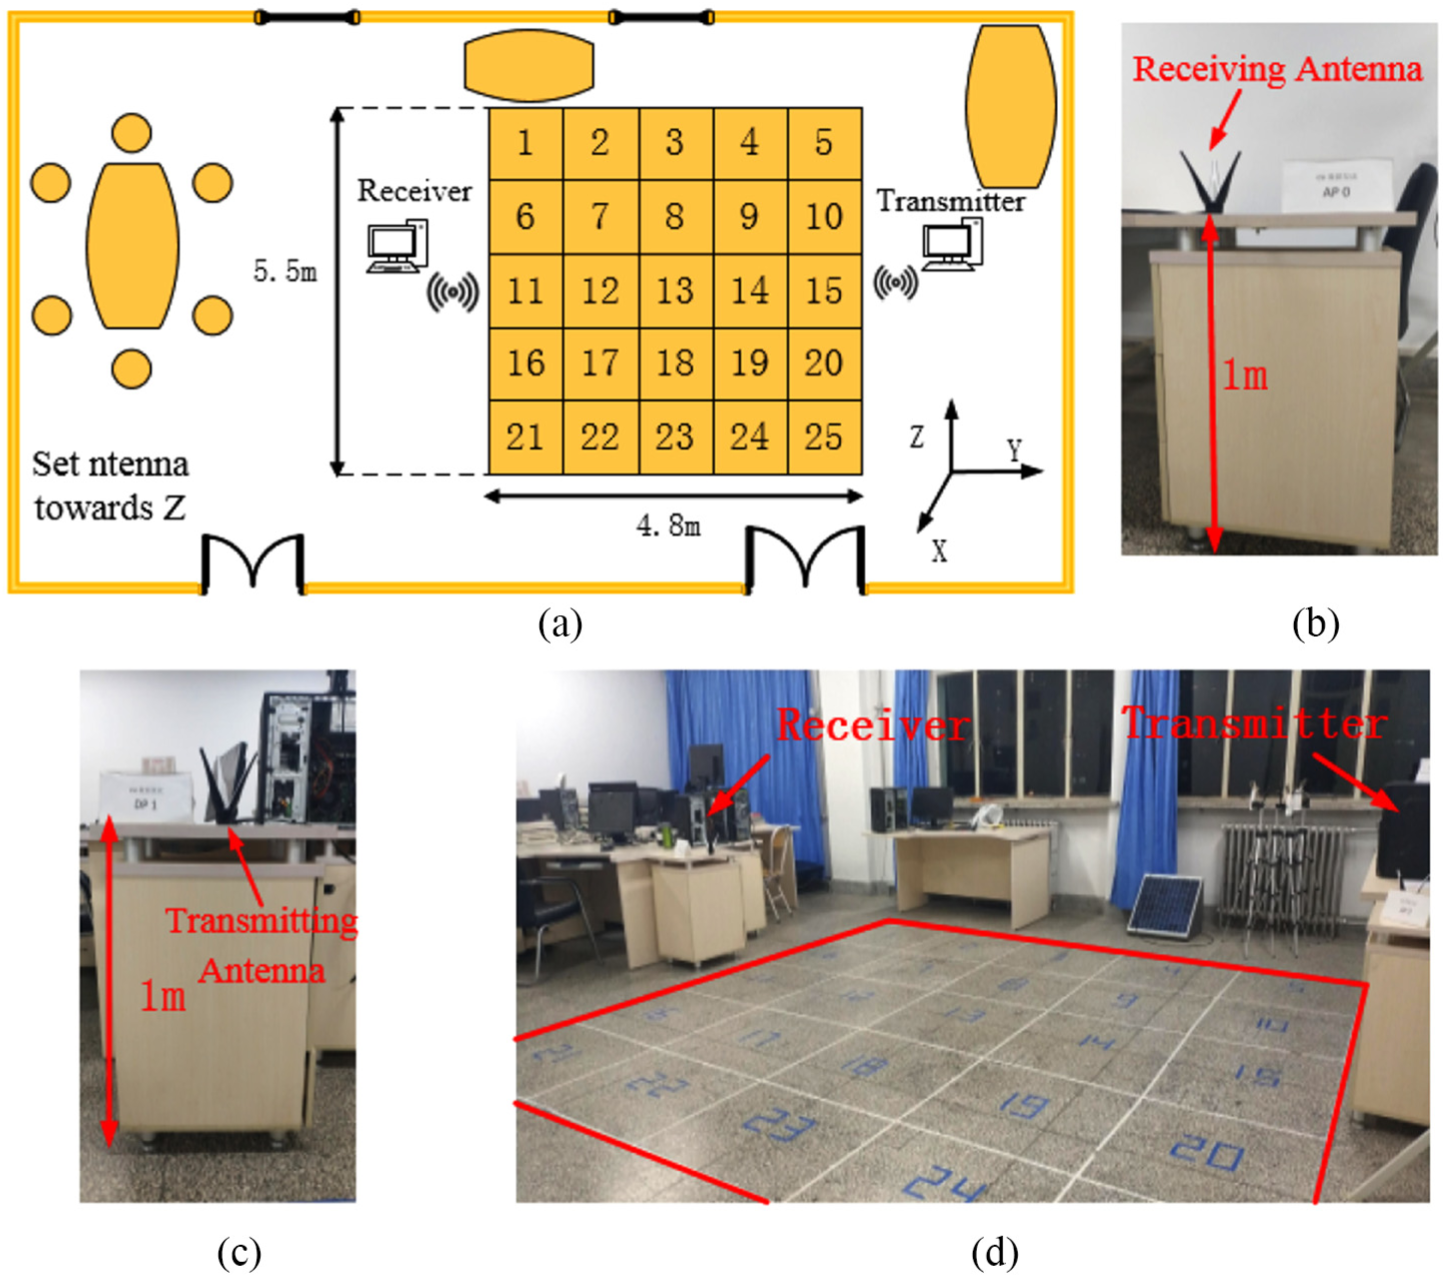
Experimental scene diagram and antenna placement: (a) an overview of laboratory layout, (b) the height of receiver antenna, (c) the height of transmitter antenna and (d) the real experiment scene.
Experimental analysis
Impact of the threshold
on the localization performance
In the PCA-PD noise reduction algorithm, the slope of the curve threshold is preset as the variable point. The size of the variable reflects the degree of data filtering among the sampled values. Changes in this threshold have an impact on the localization performance of the system. When the threshold is set to 0, 0.2, 0.4, 0.6 and 0.8, the filtering effect between single links is shown in Figure 7. As the threshold value increases, the unstable peak of the data shown in Figure 7(b)–(f) reflects a gradual change in the strength of the data in sub-carrier error filtering. Moreover, the data demonstrate a shift from a completely random state to the loss of signal characteristics . This figure indicates that, while the size of the threshold is proportional to the removal of the noise, it is not necessarily proportional to the localization performance of the system. When the threshold is gradually increased, the noise reduction graph of the intra-group error is shown in Figure 7. The error value tends to be flat as the threshold increases, for example, the error fluctuation is extremely slight in the case where the threshold is 0.8. The increase in the threshold illustrates the effect of error value noise reduction; namely, the inter-group error becomes larger. Nevertheless, the enhancement of the effect of noise reduction does not necessarily improve the localization performance of the system. In Figure 8, when the threshold is gradually changed from 0.1 to 0.6, the localization error of the system gradually decreases. While the localization error displays a small increase at 0.4, the overall localization error tends to decrease. In the situation in which the threshold is 0.6, the minimum localization error is 1.15 m and the localization error increases slightly after 0.6.

The influence of the diverse threshold on the error filtering strength: (a) the phase difference for 30th phase, (b) phase difference for

The influence of the threshold on localization error.
According to the overall localization performance of the system, this phenomenon shows that the noise generated during the period of continuous data sampling is more important than the data reduction among the sub-carriers.
Effects of different sample sets on the localization results
The training sample set size of the CSI phase data also affects the localization performance of the system. Given the same environmental parameters, different sample sets are selected to conduct the training. The sampling frequency of the system sample data is 1500 pacakages per second. As shown in Figure 9, the number of samples is set to 1000, 2000, 3000, 4000, 5000 and 6000. The system localization error is shown in Figure 9, which considers threshold values of 0.2, 0.4 and 0.6 and the effects of different training times. When the number of training sets is the same, the localization error with a threshold of 0.2 is always greater than when thresholds of 0.4 and 0.6 are used. As the number of training samples increases, the difference in the localization error between the thresholds of 0.4 and 0.6 is greater. In particular, when the scale of the training sets is 3000, the localization error corresponding to the three thresholds reaches its minimum, and the localization error is 1.15 m when the threshold is 0.6. In summary, when the system selects 3000 sets of sample data, the localization performance of the system is optimized.

The influence of the sampling numbers.
Impact of PCA
A communication link has only 114 sub-carrier values in total. The process of reducing the dimensionality of the data via PCA involves selecting representative values for the 114 sub-carriers. As shown in Figure 10, we select latitudes of 15, 25, 33, 41, 48 and 55 to measure the location performance of the system at different thresholds. In the scenarios in which different thresholds are used, the location accuracy decreases as the dimensionality of the data increases . When p<33 (p is the reduced dimensionality of the data), the localization accuracy achieved for a threshold value of 0.2 is greater than the localization accuracy obtained for threshold values of 0.4 and 0.6. Meanwhile, the localization accuracy represented by the threshold values of 0.2 and 0.4 has an approximate value when p=33. In the cases in which p=41 and p=48, the position accuracy curve represented by the threshold value 0.4 displays a small increase compared to the threshold of 0.2. As p is gradually increased, the three positioning accuracy curves all display decreasing trends, and the localization accuracy also decreases gradually. When p=48, the minimum localization accuracy is obtained for the threshold in all cases, and the minimum localization accuracy is 1.15 m when the threshold is 0.6. For the case in which the threshold is 0.2 and p=33, the localization accuracy is reduced by the maximum degree. When p=48 and the threshold is 0.4 or 0.6, we obtain the largest reduction in the localization error. Compared with p=48, the localization performance of the system for a threshold of 0.6 and p=55 is not obviously reduced; instead, it shows a slight increase.

The influence of the principal component parameter p.
Overall performance of the algorithm
According to the CSI phase information extracted from the communication links of the system, we select uniform environmental parameters for use in the localization methods to verify the performance of the algorithm proposed in this article. As shown in Figure 11, we compare the performance of the proposed system with FIFS, 10 DeepFi, 15 FOS algorithm, 18 PinLoc 11 and LLD method. 12 CSI values are collected from 3000 packages at each position. At the same time, we set the error removal threshold to 0.6 in intra-group data. The cumulative distribution function (CDF) of the distance error is presented in Figure 11, and the mean and standard deviation of the location errors are presented in Table 1. From the Figure 11, it can be concluded that, with the proposed system, approximately 67.2% of the test samples have an error under 1 m and 99.9% have an error under 2 m, while FOS ensures that approximately 53.4% of the test samples have an error under 1 m and 92.6% have an error under 2 m. The localization performance achieved by the PCA-PD noise reduction algorithm is better than that of the FOS noise reduction algorithm. The error cumulative probability of the FOS, DeepFi and FIFS algorithms is 79.2%, 77.8% and 63.7%, respectively, when the localization error is 1.5 m. PinLoc in the existing test experimental environment with movable desktop base, 1-m antenna and 9380 network card achieves 33.4% probability of acuracy when positioning error less than 1 m. Compared with PCA-PD, the LLD method achieves good positioning accuracy when the positioning error is less than 0.7 m, but the positioning accuracy is only 85.6% when the positioning error is less than 1.5 m. Therefore, generalize from overall performance, these localization methods are not able to perform as well as the proposed system. Compared with FOS, the proposed algorithm displays a 12.7% improvement in accuracy. This result shows that the proposed system is efficient in improving the system performance. In the FIFS, the cumulative probability of error is only 63.7% within 1.5 m and less than 80% within 2 m. The aforementioned experiment shows that the proposed algorithm yields better localization performance than the other five algorithms.

The systems overall localization performance.
Comparison of method overall localization performance.

PCA-PD: principal component analysis and phase difference sanitization; FOS: fast orthogonal search; FIFS: fine-grained indoor fingerprinting system.
Table 1 compares the overall localization performance of the four localization algorithms. From the table, it can be concluded that the average errors of FOS, DeepFi and FIFS are 1.5955, 1.7932 and 2.3601 m, while the average error corresponding to this algorithm is 1.4223 m and the standard error is 1.1511 m. Compared with other algorithms, the average localization error of the proposed algorithm is reduced by 10.86%, 20.68% and 39.73%. The algorithm features higher localization accuracy and smaller errors, and it can be effectively applied to indoor localization. The proposed algorithm has a localization accuracy of 67.7% at 1 m, which corresponds to an improvement in localization accuracy of 14.3%, 27.66% and 29.92% when compared to the other methods.
Related works
The literature on wireless localization based on RF fingerprinting is wide; hence, we will only discuss the major results on the topic. Several wireless systems have been used to apply the concept of RF fingerprinting for localization, including the most common Wi-Fi networks, 19 but also radio-frequency identification (RFID) technologies,18,20 bluetooth17,21 and ultra-wideband (UWB).22,23 A combination of wireless technologies can be used to improve localization accuracy. 24 RF fingerprinting can be carried out using received signal features, in particular signal strength, such as RSSI, reference signal received power (RSRP), reference signal received quality (RSRQ) and CFR/CSI or equivalently the channel impulse response (CIR).4,6,25,26 Time of arrival (TOA), timing advancing (TA), time difference of arrival (TDOA) and angle of arrival (AOA) are less frequently used in fingerprinting-based approaches.27,28 In addition to using wireless signal processing methods, many researchers have tried a variety of approaches to improve positioning problems in the field of indoor localization. As with all communication mediums, there are other mediums, such as geomagnetism,29,30 visible light 31 and simultaneous localization and mapping (SLAM). 32
Conclusion
In this article, an indoor fingerprinting localization algorithm that is based on PCA-PD and BP neural networks is proposed. The algorithm uses the PCA-PD data sanitization method as the pre-processing method to denoise the original position feature information and obtain good data with localization features. In the online phase, the real-time measured CSI values are classified using a BP neural network model. The back propagation neural network and phase difference (BP-PD) algorithm is verified experimentally in a 5 × 5 grid space in a real environment. The performance of the PCA-PD, FOS, DeepFi, FIFS, PinLoc and LLD methods are compared, and the impact of the threshold
Footnotes
Acknowledgements
The authors would like to thank the reviewers for their thorough reviews and helpful suggestions.
Handling Editor: Yu Wang
Declaration of conflicting interests
The author(s) declared no potential conflicts of interest with respect to the research, authorship, and/or publication of this article.
Funding
The author(s) disclosed receipt of the following financial support for the research, authorship, and/or publication of this article: This research was funded by the National Natural Science Foundation of China under Grant Nos. 61762079 and 61662070, and Key Science and Technology Support Program of Gansu Province under Grant Nos. 1604FKCA097 and 17YF1GA015.