
Abstract
Lamb wave–based structural health monitoring technology has attracted great interest and wide attention. Most of the Lamb wave–based structural health monitoring algorithms utilize scattering signals subtracted between baseline and current signals, which are recorded before and after damage and are easily influenced by environmental changes. In this article, a baseline-free method based on similar path is proposed to identify the damage in metal and composite structures. Due to Lamb wave scattering on damage, the first wave packet of signal for the transmitter–receiver path passing through or near the damage will be weakened. Based on sensor spacing (and direction for composites), all transmitter–receiver paths of transducer array can be classified as some groups, each having similar paths. The first wave packet energies of the paths in the same group are compared with each other to calculate damage indices, which are used to image the damage. Simulations were carried out to identify single- and multi-damages in the metal and composite plates. In addition, an experiment was also conducted to verify the algorithm. Both simulation and experimental results demonstrate the feasibility and effectiveness of similar path-based damage identification method.
Introduction
Advanced composites, taking the advantages of high-strength- and stiffness-to-weight ratios, have been becoming the most dominant materials for aircrafts. The application level of composites has been considered as one of the vital indices to evaluate the advancement and market competition of the new generation of aircraft. For instance, weight ratio of composites on Joint Strike Fighter F35 is about 36%, while that is 50% on Boeing B787 and up to 52% on Airbus A350XWB. Primary structural parts of these aircrafts, such as fuselage and wing, are manufactured by composite integral molding methods.
However, comparing with metal structures, there are much more damage types for composite, such as delamination, fiber breakage, and matrix crackling. Especially, due to weak interlayer performance, when some unavoidable low velocity impact happens in the manufacture process and service, barely visible impact damage (BVID) occurs and weakens mechanical properties of composites. Structural health monitoring (SHM) technology, by installing sensors on the aircraft structures and real-time monitoring damages in structures, is a modern and promising technology for ensuring safety of aerospace structures, especially large-scale composites. 1
Among different SHM technologies, ultrasonic Lamb wave–based methods show big advantages since Lamb wave is able to propagate a long distance and suitable to monitor large-scale structures by using a small number of sensors. 2 In this technique, Lamb waves are generated/received by small-size transducers, like piezoelectric transducer, 3 electromagnetic acoustic transducer, 4 and some other transducers.5,6 Generally, due to complex characteristics such as multiple modes, disperse, multiple reflection, and mode conversion at material and geometry features, it is very difficult to carefully interpret and separate each wave mode from a Lamb wave signal. 7 Conventionally, before in-service, that is, when structures are considered as undamaged, one set of Lamb wave signals must be acquired as baseline. When structures are in service and need to be inspected, another set of Lamb wave signals is acquired. Advanced signal processing methods are used to compare two sets of Lamb wave signals, and the difference of signals is calculated and used to identify the damage. Damage imaging/identification algorithms relying on baseline signals have been extensively studied. Nevertheless, there are challenges for the real application of these algorithms using baseline signals. Environmental changes, like variations of temperature and load level, greatly influence Lamb wave signals.8,9 The effect of environmental variation on Lamb wave may submerge the change of signal caused by damage.
In order to eliminate environmental influence, many studies on environmental compensation, such as baseline signal stretch (BSS), 10 optimal baseline subtraction (OBS), 11 adaptive filter method, 12 and data-driven method, 13 have been reported. On the other hand, some baseline-free methods, which do not need baseline signals but directly identify the damage by using current signals, have also been proposed. Sohn et al., 14 Miao et al., 15 and Feng and Zhou 16 made use of time-reverse method to calculate damage index of each sensor path, and image the damage by Lamb wave tomography algorithm. Yuan’s team17,18 developed a time reversal imaging method to make all scattered signals focus on the damage source to reveal the damage. However, time reversal method often requires a programmable transducer array to synthesize time-reverse signals simultaneously, which limits its application due to the complexity and cost of hardware system. Kim and Sohn 19 proposed a method to calculate the power of mode conversion at the damage location, and when the power is larger than statistical noise power, it is considered that there exists damage in the structure. However, this method cannot further locate and quantify the damage. Lee et al. 20 proposed a baseline-free method, named adaptive source removal algorithm, and its essence is to generate baseline signals by a physical mode and compare them with current signals, which limits its application on complex structures. Recently, some nonlinear ultrasonic-based baseline-free methods21,22 were proposed to detect the damage in structures, but nonlinear ultrasonic Lamb wave is difficult to be generated and easy to be submerged by other nonlinear phenomenon, for example, instrumental nonlinear and contact nonlinear at the fixture. Qiu et al. 23 proposed an online updating Gaussian mixture model, a statistical method, to eliminate time-varying factors and track the damage growth, but this method is not suitable for damage location of large-scale plate-type structures but damage tracking of small hotspot area.
When propagating in structures and encountering a damage, Lamb wave will be reflected or scattered, causing significant reduction of energy of the first wave packet in the former propagating path, as shown in Figure 1. This phenomenon is utilized to develop a method to identify the damage in plate-like structures.
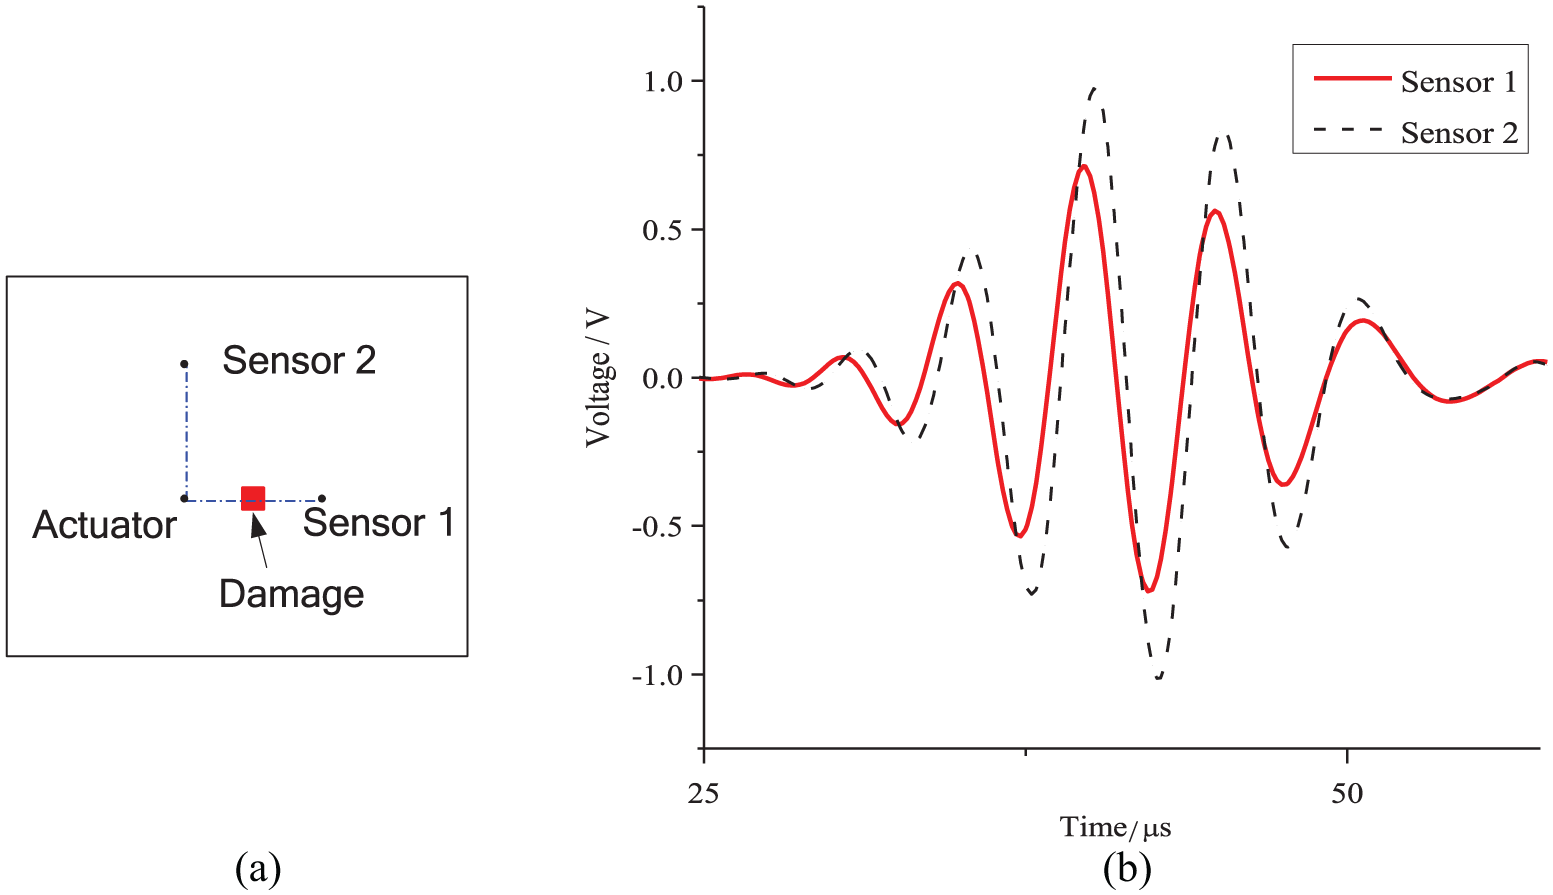
The difference of signal between damaged and undamaged paths: (a) the schematic diagram of the model and (b) the signals.
This article proposes a baseline-free damage detection method based on similar paths. According to the differences of sensor spacing (and propagating direction for composites), transducer array is divided into some groups, each having similar paths. This method utilizes Matching Pursuit (MP) algorithm to extract the energy of the first packet in each path. If the energy of one path is obviously lower than other paths in a group of similar paths, this path is considered as the damaged path. The greatest energy of signal in a group of similar paths is assumed as the reference, and then damage index in each path is defined for damage imaging. An enhanced reconstruction algorithm for probabilistic inspection of damage (ERAPID) is developed to image the damage in structures.
The innovation of this article is to identify the possible damage in the structure without baseline data by using a simple and effective algorithm based on signal comparisons among similar paths, although these similar paths must be defined by carefully considering the geometric and material configuration of monitored structure and designing the sensor layout.
Signal processing and damage index
All paths in the transducer array are divided into some groups of similar paths by sensor spacing (and propagating directions for composites). When one wave propagating path passes through the damage, the amplitude of the first Lamb wave packet of signal for this damaged path is weakened due to wave scattering at the damage, compared to the other paths in this group of similar paths. In this article, MP algorithm is utilized to extract energy of the first wave packet and define damage index based on time–frequency energy.
MP algorithm
Due to multi-mode property and complex scattering, reflection, and transmission of Lamb wave in structures, overlap phenomenon of wave packet in Figure 2 is much common in Lamb wave–based SHM. MP algorithm could be used to divide the first wave packet from complex signals.

The overlap phenomenon of Lamb wave packets.
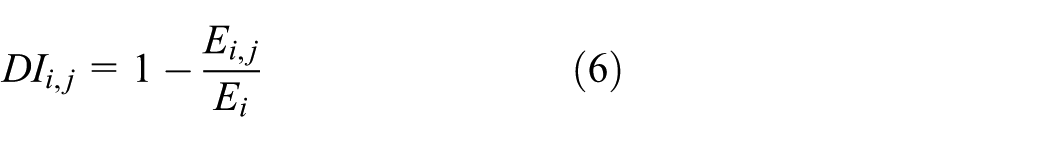
MP algorithm is an adaptive signal processing method. The algorithm first establishes an extremely large dictionary of wave shape. The analyzed signal is iteratively studied to find the one atom that has the biggest inner product with the signal, then subtract the contribution due to that atom, and repeat the process until the signal is satisfactorily decomposed. MP algorithm overcomes the shortcomings that window function is fixed in the short-time Fourier transform, and frequency parameter is inversely proportional to scaling parameter in wavelet transform. Smartly expressing the signal by matching the time–frequency property, the algorithm has been extensively applied in various fields, such as image processing, biomedical signal processing, seismic signal processing, and SHM.
The core problem of MP algorithm is to build a huge redundant dictionary library and quickly retrieve the best matching atoms.
24
Suppose that
where
In this article, MP algorithm adopts Chirplet atom

where Gaussian window
For a real Lamb wave signal, a real time–frequency atom must be used to get real expansion coefficients and Chirplet atom has a real form

where
The Wigner distribution of Chirplet atom

The time–frequency energy of a real Lamb wave signal f(t) can be represented as a sum of Wigner distribution of each Chirplet atom

As shown in Figure 3, by using MP algorithm, the first wave packet of the complex signal in Figure 2 can be extracted by only three iterations and then is used to calculate time–frequency energy.

Extracting the wave packet and calculating time–frequency energy by using MP algorithm: (a) extracting the first wave packet from the complex signal and (b) time–frequency energy of the extracted signal.
Damage index
Based on regular Lead Zirconium Titanate (PZT) transducer array, Lamb wave propagation in each transmitter–receiver path in structures is measured. If the sensor spacing of one path is equal to another (the same direction is needed for anisotropic), consider these two paths as similar path with each other. A group of similar paths may contain two or more transmitter–receiver paths. When one path in a group of similar paths passes through the damage, the energy of the first wave packet of this path must be lower than the other paths in this group of similar paths.
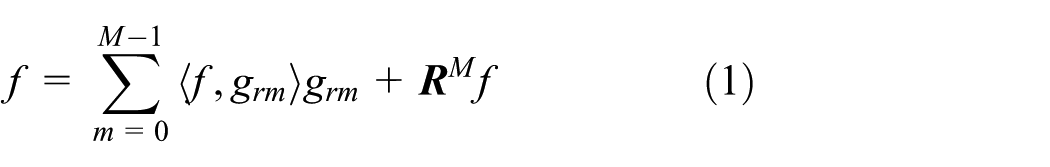
Assuming the maximum energy of first wave packets of all paths in a group of similar paths as reference, this path with maximum energy is considered as undamaged path, and its damage index is 0. The other paths in this group of similar paths will be used to compare with the reference. If the energy of some path is lower than the reference, consider this path passing through or near the damage. Damage index is defined as
where i denotes the ith group of similar paths, and j represents the jth path in some group of similar paths. Ei denotes the reference of the ith group of similar paths, that is, the maximum energy of first wave packets of all paths in the ith group of similar paths.
In the real application, the first wave packet is often mixed with the other wave modes or the reflection from the boundary. Thus, two points need to be considered for extracting the first wave packet. The first is that the sensor spacing of two sensors should be larger than a minimum distance so as to distinguish S0 wave and the other wave modes. Another is that the sensor should have a minimum distance from the boundary. In this article, MP algorithm is used to extract the first wave packet. The study conducted by Feng et al. 25 shows that MP algorithm has a significant ability of distinguishing mixed wave packets even with a time distance 0.01 ms for 250 kHz. Under this condition, the above two points may be weakened. Taking the group velocity of S0 and A0 mode at frequency 250 kHz as 6000 and 2000 m/s, for example, the minimum distance of sensor spacing and the minimum distance between the sensor and the boundary are both 3 cm, which is easy to implement for sensor layout.
Imaging algorithm
A reconstruction algorithm for probabilistic inspection of damage (RAPID) has been developed to study damage detection, growth monitoring, and location mapping with transducer arrays. 26 This method removes some shortcomings of the past computer tomography methods, which is generally considered as time-consuming and insensitive for sparse transducer array. This article introduces an image-enhancing factor and proposed an ERAPID. Compared with RAPID, ERAPID will give a more perfect image to show the damage in complex structures.
Based on damage index of each transmitter–receiver path calculated by the similar path method, the probabilities of each pixel point are summed as follows

where

In equation (8),

where
The contours of the distribution estimation are a set of ellipses with the transmitter and receiver being at two focal points. When
Damage detection in a metal plate
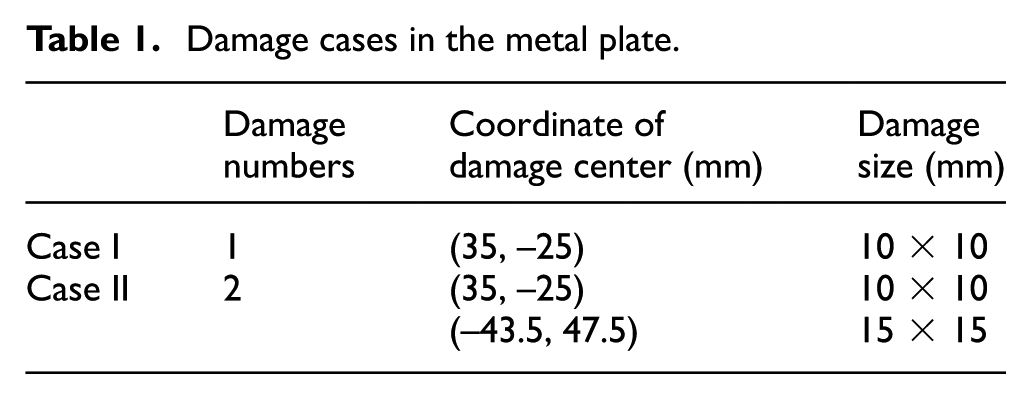
Finite element method based on ABAQUS Standard is employed to study Lamb wave propagation in structures. Considering an aluminum plate with dimension of 350 mm × 300 mm × 2 mm in Figure 4, 12 PZT transducers are mounted as a regular circular array on the surface of the plate. The diameter of the circular array is 200 mm. PZT transducer has diameter 10 mm and thickness 0.5 mm. Taking the center of circular array as the coordinate origin, two damage cases are set on the plate with locations and dimensions in Table 1. Baseline-free method based on similar paths is employed to identify the damage.
The schematic diagram of the metal plate.
Damage cases in the metal plate.
A five-peaked Hanning windowed sinusoidal toneburst, with central frequency 200 kHz, is applied into 12 PZT transducers, S1–S12, as exciting signal, respectively. Meanwhile, signals of the other transducers are measured. There are 12 × 11 = 132 voltage signals in total. Since aluminum is isotropic, sufficient conditions of similar path only need the equal sensor spacing of transmitter–receiver paths. Thus, all paths are separated as six groups of similar paths, as shown in Table 2.
Similar paths in the metal plate.

Detection of single damage
When there is only one damage (Case I: Damage 1 in Figure 4), the comparison of typical signals in one group of similar paths is shown in Figure 5. It can be seen that there is an obvious difference between the first wave packets of undamaged path S1–S5 and damaged path S3–S11, which is caused by damage scattering. However, the path S1–S5 and the path S2–S6 are neither not passing through the damage, so their first wave packets are in coincidence with each other.

Signal comparison in similar paths: (a) signal comparison of undamaged and damaged paths in similar paths and (b) signal comparison of two undamaged paths in similar paths.
Based on MP algorithm, first wave packets of all paths are extracted and used to calculate time–frequency energy. Figure 6 shows time–frequency energy histograms of the fourth and sixth groups of similar paths in Table 2. It can be shown that damaged paths, for example, S10–S2, S11–S3, and S6–S12, have an obviously lower energy than undamaged similar paths in the group.

Time–frequency energy of some group of similar paths at Case I of the metal plate: (a) the fourth group of similar paths and (b) the sixth group of similar paths.
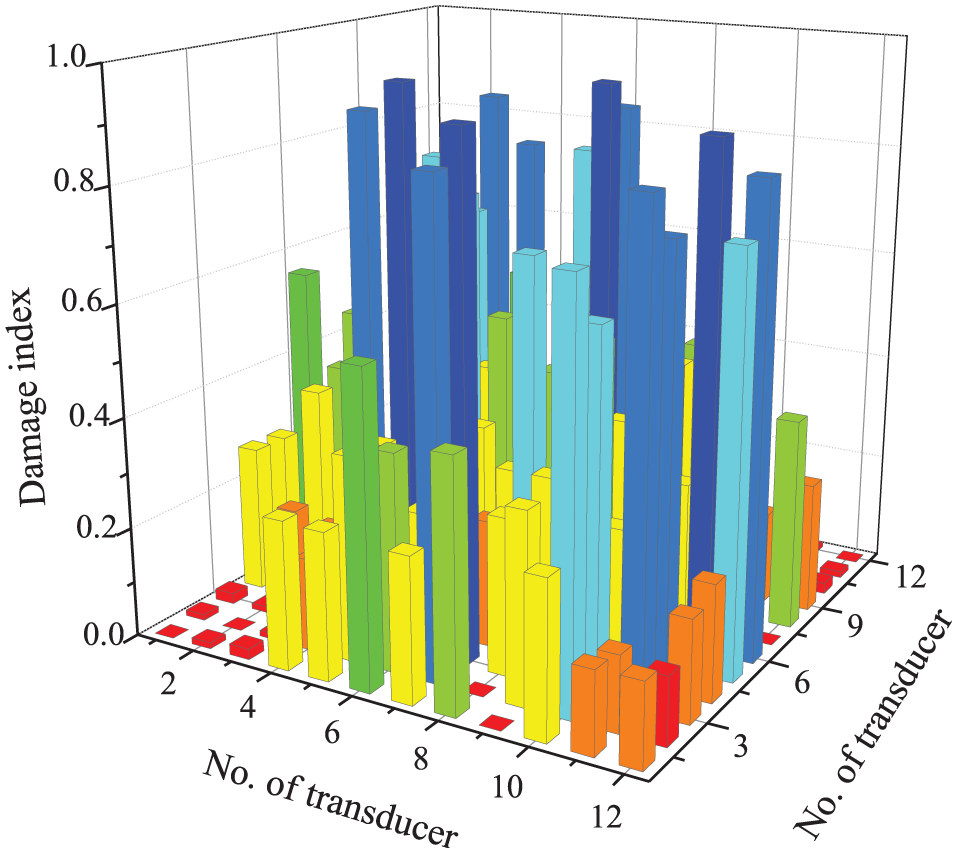
Maximum energy in each group of similar paths is extracted and used to calculate damage index of each path. Damage index histogram of all paths is given in Figure 7, which obviously shows that damage indices in the damaged paths are much larger than undamaged paths.

Damage index at Case I of the metal plate.
ERAPID is used to image the damage based on the damage index in Figure 7. When
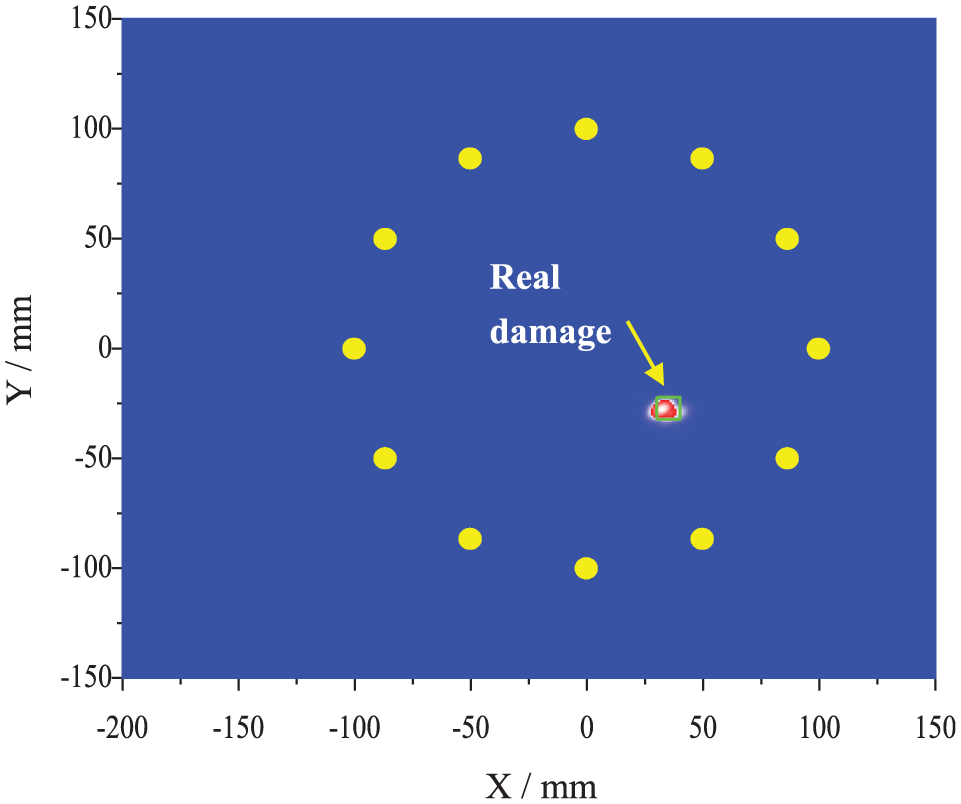
Damage imaging at Case I of the metal plate.
Detection of double damages
When the metal plate has two damages (Case II: both Damage 1 and Damage 2 in Figure 4), Figure 9 shows the time–frequency energy histograms of the fourth and sixth groups of similar paths like in Figure 6. It can be seen that compared with Case I, more paths in Case II have lower energy due to two damages.

Time–frequency energy of some group of similar paths at Case II of the metal plate: (a) the fourth group of similar paths and (b) the sixth group of similar paths.
Figure 10 gives damage index of all paths, which shows that numbers of paths with large damage index are much more than Figure 7. When
Damage index at Case II of the metal plate.

Damage imaging at Case II of the metal plate.
Damage detection in composites
For anisotropy, group velocity of Lamb wave in composites depends on the propagation direction, which increases the difficulty of damage identification. For ERAPID in this article, when transducer array is circular, its paths are shown in Figure 12(a). However, for baseline-free method in composites, if there are only transducers on the circumference, paths through the array center have their similar paths, but those not through the array center do not. Then, there is a blind district near the array center as shown in Figure 12(b).
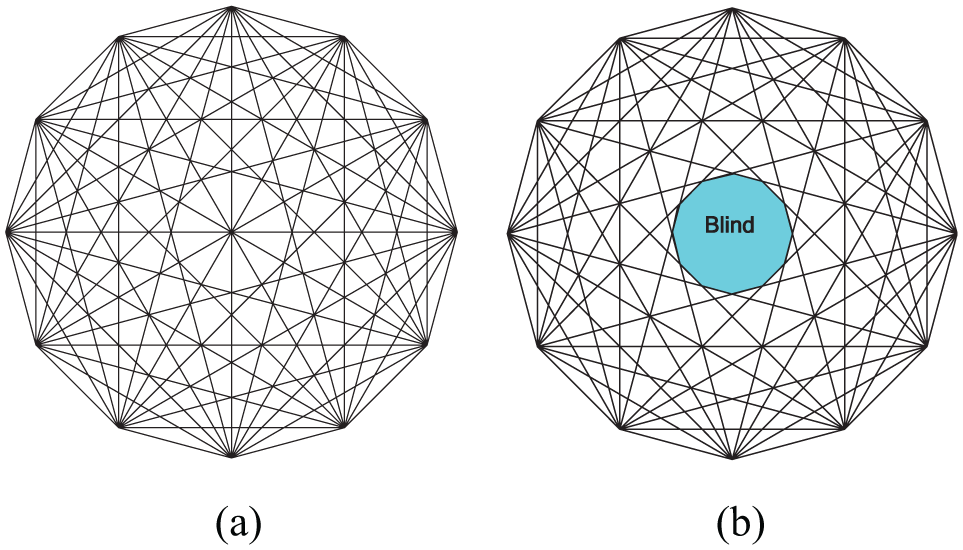
A blind district present for only circumference transducers in composites: (a) all paths for ERAPID and (b) blind district for baseline-free method.
In order to eliminate blind district, damage index in paths not through the array center must be considered. In addition to regular transducer array on the circumference, another transducer is considered to set at the array center, and similar paths and damage index are defined as follows:
For paths not through the array center, the same sensor spacing and direction are used to divide similar paths. Based on the method as given in the “Damage detection in a metal plate” section, damage index in these paths is calculated.
For paths through the array center, for example, Transducers A and B are at two sides of the array diameter, and a Transducer C is set at the array center. Paths A–C, C–A, B–C, and C–B are defined as a group of similar paths, whose time–frequency energies of the first wave packets are extracted by MP algorithm. Based on maximum energy, damage indices of all paths in the group of similar paths are obtained. The mean value of damage indices in paths A–C, C–A, B–C, and C–B is defined as damage indices of paths A–B and B–A in ERAPID.
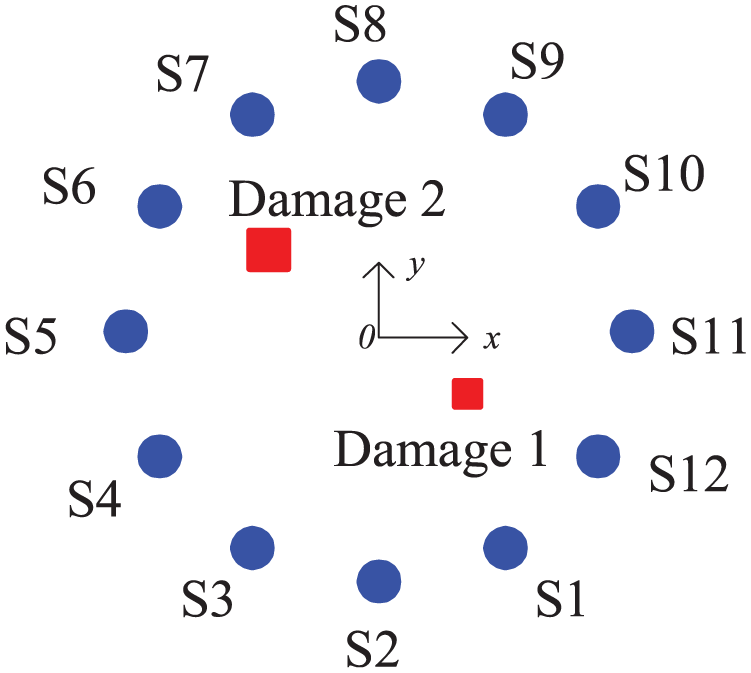
A composite plate is considered in the simulation. The plate has dimensions of 350 mm × 300 mm × 2 mm and its material is IM7/5250-4 graphite–epoxy laminate with ply stacking sequence [45/-45/0/90]s. The location (150 and 200 mm) apart from the left-bottom corner is taken as the array center, around which PZT transducers named as S1–S12 are uniformly distributed on the circumference with radius 100 mm. Another PZT transducer named S13 is set at the array center. Taking the array center as the coordinate origin, a hole with dimensions 10 mm × 10 mm, as a damage, is set on the location (–25 and 35 mm) (Figure 13).
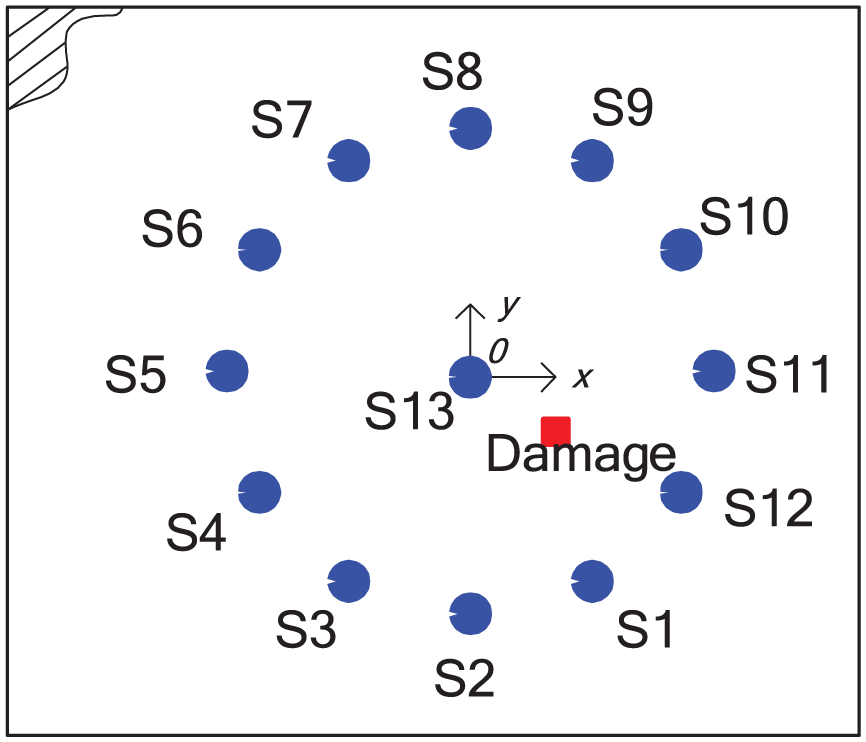
The schematic diagram of the composite plate.
Similarly, a sinusoidal toneburst with central frequency 200 kHz is applied into 13 PZT transducers, S1–S13, as exciting signal, respectively. Meanwhile, signals of the other transducers are measured. There are 156 (13 × 12) voltage signals in total. All paths are separated as 29 groups of similar paths not through the array center and 6 groups of similar paths through the array center, as shown in Tables 3 and 4, respectively.
Similar paths not through the array center.

Similar paths through the array center.

Figures 14 and 15 give some signal comparisons between two similar paths through and not through the array center. It could be seen that the first wave packets of damaged paths have an obvious change by comparing with the related undamaged similar paths.

Signal comparisons between similar paths not through the array center: (a) comparison between two undamaged similar paths and (b) comparison between undamaged and damaged similar paths.

Signal comparisons between similar paths through the array center: (a) comparison between two undamaged similar paths and (b) comparison between undamaged and damaged similar paths.
Based on MP algorithm, first wave packets of all paths are extracted and used to calculate time–frequency energy. Figure 16 shows time–frequency energy histograms of groups A1 and A15 in Table 3, and groups B1 and B5 in Table 4. It can be shown that damaged paths, for example, S1–S3 and S1–S5, have a significantly lower energy than undamaged similar paths in their similar group.

Time–frequency energy of some group of similar paths in the composite plate.
According to the calculation method of damage index proposed in this section, damage index for paths through and not through the array center can be obtained as shown in Figure 17. When

Damage index in the composite plate.
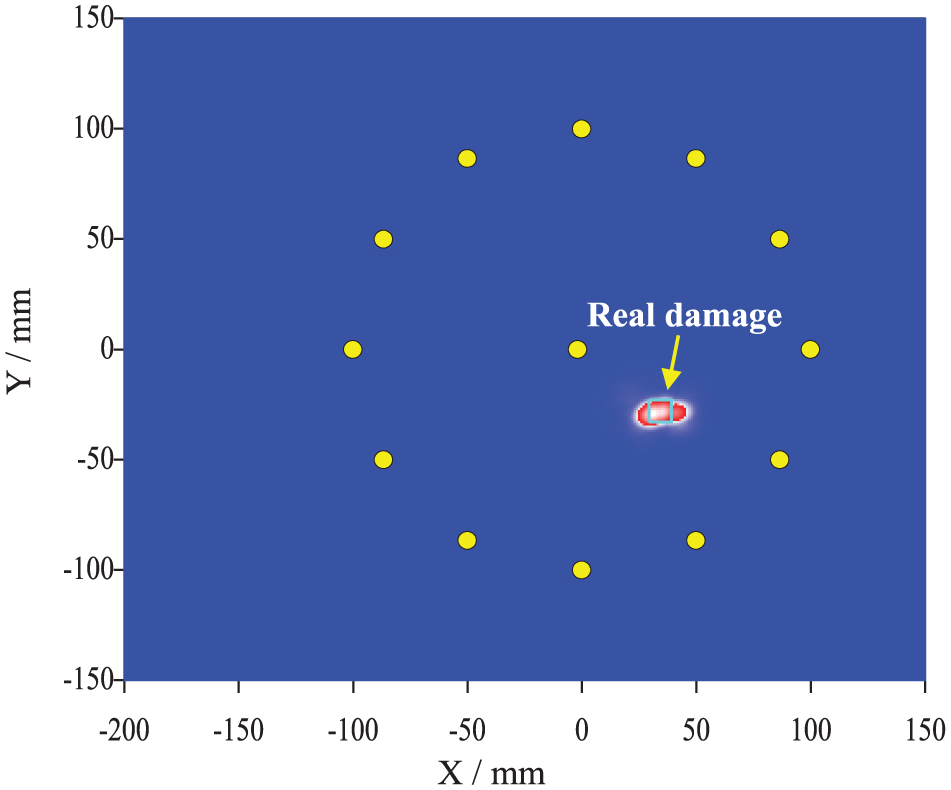
Damage imaging for the composite plate.
Experimental verification
An experiment was conducted to verify the effectiveness of the proposed damage imaging algorithm. As shown in Figure 19, 13 PZT sensors were surface-bonded on a composite plate with dimensions 600 mm × 600 mm × 3 mm, which was made of T300 with plies [0/45/90/-45/0]3s. An experimental system, consisting of a wideband power amplifier KH-7600, a charge amplifier YE5853, an arbitrary function generator NI PXI-5442, a scope NI PXIe 5122, and NI LabVIEW software, was established for data acquisition.

Experimental setup and sensor configuration: (a) experimental setup and (b) PZT sensor configuration.
Similar with simulation study, among 13 PZT sensors, 12 sensors were placed around a circle with diameter 200 mm, while one sensor was at the center of the circle. Similar paths same as Tables 3 and 4 were adopted. However, the signal acquired by PZT sensor is sensitive to shear modulus and thickness of the adhesive. In this experiment, there were three skills to enable the similarity of each group of similar paths. First, piezoelectric sensors not only have same dimensions and material properties but were chosen with the same electric capacity (1.30 pF). In addition, two skills were adopted to reduce the signal difference due to the adhesive difference. One was to reduce air content in the adhesive to ensure the consistency of the shear modulus of adhesive, which can be realized by vacuum drying oven. The other was to ensure the consistency of the adhesive thickness by using the same polyimide film, on which a hole was cut with diameter slightly smaller than the diameter of PZT sensor. The hole edge was cut with a small crack. When PZT sensor was installed on the surface of the plate, the film with the hole was first placed on the location, where the sensor and the hole had the same circle center. Then, the sensor with adhesive was pushed as large pressure as possibly above the hole so that the additional adhesive went out through the hole-edge crack of the film. These three skills were employed to enable the consistency of the similar paths.
In the experiment, a sinusoidal toneburst with central frequency 250 kHz was selected as the exciting waveform. A hole was cut on the composite plate as a real damage shown in Figure 19(b). It can be seen from Figure 20 that in a typical similar path group A6 shown in Table 3, signals along paths S2–S7 and S7–S2, which pass the damage, have an obvious change of amplitude and phase compared with undamaged paths S1–S8 and S8–S1. In contrast, acquired signals in group A17, in which there are no paths passing the damage, have the same first wave packets shown in Figure 21.
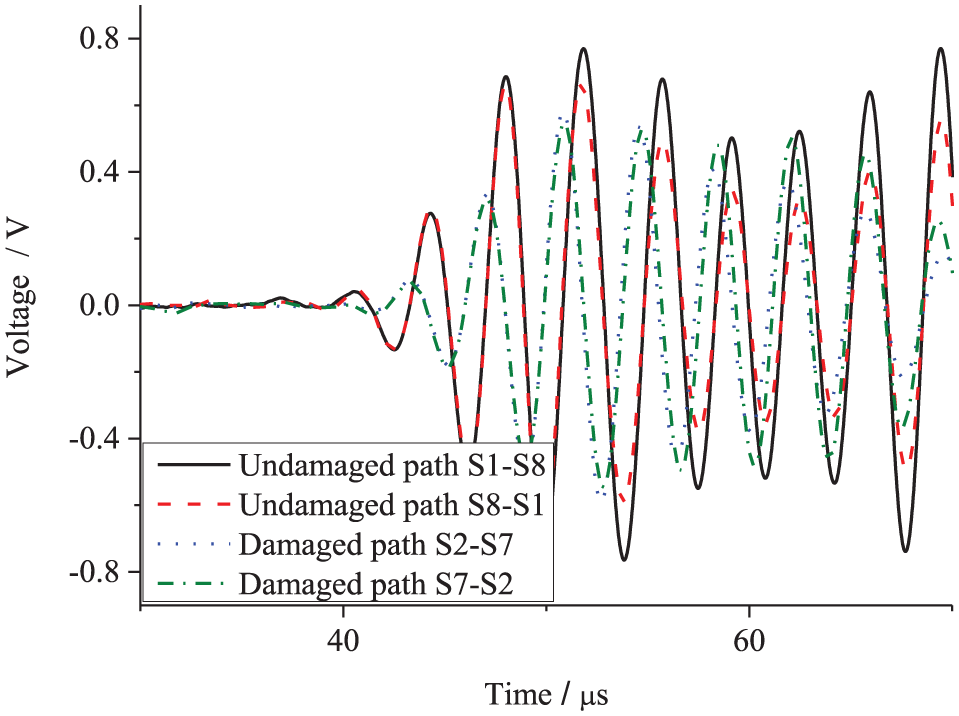
Acquired signals in the similar path group A6.

Acquired signals in the similar path group A17.
Figure 22 shows the damage index of each path calculated by the proposed algorithm. It denotes that some paths passing the real damage have relatively large value, while the other paths have slightly small value. When

Damage index in the experiment.

Damage imaging in the experiment.
Conclusion
According to the regular transducer network, a baseline-free method based on similar paths is proposed to image the damage in the plate structures. By different separate method of similar paths, the proposed method has been verified to be able to predict the location and size of the damage in both metal and composite plates. Both simulation and experimental results demonstrated that the method has the capability to identify single- and multi-damages.
The developed baseline-free method needs a dense sensor array to identify the accuracy location and size of damage. For a complicated damage, the size of damage is difficult to be determined with few sensors. This is a common problem for most of the guided wave-based SHM methods. However, the information of an approximate location and size (or even only location) of damage identified is still useful for large-scale structures.
However, when this baseline-free algorithm is applied on the structure with complex geometric configuration, the geometry and material of structure must be carefully investigated to determine the sensor layout so that similar paths can be defined. For some structures without any regular geometric and material configuration, no sensor layout can be used to define similar paths, and algorithms with baseline data need to be employed to identify the damage.
Footnotes
Acknowledgements
The authors also acknowledge the support of Xiamen Key Laboratory of Optoelectronic Transducer Technology, and Fujian Key Laboratory of Universities and Colleges for Transducer Technology.
Handling Editor: Kenneth Loh
Declaration of conflicting interests
The author(s) declared no potential conflicts of interest with respect to the research, authorship, and/or publication of this article.
Funding
The author(s) disclosed receipt of the following financial support for the research, authorship, and/or publication of this article: This research was supported by the National Key Research and Development Program of China (Grant no. 2016YFF0203002), National Natural Science Foundation of China (Grant nos. 11472308 and 51475067), and the Natural Science Foundation of Fujian Province (Grant no. 2018J05094).