
Abstract
In this article, water and fertilizer irrigation system of tea plantation was developed to ensure stable yield, quality of tea, and appropriate irrigation and fertilization. Wireless sensor network node and gateway node are designed and deployed in the tea plantation for collecting soil moisture in real time. Each of the sensor nodes was composed of a STM32F103ZET6 microprocessor and a CC2420 transceiver module. Microcontroller S3C2410X is the kernel of hardware platform in the gateway nodes. All data were transmitted by wireless sensor network. The images of the tea leaves are collected by the high-speed camera loaded onto the unmanned aerial vehicle for analysis of the tea deficiency. The monitoring system is mainly used to display the humidity information about each node, the switch status of the water pump, the battery valve, and so on. It is convenient for user to manage the tea plantation. System configuration and parameter modification can be configured through the monitoring system. The dynamic time warping algorithm is used to judge the abnormal situation of the system. Diamond deployment is used in the network, and the networking experiments were conducted comparing with random deployment. Result showed that both time delay and congestion of network increased as the network scale varied from 5, 10, and 15 to 20 nodes. The topology stabilization time gets prolonged simultaneously. Packet loss rate decreased while data transmission interval varied from 10, 20, and 30 to 40 s. Packet loss rate values in diamond deployment are lower than those in random deployment. In order to improve the accuracy of tea deficiency detection, data fusion technology was adopted. A block-based histogram is employed and similarity distance is adopted to confirm the diagnosis of absence of one or more nutrients of tea. The image information and the spectral information are acquired. The principal component factor is extracted and input into the back propagation neural network to judge the quality of the tea. The number of principal component factors of image information and spectral information is set to six and three; the overall recognition rate reached 97.8%. Therefore, the level of the system abnormality can be determined by the dynamic time warping distance. Test results indicate that it is possible to accurately determine whether tea is deficient and accurately determine whether the system data acquisition is abnormal.
Introduction
The soil of tea gardens in the mountains and hills is thin, poor in water retention, and strong in permeability. Coupled with the characteristics of seasonal rainfall unevenness, it often causes seasonal drought and lack of fertilizer in tea garden production. In order to solve the problem, water-saving irrigation techniques are used in many tea plantations. However, there is a lack of scientific irrigation schemes. When and how much water and fertilizer is applied is generally determined by experience based on weather conditions, and there is a large blindness. Due to the irrational use of chemical fertilizers and pesticides, the resource and environmental problems are becoming more and more prominent. 1 At the same time, there is a decrease in the cultivated land resources, serious shortage of water resources, and serious environmental pollution. 2 In order to ensure the stable yield and quality of tea, tea gardens need timely and appropriate irrigation and fertilization. The precise application technology of water and fertilizer integration is a new agricultural technology that integrates irrigation and fertilization for precise irrigation and fertilization. The fertilizer liquid which can be evenly and accurately input into the root soil of the crop is blended by solid fertilizer or liquid fertilizer and water in a certain ratio. Then, it can effectively control the amount of irrigation water and fertilizer application and improve the efficiency of water and fertilizer use. By controlling the amount of irrigation, fertilization, irrigation, and fertilization time, it can not only effectively improve the utilization rate of water and fertilizer resources but also help to increase production, save resources, reduce environmental pollution, and improve labor productivity.3,4 Appropriate temperature and humidity are the key factors to ensure the yield and quality of tea. However, due to the complicated tea planting environment and geographical conditions, it is difficult to effectively monitor and control the relevant key factors. With the development of information technology, the traditional monitoring methods can no longer meet the development needs of modern agriculture. Wireless sensor network (WSN) is a self-organizing network system formed by wireless communication by deploying sensor nodes in a dangerous monitoring area or complex environment that is not suitable for human work or traditional monitoring methods. WSN has been widely used in various fields. Applying WSN for tea garden drought monitoring can reflect the impact on the physical world on the growth, development, and maturity of tea trees in a more accurate and timely manner. Compared with traditional drought monitoring, it has the advantages of low cost, easy maintenance, and monitoring without human resource restrictions.
Intelligent water and fertilizer irrigation system based on the Internet of Things (IOT) technology, Zigbee technology, and Android technology uses sensors to collect parameters such as temperature, humidity, conductivity, and PH value, which are sent to the server via WSN, and monitors the growth environment of crops in real time. Meanwhile, the system can also control electromagnetic valve after decision on precision water and fertilizer irrigation of crops.2,5–7 A system of automatic fertigation and data acquisition designed based on programmable logic controller (PLC) and human–machine interface (HMI) for citrus roots can realize intelligent fertilization in accordance with plant growth rule. 8 The precise irrigation control system was developed based on proportional–integral–derivative (PID) control technology which is used to propose a solution for the precise control problems of water and fertilizer solution concentration in the process of agricultural irrigation. 9 Irrigation control equipment was developed combining PID control, fuzzy control, 10 and gray prediction control, which achieved the meticulous control of the irrigation. 11
The United States is now the world’s largest micro-irrigation area. In irrigated agriculture, 60% of potatoes, 25% of corn, and 33% of fruit trees use water and fertilizer integration technology. California has established a comprehensive water and fertilizer integration facility and service system, which has become a typical modern agricultural production system for high-value agricultural products in the world. As early as 1960, Israel began to fertilize through drip irrigation systems, and now more than 90% of crops are fertilized by drip irrigation systems. The countries where the application of water and fertilizer integration technology is more popular in the world are France, Australia, Spain, and so on. Irrischeduler was developed to indicate the time for irrigation based on the soil moisture level. 12
If tea lacks nutrients, it will influence the yield and quality of the tea, and even the production. When tea leaves lack nutrients, it is difficult for experts to confirm the diagnosis if the symptoms are not clear or complicated. Especially in the early stage of the disease, some symptoms are easily confused and not easy to identify. Computer vision technology is used to determine symptoms early, and then take appropriate steps to reduce production losses. 13
Sasaki et al. 14 proposed the automatic diagnostic system that uses spectral reflectance and filtered images for plant disease. Threshold segmentation method proposed by Honami Nobuo is used to segment pathological leaves of the mushroom that lacks micronutrients such as calcium, magnesium, and iron. However, RGB histogram shape features and positional features are not representative, and the segmentation effect is not ideal. 15 Back propagation (BP) neural network training and classification methods are used to establish tea quality. 16 Chen et al. 17 proposed a new method of tea identification based on soft independent modeling of class analogy pattern recognition theory, which is feasible with computer vision identifying tea categories based on the tea color characteristics. Wang et al., 18 Cai, 19 Borah and Bhuyan, 20 and Gejima and Nagata 21 have successively identified the color change with computer vision technology during tea processing and storage. Luypaert et al. 22 and Schulz et al. 23 used near-infrared spectroscopy to detect the quality and chemical composition of green tea, and Antonio et al. 24 used pattern recognition technology to classify tea based on differences in trace elements in tea. Fan 25 used multi-sensor information fusion for inspection of Longjing tea quality based on hyperspectral analysis and image manipulation. There are insufficient studies to identify the lack of nutrients in tea, based on the use of computer vision technology. Therefore, this article seeks to analyze the condition of tea nutrients using computer vision technology.
Some scholars have conducted different degrees of research, only focusing on tea classification and quality level. There are no reports on the absence of nutrients in tea, and therefore personalized water and fertilizer irrigation is applied. In this article, a system for water and fertilizer irrigation of tea plantation is presented. This system can not only transfer the basic information including humidity information, switch status of the water pump, and the battery value but also monitor the status of tea leaves in the high-speed camera loaded onto the unmanned aerial vehicle (UAV). In addition, dynamic time warping (DTW) algorithm is utilized to judge the abnormal situation of the system and use BP network to judge the status of tea leaves. A block-based histogram is employed and most similarity distance is adopted to confirm the diagnosis of lack of one or more nutrients of tea.
The soil moisture of the tea garden was obtained in real time through the soil moisture sensor node deployed in the tea plantation, and the images of the tea leaves were collected by the UAV carrying the high-speed camera, and all data were transmitted back to the upper computer for nutrient analysis and moisture analysis. Precision fertilization and precision irrigation are carried out according to the analysis results, which provide a reference for improving the scientific and technological level of domestic tea industry in production and management.
System structure
The production management level of tea plantation is relatively backward, which results in low quality of tea. Therefore, it is necessary to introduce advanced information technology to improve the scientific management level of tea plantation. Tea trees are densely planted, mostly in mountainous areas and sloping fields, and there are many communication obstacles such as telephone poles and other trees in tea gardens, which limit the communication distance of wireless sensor nodes. It is therefore difficult to carry out large-scale information collection and control. In order to collect information on large-scale tea plantation, regional monitoring methods are adopted. All data are collected by sensor nodes, and the sink node is responsible for collecting the data collected by the regional sensor node and transmitting it to the base station. In order to capture images of large areas of tea, it is necessary to use high-speed camera loaded onto the UAV, which also is responsible for exchanging information with all gathering nodes to achieve integrated control of water and fertilizer.
Sensor nodes in WSNs typically contain microcontrollers, sensors, wireless transceiver circuits, and power modules. In order to effectively and long-term monitor the soil moisture of tea plantation, the WSN nodes are divided into host computer nodes, slave computer nodes, and route nodes. Their common feature is the fact that they are connected to the DS3231 high-precision real-time clock chip, which is used for time synchronization between nodes and wakes up nodes at regular intervals to save battery power of routing nodes. 26
In order to obtain images of the tea tree, a high-speed camera needs to be mounted on the UAV. At the same time, it is necessary to install a wireless sensing module to realize information communication between the UAV and the slave computer node and the routing node (Figure 1).

Block diagram of wireless sensor module mounted on the UAV.
A block diagram of host computer node is shown in Figure 2, which includes a 32-bit microcontroller STM32F103RBT6, which transmits data through the serial port, and a wireless transceiver module CC2430, which is specifically used to receive network data and transmit data to the microcontroller through the peripheral component interconnect (PCI) bus. If the microcontroller is not connected to the computer, the data can also be saved in the built-in SD card and displayed through the thin-film transistor liquid crystal display (TFT LCD).
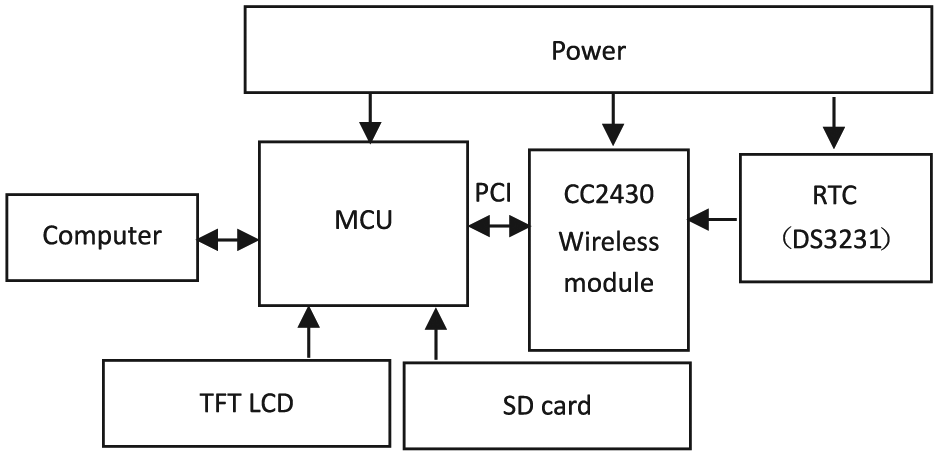
Block diagram of host computer node.
The block diagram of slave computer node is shown in Figure 3. All lower level machine nodes are powered by the same battery, which is charged after being regulated by the solar panel. The signal conditioning circuits are different for each lower computer node except for connecting dissimilar sensors.

Block diagram of slave computer node.
A block diagram of the route node for forwarding data is shown in Figure 4, which is powered by a lithium iron phosphate battery. It forwards data collected by sensor nodes to the next routing node according to a predetermined routing protocol until the data reach the upper computer node. The node uses a timed sleep and wake-up mechanism to save battery power and extend node life.

Block diagram of route node.
The sensor node collects the soil moisture in real time. If the value of a certain irrigation area is lower than the threshold value, an instruction is sent to route node to open the water pump to implement water irrigation.
The UAV flies according to the planned path and takes images of the tea tree, and then submits it back to the server for analysis. The image is compared with the standard image in the database to determine whether the tea tree is deficient. If the tea lacks nutrients, open the solenoid valve of the water pump of the pool and fertilizer, mix it according to a certain ratio, and then deliver it to the designated irrigation area for irrigation. The system structure is given in Figure 5.

Block diagram of the system.
Hardware design
Regulator circuit
To provide power for the microcontroller circuit, sensor circuit, host computer node circuit, and so on, a regulator circuit is developed. The regulator circuit diagram is given in Figure 6.

Regulator circuit diagram.
Voltages of +5 and +3.3 V are achieved by LM7805 and AMS1117-3.3. DC voltage of +VCC is input to the input terminal regulator chip LM7805. After filtering, the output terminal produces high accuracy, stability, and good DC output voltage. The voltage of +5 V is employed to the backlight display of the LCD screen of the host computer node and the soil moisture sensor. The voltage of +5 V is employed to CC2430 wireless modules and microcontrollers of all nodes.
Signal processing circuit
MTX50A online infrared thermometer is used to measure the canopy temperature of the tea. The output of 4–20 mA current signal needs to be converted into 0.5–2.5 V signal that can be processed by a single-chip microcomputer and then can be converted into the corresponding temperature signal for CC2430’s own A/D. The output voltage of the TDR-3 soil moisture sensor is 0–2.5 V, which requires no conditioning and is directly converted by the ADC of the CC2430 wireless module.
The integrated temperature and humidity sensor DHT11 are used to measure the air temperature and humidity of the tea garden. As the output signal is a digital signal, it can be directly related to the I/O port of the CC2430 for processing. The DHT11, using a dedicated digital module collection technology and a temperature and humidity sensor technology, is the integration of a digital temperature sensor and has high reliability and stability. We can use simple single-bus communication between DHT11 and SCM. DHT11 works under 5 V supply voltage and has a maximum average current of 0.5 mA. It has a precision of ±5% humidity and ±2°C temperature and resolution of 1% humidity and 1°C temperature. The DHT11 temperature and humidity sensor diagram are shown in Figure 7. The low-power amplifier AD623B is adopted for the amplifier circuit, 13 which is shown in Figure 8.
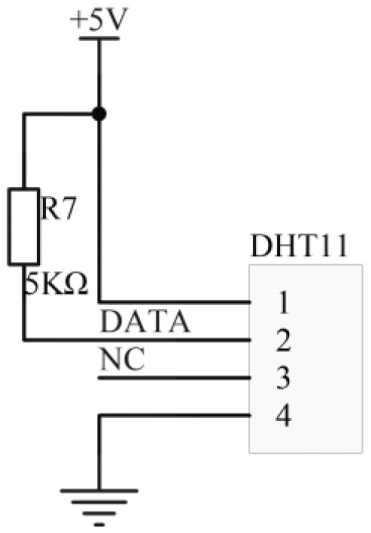
DHT11 diagram.

Amplifier diagram.
The magnification can be calculated by formula (1)

where
Software design
The core program includes a host computer node, a slaver computer node, and a route node program. They are composed of the initialization program, protocol stack configuration, networking mode configuration program, processing layer setting program, transmitting program, and receiving program.
For the route node program, a new network is established after initializing CC2430, the protocol stacks, and then the ID number and channel number of the network are determined. Uninterrupted monitoring is always going on. If a new device requests to join the network, a network address is assigned to approve it to join the network. Meanwhile, the route node receives the information sent by the slave computer node wirelessly and sends the information to the host computer through the serial port, or obtains a command from the host computer node and transmits to the slaver computer node.
Slave computer nodes begin searching for the network after initializing CC2430 and the protocol stack. When there is a network nearby, they are applied to join the network and then enter the standby sleep state. If slave computer nodes want to send information or receive a command from the route node, they are woken up for communication. The standby sleep state is re-entered while ending the data communication.
Experimental results
Network performance experiment
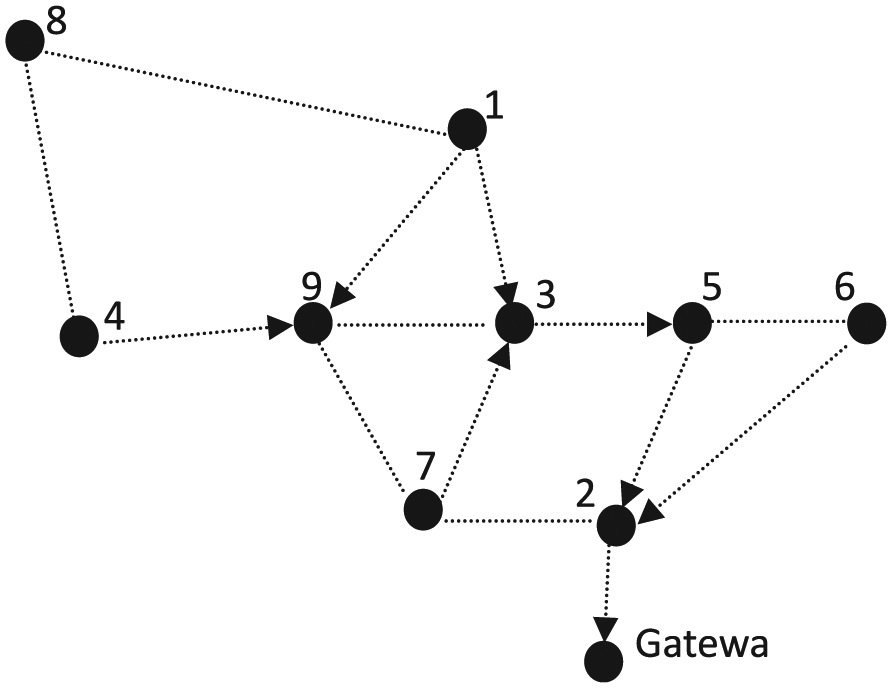
Diamond deployment shown in Figure 9 is used in the network for all the nodes.

Node deployment diagram.
In order to verify the performance of the network, three parameters are defined: topology formation time (TFT), topology stabilization time (TST), and topology reconstruction time (TRT). 27 It is considered that the sink node broadcasts routing information every 20 s and receives the data every 1 s and then sends it to the routing node. The routing node is always in the transmitting state in the process.
The performance of the system under the condition network scale varying from 5, 10, and 15 to 20 nodes is shown in Table 1.
Average time of TFT, TST, and TRT.

TFT: topology formation time; TST: topology stabilization time; TRT: topology reconstruction time.
As shown in Table 1, the average time of TFT, TST, and TRT increases as the network scale increases. As the network scale increases, the number of sensor nodes naturally increases. So, the time for the node to start broadcasting to all nodes joining the network and to reach a stable state is further increased. The scale of the network directly affects the time of network construction. Also, TRT will gradually increase, which is significantly greater than TFT. It means that failure of base station node can have a serious impact on the entire network.
To prove the correctness of the data transmission system, the packet loss rate of the system is described as follows. The packet loss rate is indicated by equation (2)

where L is the total number of lost data packets of the master node, and T is the total number of data packets sent by the slave node.
Assume that the slave computer node sends packets every 10 min and 5 packets per time, so total number of packets is 30 per hour. The systems were constantly monitored for 10 days. Therefore, the cumulative total data packet is 7200. The packet loss rate of the node is shown in Table 2.
Packet loss rate of the node.
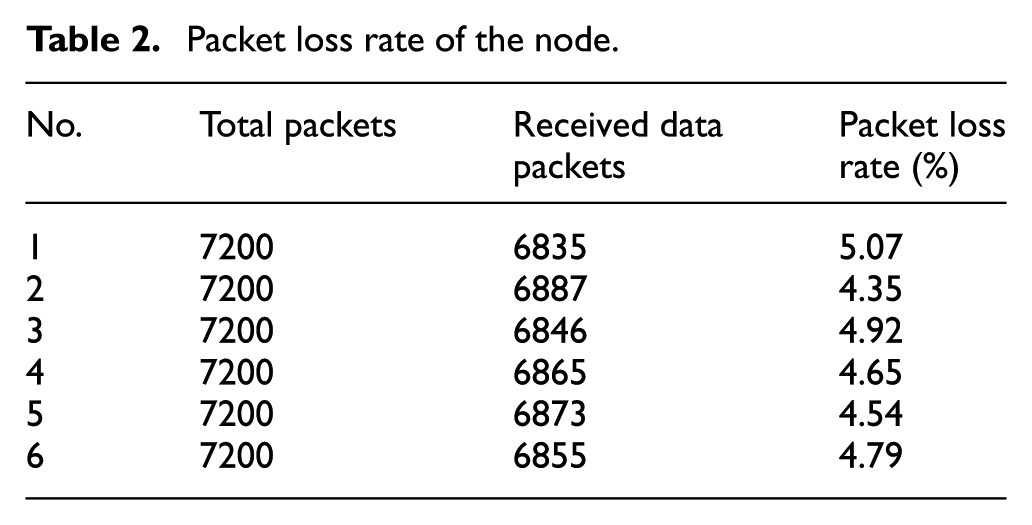
As shown in Table 2, the packet loss rates of the six experiments of the node were 5.07%, 4.35%, 4.92%, 4.65%, 4.54%, and 4.79%, respectively, and the average of packet loss rate of the system is 4.72%. The denser the node deployment, the closer the base station, the less the network packet loss rate. If the node is blocked by trees and buildings during transmission, the packet loss rate will be less.
According to the above method, the interval between sending packets is modified to 20, 30, and 40 s. The average of the packet loss rate of the system is given in Table 3.
Packet loss rate of the system.
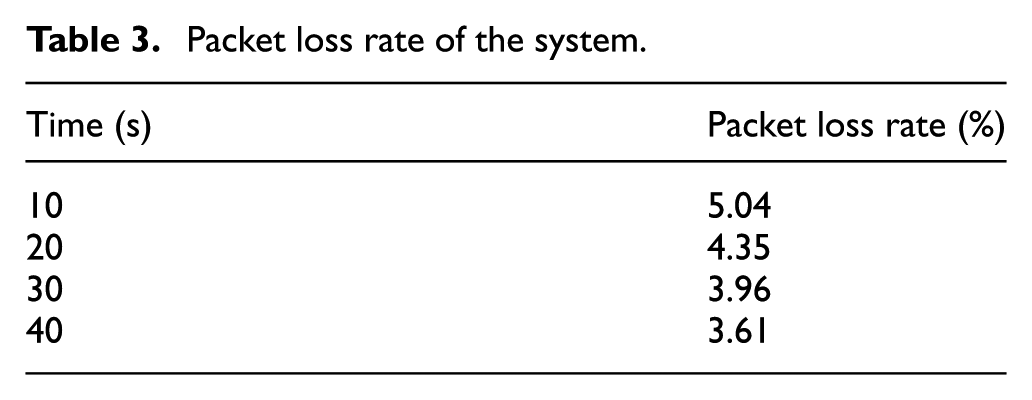
As shown in Table 3, the packet loss rate decreases as the interval increases. If the data transmission interval is longer, the node will have enough time to verify that all data are received. However, when the transmission interval reaches a certain value, the packet loss rate is also close to stable. Random deployment of nodes which is shown in Figure 10 is also experimented.
Random node deployment diagram.
The experimental method is consistent with the diamond structure. The packet loss rate of the two deployments of nodes at different time intervals is shown in Table 4.
Packet loss rate of diamond and random deployment.

As shown in Table 4, the packet loss rate of two deployments decreases as the interval increases, but diamond deployment is significantly smaller than the random deployment.
System monitoring results
Assume that the node collects data every 30 min and then sends them to the aggregation node, which can be viewed by the software, as presented in Figure 11.

Soil moisture data charts.
The software can display all data in real time, and the continuity of the monitoring data reflects the stable and reliable operation of the system. The effect of temperature on soil water content is obvious. Before 12 o’clock, the temperature was relatively low and the soil moisture content changed slowly. At 14 to 16 o’clock, the temperature increases sharply, so the soil moisture content also drops rapidly. After irrigation, soil water content will rise.
Tea nutrient testing
To calculate the similarity of an image, it is definitely required to discover the characteristics of the image. There are four main types of image features: color features, texture features, shape features, and spatial relationship features. Color features method is commonly used in the processing, which are mainly divided into histograms, color sets, color moments, aggregation vectors, and related graphs. A histogram can describe the global distribution of colors in an image and is easy to comprehend and implement, but cannot describe the local distribution of colors and the location of colors. In order to address the above problem, a block-based histogram is employed. The image is split into blocks, and the similarity calculation is performed on the corresponding small block. Finally, the similarity of the entire image is reflected according to the average similarity of each small block.
In the first step, get the histogram data after normalizing the image and then quantitatively measure the similarity of histograms according to formula (3)

where G, s is the histogram and M is the number of color space samples.
The images of tea leaves used for the experiment are shown in Figure 12. The histogram of the two tea leaves is shown in Figure 13. It can be seen that their regional distribution of colors is quite different, but in fact their global histograms are quite similar. So histogram percentage can refer to the difference between them, which is shown in Figures 14 and 15.

Images of tea leaves.

Histogram of tea leaves.

Histogram frequency of left leaves.

Histogram frequency of right leaves.
Therefore, it is possible to determine the absence of nutrients in tea based on the number of occurrences of different histogram frequencies. Unique tea leaves will have different color spaces and different histogram frequencies. The similarity of the tea image can be determined from the number of occurrences of different histogram frequencies and then determine the lack of nutrients in tea.
In order to accurately determine the similarity of two images, it is necessary to optimize the color characteristics of the image. Color moments are a very simple and effective color feature proposed by Stricker and Orengo. 28 Therefore, it is necessary to calculate the average of the pixels, standard deviation of the pixels, and slope of the pixels. If the value of the ith color channel at the jth image pixel is pij, then the index entries related to this color channel are


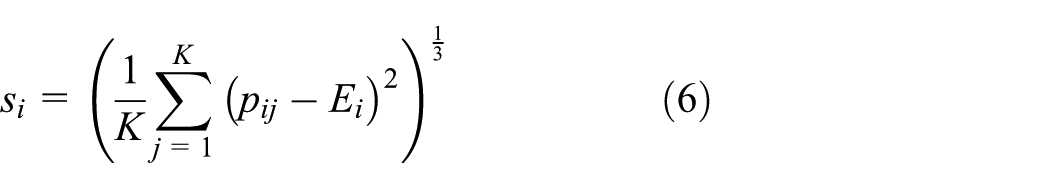
where K represents the total number of pixels in the image, pij represents the ith color channel at the jth image pixel value, Ei represents the average of all pixels on the ith color channel, σi represents the standard deviation of all pixels on the ith color channel, and Si represents the third-order root of the skewness of all pixels on the ith color channel.
We store all the values in the index with the same units which make them somewhat comparable. And then, the distance (d) is calculated between the two images through formula (7)

where feature[i] and feature[i] 2 are the feature values of the images, and M represents the total number of feature values.
Most similarity distance of the two tea leaves is 5.77. If the similarity distance value is 0, the image is identical. The larger the value, the more different the image. Therefore, the similarity of the image can be judged from the similarity distance value.
Inspired by the idea of data fusion approaches,29–31 this method is introduced to improve the accuracy of tea detection. Multi-sensor information fusion mainly comes from near-infrared spectroscopy and image vision. The image of the tea sample was gathered by the camera, and after pre-processing, the color features and texture features were extracted, and then the foremost component features of the tea image were determined. At the same time, the near-infrared spectrometer was also used to collect the tea image and extract the principal component characteristic variables. Not only the calculation results are input into the BP neural network–based fusion pattern classifier but also the consequences judged using sensory, and physical and chemical methods. The quality of tea is comprehensively evaluated, and the accuracy is higher.
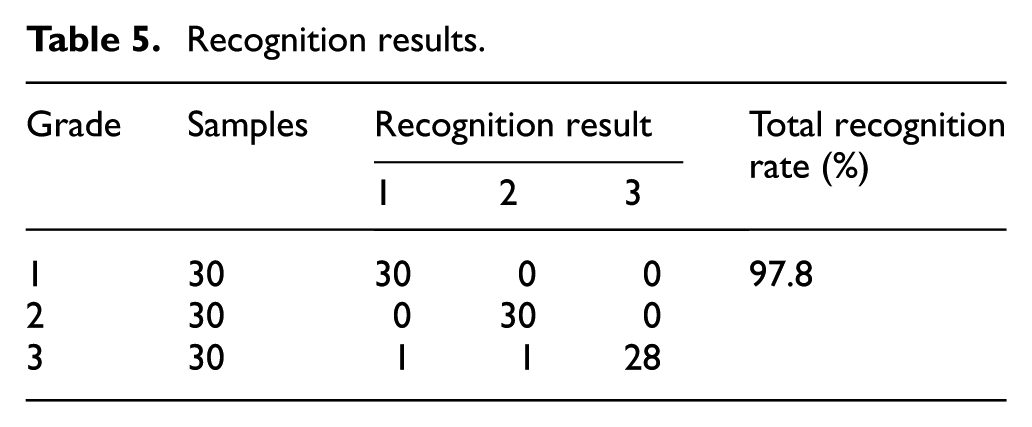
The number of principal component factors has a significant influence on the construction of the model. If the number of principal component factors is too small, then the information loss is large and the recognition rate is depressed. The more principal component factors, the more redundant information, and the longer the processing time. Experiments show that the accuracy rate will reach the maximum when the number of principal component factors in the image information is six, and the accuracy recognition rate remains basically unchanged as the principal component factor increases. At this time, the rate of returning to the model training is about 90%, and the recognition rate is about 75%. When the number of principal component factors of the spectral information reaches three, the recognition rate is basically untouched, and the recognition rate will reach about 90%. Therefore, the number of principal component factors of image information and spectral information is set to six and three, respectively. These variables are fused to establish a BP neural network. The results of the model training are provided in Table 5.
Recognition results.
System abnormality diagnosis
The DTW 32 algorithm is a nonlinear regularization technique that combines time warping and distances a measurement calculation, 33 which is used to measure the similarity between two sequences based on time and is used for speech recognition.
Let us denote the first sequence for standard sequence S = {S(1), S(2),…,S(m),…,S(M)}, where M is the total number of sequences, m is the sequence number, and the starting point is 1; the second sequence for testing sequence T = {T(1), T(2),…,T(n),…,T(N)}, where N is the total number of sequences, n is the sequence number, and the starting point is 1. In order to compare the similarities between them, the Euclidean distance is used to calculate the distance D(T, R) between the two sequences, and the smaller the distance, the higher the similarity. The distance should be calculated from the distance between each corresponding frame in T and R. Let n and m be the arbitrarily selected frame numbers of T and R, respectively, and d(T(n), R(m)) denote the distance between the feature vectors of the two frames. The dynamic programming (DP) algorithm is used for the case where the number, N, of two sequences is not equal to M to achieve the best effect.
If the frame numbers n = 1–N of the test sequence are marked on the horizontal axis in a two-dimensional Cartesian coordinate system, the frame numbers m = 1–M of the standard sequence are marked on the vertical axis, and a network is drawn by some vertical and horizontal lines which represent the integer coordinates of the frame number. Each intersection (n, m) in the network represents the intersection of a certain frame in the test sequence. The DP algorithm can be attributed to find a path through several grid points in the network, which is the frame numbers calculated in the test sequence and the standard sequence. The path must start from the bottom-left corner and end in the upper-right corner. Suppose the lattice points are (n1, m1),…,(ni, mj),…,(nN, mM), where (n1, m1) = (1, 1) and (nN, mM) = (N, M), the path can be described by the function m = Oslash(n), where n = i, i = 1, 2,…,N, Oslash(1) = 1, and Oslash(N) = M. Searching from the point (n, m), there are several paths that satisfy η, and the total accumulated distance when each path reaches the point (n, m) is calculated. The one with the smallest cumulative distance is the best path.
The cumulative distance of the path is displayed in formula (8)

In the first step, the sensor data are collected at regular intervals to form a test sequence. According to the growth of the tea plantation, the standard soil water moisture of each monitoring area is formed into a standard sequence in a certain order. If there are a total of 11 sensor nodes arranged in different monitoring areas, the customary sequence S = [26.1, 26.4, 26.7, 26.7, 26.9, 26.2, 26.4, 26.7, 26.4, 26.3, 26.5].
The sensor node collects the soil water moisture of each monitoring area and forms a test sequence T according to the sequence of time and then calculates with the orthodox sequence

The values in the test sequence will change as the environment changes.
The distance between the two sequences and the best path is shown in Figure 16. Because the two sequences are the same ones, their DTW distance is 0. The rounding path distance between the two time series should be a straight line. Second, according to the DTW algorithm, it determines whether the system has an abnormality. Soil moisture of 11 sensors was collected every 300 ms, and in turn, the DTW distance from the standard sequence was calculated, and the calculated results are presented in Figure 17.

Best path calculation diagram.

System display graph.
Finally, the user is prompted if there is just an abnormality in the system. If the system is normal, the numerical output of the system has almost no change, and it is in a straight line. The output of the system is almost equal to 0. If an abnormality is present in the system, the output of the system will jump to the value. Therefore, the range of the system can be identified based on the value of the output. The larger the value, the greater the change in system value, so exception message is forwarded to the administrator.
As shown in Figure 12, we can know the abnormality of the two sequences according to the DTW distance. The larger the distance, the more abnormal the system. Therefore, the level of the system abnormality can be determined by the DTW distance.
The example mentioned above shows that the DTW algorithm is used to evaluate the similarity between the two sequences of the soil moisture measurements. It can also help to detect a series of parameters to find the best-matching alignment between them. These parameters can be temperature, water content, frequency, and so on. Though it is not important in the DTW algorithm what the values mean, or how many parameters are there, or how long they are, but the two sequences required for comparison have the same format. For example, eight parameters in this case are the temperature and soil moisture of the first four formants, in the order T1, T2, T3, T4, S1, S2, S3, S4, separated by comma. Therefore, the DTW algorithm can be utilized to detect the abnormality of the data of the entire system.
Conclusion
In this article, a system for water and fertilizer irrigation of tea plantation is presented. This system can not only transfer the basic information including humidity information, the switch status of the water pump, and the battery value but also monitor the status of tea leaves by the high-speed camera loaded onto the UAV. In addition, DTW algorithm is used to judge the anomalous situation of the system and use BP network to judge the status of tea leaves. Experiments are performed for each key step of this system. The results validate the performance of this system in terms of packet loss rate, different number of nodes, the recognition of the quality of tea, and so on.
At present, research on tea garden information system has made progress. Yang et al. designed a WSN node and its network system for monitoring tea garden air temperature, humidity, and soil moisture content using ATmega128 + CC2420. TinyOS is used as its operating system, but its communication distance is limited, which limits its promotion and application. 34 Wang et al. presented a WSN node developed for information collection in a tea plantation, which aimed at boosting wireless penetrating power through communication barriers. The effective communication distance was measured up to 150 m in broad smooth areas. 35 Chen et al. 36 designed a set of tea garden environment monitoring systems based on WSN, using Zigbee and GPRS (General Packet Radio Service) technology for data communication, which expanded the monitoring range, overcoming the high cost and difficulty in maintenance of tea planting wires. Combined with wireless monitoring data, Wang 37 designed a wireless monitoring and decision-making early warning system platform for gentle temperature disasters in hilly tea gardens using decision support and virtual instrument technology. These systems mainly study the communication technology and information management involved in tea garden information collection. The research on water and fertilizer irrigation technology is relatively rare. There is no analysis of the lack of nutrients in tea, and therefore, the scheme of water and fertilizer irrigation is proposed.
Contributions of our research work can be summarized as follows. A block-based histogram is employed and most similarity distance is adopted to confirm the diagnosis of lack of one or more nutrients of tea. The histogram data are obtained after normalizing the image, the histogram percentage is calculated, and then the similarity of the image is established by comparing with the calibrated histogram data. It is necessary to calculate the average of the pixels, standard deviation of the pixels, and slope of the pixels. The distance is computed for the similarity between the two images.
The DTW algorithm is used for the abnormality of the system. Therefore, the level of the system abnormality can be determined by the DTW distance. The DTW algorithm is used evaluate the similarity between two sequences of the soil moisture measurements. It can also help to detect a series of parameters to find the best-matching alignment between them. The larger the value, the greater the change in system value, so exception message is forwarded to the administrator.
Data fusion technology was introduced for improving the accuracy of tea detection. The color features and texture features were extracted, which are input into the BP neural network–based fusion pattern classifier to comprehensively evaluate the accuracy quality of inspection of tea.
Footnotes
Handling Editor: Daming Zhou
Declaration of conflicting interests
The author(s) declared no potential conflicts of interest with respect to the research, authorship, and/or publication of this article.
Funding
The author(s) disclosed receipt of the following financial support for the research, authorship, and/or publication of this article: This paper was supported by Liuzhou Science and Technology Plan Project (2017BE10303), Guangxi Science and Technology Plan Project (AB16380286), Guangdong Science and Technology Plan Project (2017A020208049), South China Agricultural University Science and Technology Achievements Transformation Incubation Project (CGZHT2018004), Guangdong Agricultural Technology Research and Development Project (2018LM2163), and Guangxi High School Innovation Team and Excellence Scholar Program.