
Abstract
In this article, we discuss the validity of noninvasive continuous blood pressure estimation with two different types of peripheral pulse waves. Artery-blocking experiment shows that phase difference of two pulse waves at the same location is well related with blood pressure and blood flow fluctuation. Exercise-recovery experiment resulting from 16 subjects shows that phase difference varies with blood pressure with the correlation from 0.63 to 0.88 when blood pressure changes rapidly. Simulations based on a classic hemodynamic model verify the relationship between phase difference and blood pressure. However, phase difference is strongly correlated with smooth muscle state of the arterial wall as well. If smooth muscle information can be obtained by further study, phase difference can act as a promising approach to portable and wearable device for real-time blood pressure monitoring.
Keywords
Introduction
Recently, noninvasive continuous blood pressure (BP) monitoring attracts strong interest.1–4 The beat-to-beat BP data reveal a great deal of information about the dynamic features of cardiovascular control mechanisms, 5 which is significant for both disease prevention and clinical diagnosis.6–8
At present, most of the clinical approaches are cuff based, which is uncomfortable during the inflation process. Therefore, cuff-less technique is much more desirable. 9 However, most of the measurement devices collect signals from multiple positions which is inconvenient and nonwearable for daily usage.
In this article, we intensively study two types of pulse waves at wrist and analyze the possibility and their limitation in noninvasive and continuous BP estimation. This attempt acquires signal at only one spot and is suitable for long-term and unobtrusive monitoring. To clearly illustrate the idea, the rest of this article is organized as follows. In section “Related works,” we provide a brief summary of the related works and explain the origin of the phase difference (PD) among different types of pulse waves. In section “Experiment and discussion,” we find that in the cuff-based BP measurement, blocking the artery in the upper arm leads to the decline of PD in the wrist, which reveals that PD is related with the BP and blood flow quantity. Then in the exercise-recovery experiment, we discuss the correlation between BP and PD when BP changes rapidly and point out that PD is regulated by both BP and the state of smooth muscle (SM). In section “Simulation and analysis,” a simplified hemodynamic model is introduced and the relationship between BP and PD is verified, regardless of the activity of SM.
Related works
Traditional method of cuff-less BP measurement
Pulse transit time (PTT) is intensively studied for cuff-less BP estimation for years.10–18 In general, this method requires electrocardiogram (ECG) signal and pulse waveform in the peripheral artery at the same time and calculating the BP with some algorithms and individual calibration. 19 However, the estimation of ECG signal is not convenient in daily life, especially for long-time monitoring.
Some researchers attempted to obtain PTT with two pulse waves obtained at two different spots with two sensors.20,21 In this approach, ECG is not required, but the results are not accurate enough when the distance between the two sensors is short. 22 On the other hand, a long propagation distance of pulse wave results in wave deformation due to reflections and estimation error. Other researchers suggest to precisely measure the pulse wave at a single spot and calculate BP with the information on the waveform, such as amplitude and time interval of characteristic points.23,24 However, the sensor has to be tightly attached to the skin, which leads to local venous congestion for long-time estimation.
Different types of pulse waves
Driven by the contraction of the left ventricle, arterial blood flows periodically. Relevant parameters (the velocity of blood flow, the BP, and the diameter of the artery, for instance) used to describe this physical process change with the same period.
At a fixed location of the artery, we can plot the curve of these parameters as shown in Figure 1. If we treat the curve as a type of wave, the propagation of waves along the artery oscillates with the same period as the heart beats. Usually, the pulsatile waveform of these parameters is called blood pulse wave (BPW).

Snapshot of signals in the oscilloscope (the yellow one is the MMSB signal, the green one is the ECG signal, the blue one is the PPW signal and the purple one is the PPG signal).
With different types of instruments, we can obtain these pulse waveforms, respectively, as the snapshot in Figure 1. Different BPWs are listed in Table 1.
Summary of common BPWs.

BPW: blood pulse wave; PPG: photoplethysmography; PPW: pressure pulse wave; DPW: diameter pulse wave; VPW: velocity pulse wave; MMSB: modulated magnetic signature of blood. 25
Differences among pulse waves
The characteristic peaks on these BPWs are almost coincident when they generate in the main artery (from the very beginning); however, they differ from each other as they propagate to the peripherals due to the superposition of refractive and reflective waves. These phenomena are especially notable at turnings, bifurcations, or ends of arteries. Taking pressure and velocity, for example, their waveforms varied dramatically in different positions of the body as shown in Figure 2.
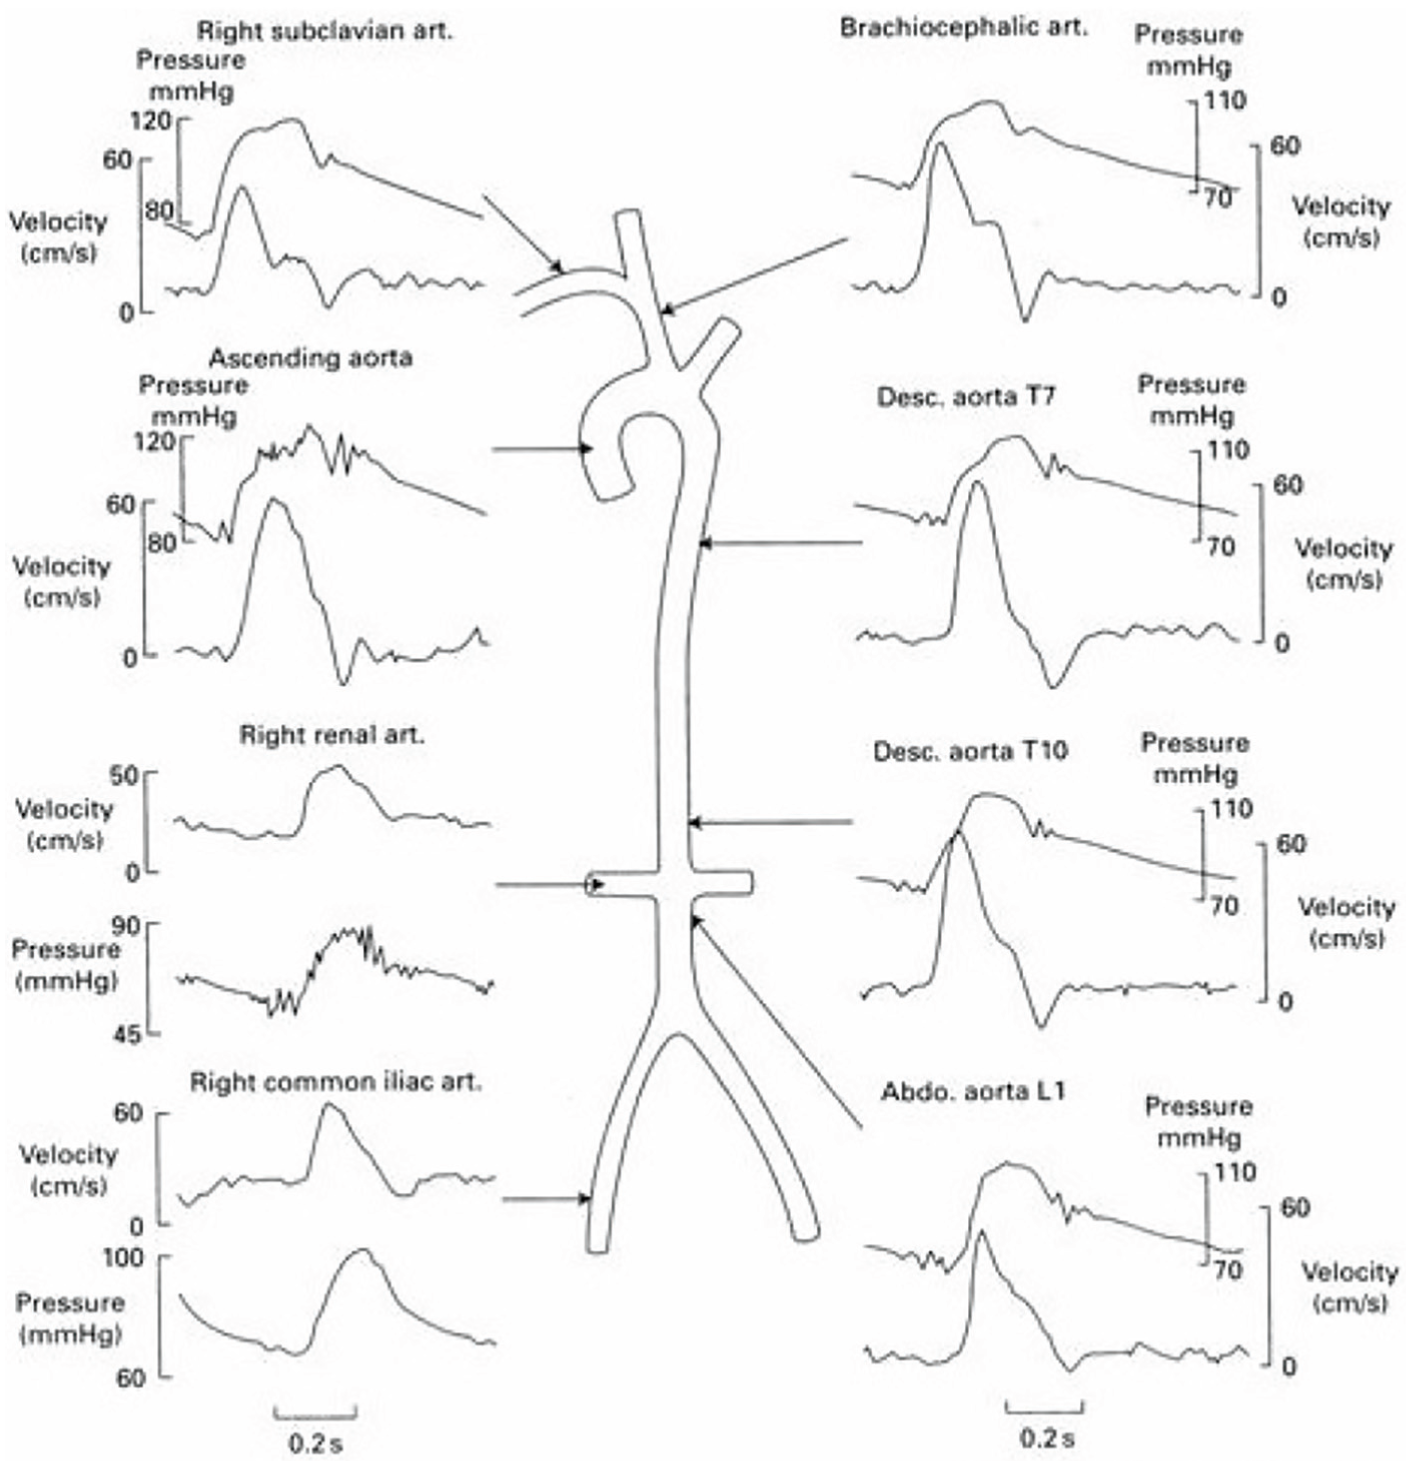
The pressure and velocity pulse waveforms at different sites. 26
When the physical condition of the body varies, these BPWs will change as well. For instance, when BP rises, both the diameter and the quantity of flow increase, so does the PD of these waveforms. In this article, we employ the time interval between the peak values to represent their PD. In the traditional methods with PTT measurement, the device collects two pulse waves at a distance. The pulse wave velocity (PWV) changes with the elasticity of the arterial wall which is periodically varied with the BP. In this article, we find and propose that the peak delay of different types of pulse waves at the same site is correlated with BP. We will figure out their relationship with two experiments and a simulation process, and point out the limitation of peak delay in the usage of BP estimation.
Experiment and discussion
The experiments below are designed to uncover the relationship between BP and PD. In total, 16 subjects participated in the experiment. Photoplethysmography (PPG) and diameter pulse wave (DPW) above the radial artery are chosen to calculate PD. BP is measured in the upper arm with Omron electronic sphygmomanometer to automatically record the BP. During estimation, the subjects are required to sit still to avoid the artificial noise. 27 The measurement system and device are shown in Figure 3. In order to verify the consistency of the experimental results, all the experiments are conducted more than five times for an individual.
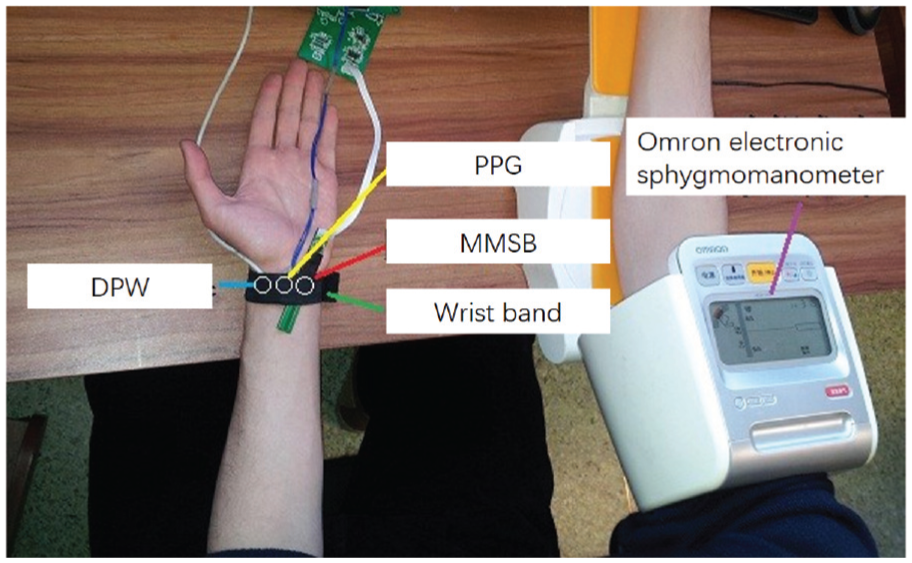
Measurement system and device.
Artery-blocking experiment
In the cuff-based BP measurement, the upper arm is bounded by a cuff. It will gradually block the blood flow during the air inflation. We record the PPG and DPW signals at wrist during the artery-blocking process (Figure 4) and calculate the PD in Figure 5.

Pulse waves during the artery-blocking process. The red curve is the DPW, and the blue one is the PPG.

PD variation in the artery-blocking process. The x-axis is the pulse serial number, not the time. For each cardiac cycle, we calculate the PD and draw a point.
The contraction of the cuff leads to the growth of the flow resistance. And the pressure and flow quantity in the artery become lower as depicted in Figure 4. Comparing Figure 4 with Figure 5, the trend between PD and these two pulse waves fits better, which indicates that there should be some interrelationship between them during the process.
This experiment does not quantitatively measure their relation owing to the difficulty in the acquisition of BP in the dynamic process. However, it inspires us with an idea that peripheral PD is correlated with BP and flow quantity, and may be used for BP estimation.
Exercise-recovery experiment
In this experiment, BP and PD of the subjects are measured simultaneously at different states: relax state and recovery state (after exercising).
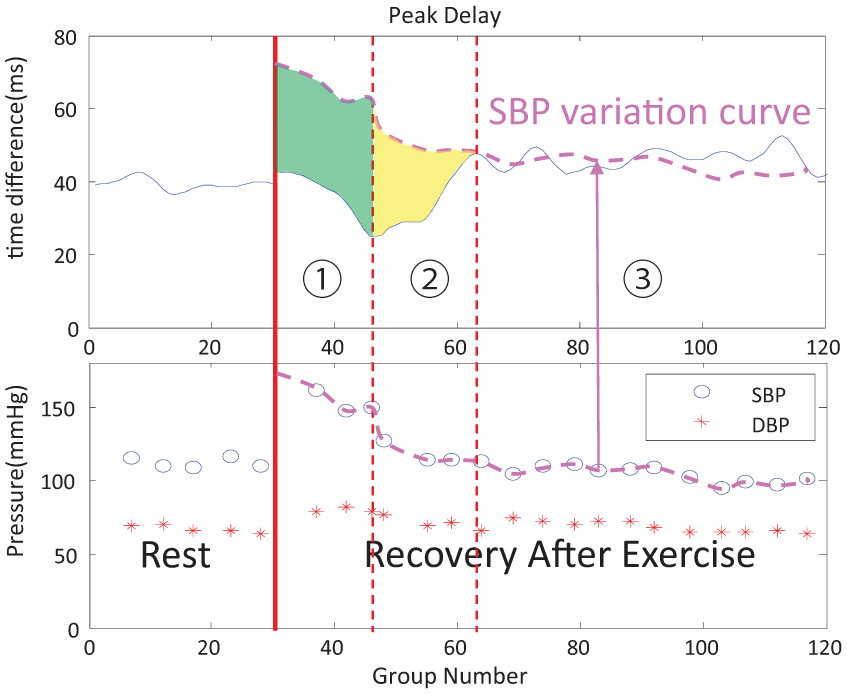
Since we cannot measure the BP pulse by pulse by the automatic machine, we record the pressure every few minutes to compare with the PD data (Figure 6). As expected, the BP variation trend is flat during the relax state, increases a great deal after exercises, and then comes back to normal after a while.

Experimental result of PD. The former 30 groups are at the calm state, and then the subject performs some vigorous exercise. The later groups are at the recovery state.
Figure 7 shows the BP variation of one subject. The first 30 points are at the relax state, while the rest are at the recovery state. As we can see, the PD almost remains the same at the relax state, increases right after exercise, then drops to a low level, and finally returns to the normal stage.

Blood pressure variation. The former 30 groups are at the calm state, and then the subject performs some vigorous exercise. The later groups are at the recovery state.
From the curve shown in Figure 6, we find that two physiological parameters impact the variation of PD. First, BP has a dramatic influence on PD if BP changes notably. This is in agreement with the artery-blocking experiment. During the BP rapid changing period, the correlation between BP and PD is rather high, up to 0.7662 (average value) with a standard deviation of 0.0829 as shown in Table 2. Second, the contraction of SM dominates the change of PD as well. This mechanism plays a vital role during the recovery process.
Linear correlation between BP and PD when BP changes rapidly.

BP: blood pressure; PD: phase difference.
The whole recovery process can be explained below. After exercises in period ① in Figure 8, BP falls quickly, while the state of SM remains relatively stable at the beginning of the recovery state. This means that the BP drop dominates the PD variation which results in the drop of PD. We connect the systolic blood pressure (SBP) variation curve in dotted line and move it on the curve of PD as shown in Figure 8. It is obvious that PD well follows the decline of SBP in this period. In period ②, the SM starts to recover to its normal state. PD is prone to both BP and SM state change during this period and the latter dominates the process, so that the PD curve rises up to the normal level. In period ③, when the BP is almost stable and SM is back to its normal state too, the curve starts to vibrate at rest state.
Explanation of exercise-recovery experiment.
We calculate the linear correlation between PD and BP of all the subjects for the BP rapid change period, as displayed in Table 2. It is obvious that during this period PD is positively correlated with BP. Compared with PTT-based methods, the correlation between PD and BP is no higher than those reported in the published works and it cannot get rid of the impact of SM. However, PD has an unparalleled advantage in portability and wearability owing to the only one acquisition point.
Simulation and analysis
Modeling and simulation
The positive correlation between BP and PD can be sketched from the experiments. To verify this idea, a classical model is used to simulate the physical process.28,29
Only axial velocity (x direction) of the flow is taken into consideration, which means that the radial component of velocity and pressure is zero. The blood is considered to be an incompressible Newtonian liquid and its gravity is ignored. The deformation of the artery wall is so small that the wall can be viewed as linearly elastic without axial movement.
The relationship between inner pressure p and quantity of volumetric blood flow q satisfies equation (1) after a few steps of simplification

where
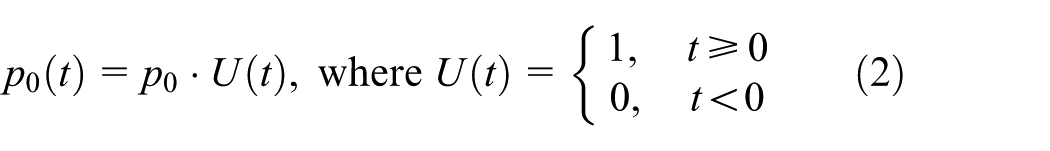
If the input signal at the inlet
the solution to equation (1) is
where
The physical meaning of this solution is that the final expression of
The simulation implements an
The input of the simulation is the DPW generated in the aorta. The shape of the waveform is shown in Figure 9(a). We select 20 points on the continuous signal and discretize it into 20 step signals as the input of the simulation for simplicity. The output of the simulation is filtered by a low pass filter to get rid of the high-frequency jitter as shown in Figure 9(b).

(a) The input waveform, where the red line represents the continuous waveform and the blue one is the discretization with 20 step signals; (b) the output waveform with PWV = 10 m/s, where the blue line indicates the volumetric flow quantity and the red one stands for pressure wave.
The traditional PTT-based method to measure BP concerns the relation between PWV and BP. Therefore, we also employ PWV as the argument. Figure 10 displays the output waveforms of pressure and volumetric flow quantity with different PWVs. Figure 11 presents the PD variation curve with an increase in PWV. In Figure 11, PD has a strong positive correlation with PWV. This agrees with the experimental results as discussed in the previous part.
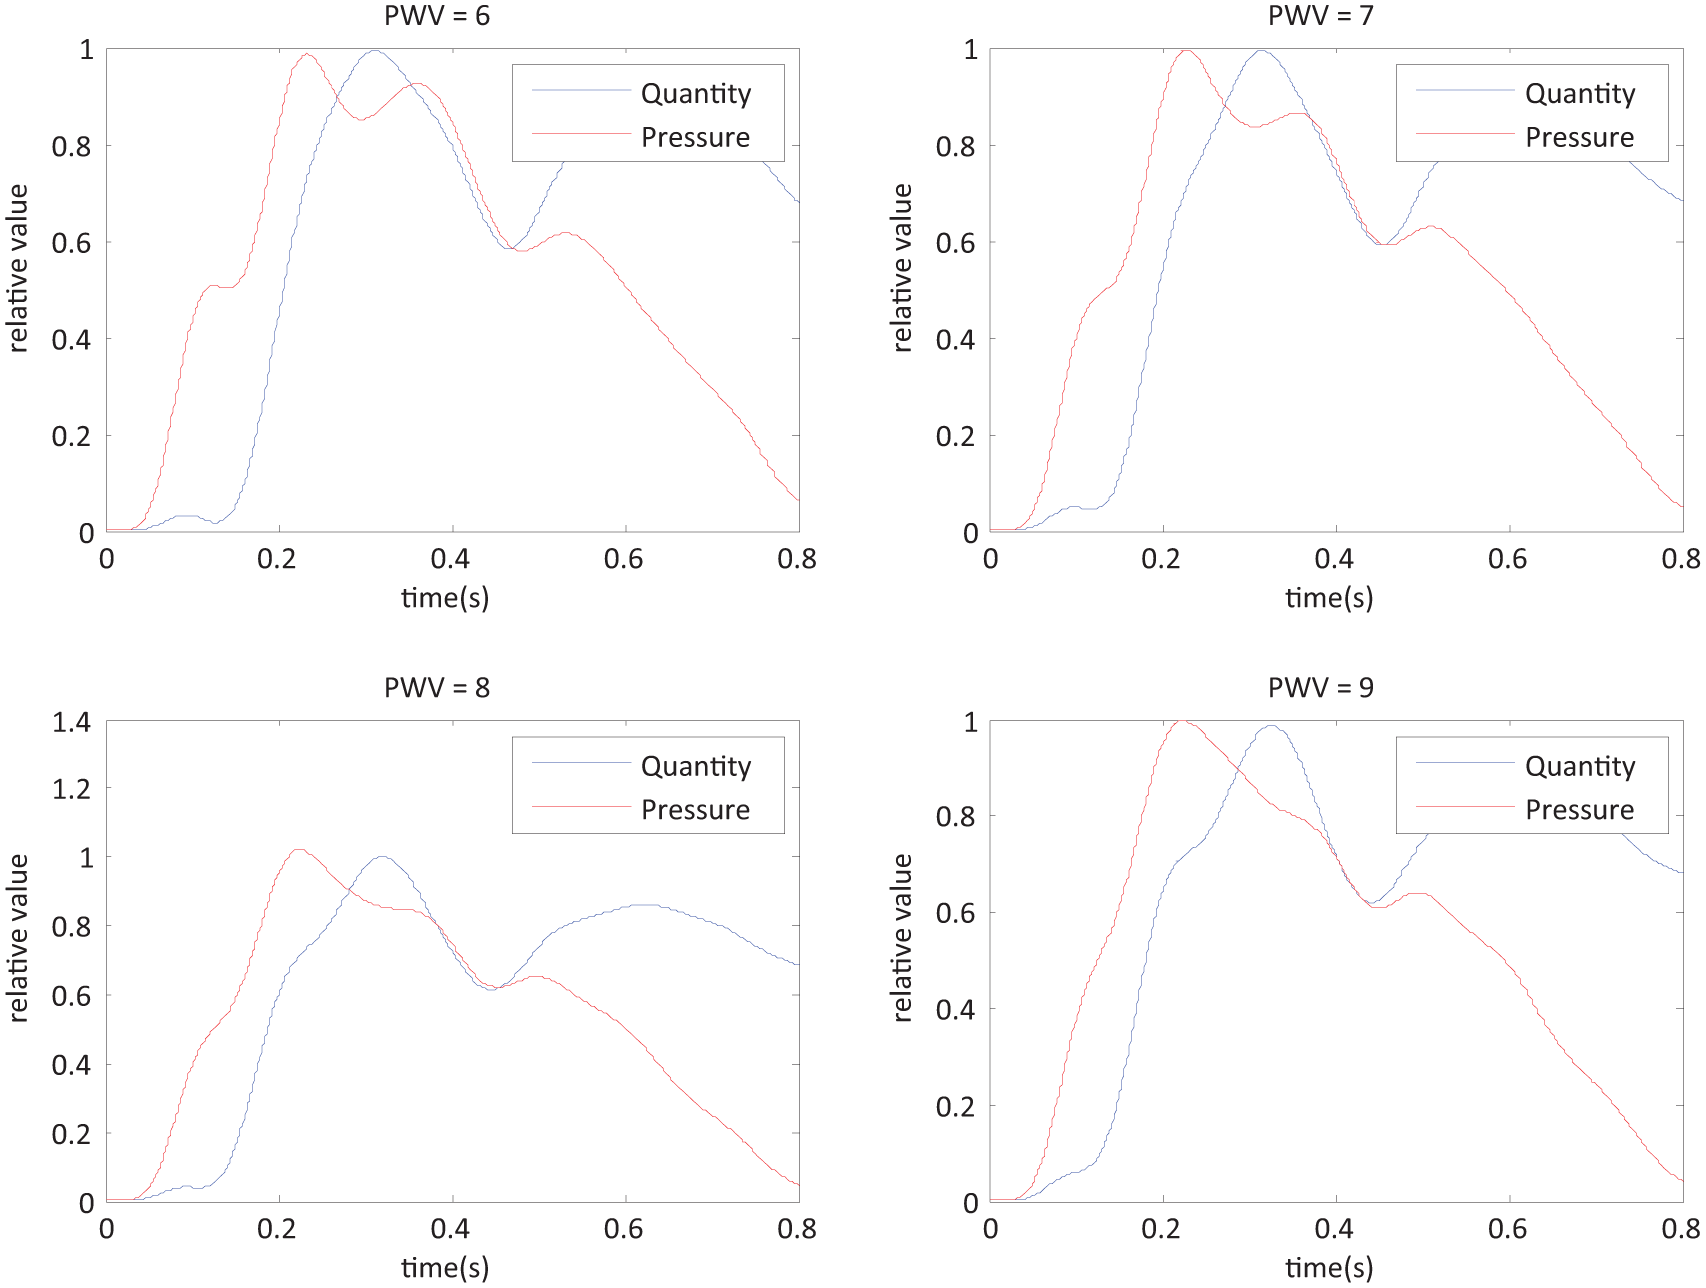
The simulation result. With different PWVs, the output waveform of pressure and volumetric flow quantity is different.

The simulation result. PD increases with PWV.
Traditionally, BP is calculated with PTT and PWV is inversely proportional to PTT. If the relation between PD and PWV is clear and stable, we can adopt PD instead of PTT as the parameter to describe BP for convenience. In this way, we can acquire all signals at only one spot in our body (e.g. in the radial artery), which is friendly on a portable and wearable device for real-time BP monitoring compared with previous approaches.13,15,30–33
Influence of simplification on simulation results
Only one-dimensional laminar flow is considered in the applied model. And some terms are omitted when we solve for solution. For example, blood flow velocity is considered to be zero when compared with BPW velocity and, for the thick artery, the effect of viscosity is not obvious.
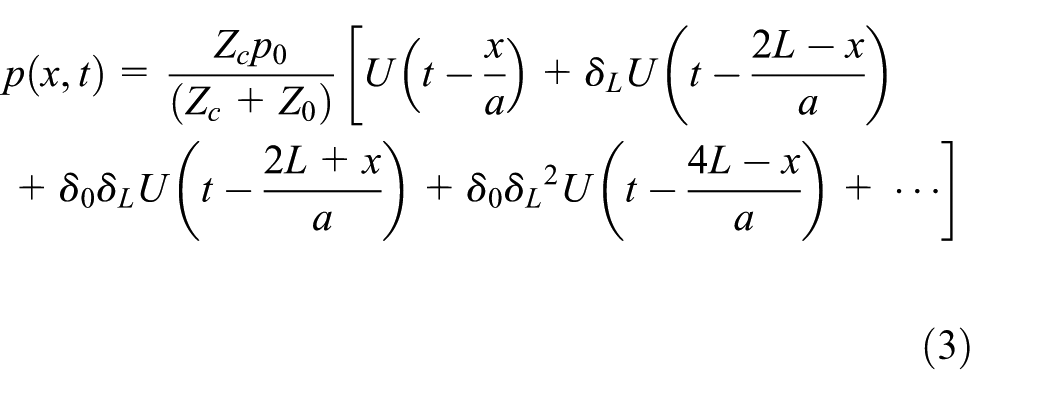
The waveform deformation shown in Figure 10 is partly caused by omission of the minor contributory factors. However, after the simplification we could obtain the analytical solution shown in equations (3) and (4) which reveals the nature of PD: the reflections are different among different pulse waves. In the model, we only take the inlet and outlet of the tube into consideration and believe that the reflection happens there. Similar to the echo in the valley, the more times it reflects, the weaker it becomes.
Conclusion
The artery-blocking experiment and the simulation analysis convince that PD is highly correlated with BP. However, the exercise-recovery experiment indicates that BP is not the only reason that dominates the value of PD. The contraction and relaxation of SM should be taken into consideration as well.
This can be well explained by the structure of the peripheral artery. In the peripheral, SM is prevalent and is regulated by physiological activities. The contraction and relaxation of SM can greatly change the elasticity of the arterial wall. During the propagation of BPW, the arterial wall acts as the propagation medium. And the change of elasticity of the medium results in the change of PD.
Therefore, if we want to track the variation of BP with PD, we have to employ other parameters to neutralize the change of SM. On the other hand, we can adopt PD to extract the state of SM, if we already have the BP information.
In this article, we propose analysis and discussion about PD in the usage of BP estimation. The analysis of the origin of PD indicates that the difference between two types of pulse waves may contain BP information. A hemodynamic model is used to simulate the process. We find that PD is positively correlated with BP when BP changes rapidly which is confirmed by both experiments and simulations. Besides, PD can reveal the state of SM as well.
In the PWV-based (or PTT-based) method to estimate BP, the acquisition spot is usually in the peripheral such as fingertips, earlobe, and skin surface. The state of SM can interfere with the accuracy of estimation. PD has the potential to offset this interference by containing SM information. It can help improve the performance of the portable and wearable device for real-time noninvasive and continuous BP estimation.
Footnotes
Handling Editor: Ghufran Ahmed
Declaration of conflicting interests
The author(s) declared no potential conflicts of interest with respect to the research, authorship, and/or publication of this article.
Funding
The author(s) received no financial support for the research, authorship, and/or publication of this article.