
Abstract
This study presents a novel single-degree-of-freedom model of vortex-induced vertical force, which is based on supervised learning. There are three steps in the process of modeling. First, a hypothesis function based on the Taylor expansion is applied to describe the complicated of vortex-induced vertical force. Second, this hypothesis function is optimized by spectrum and correlation analysis. The terms in this function are deleted when they meet one of the following cases: the frequency amplitudes are close to 0; the correlation coefficients with the vortex-induced vertical force are less than 0.3; the correlation coefficients with other low-order terms are more than 0.8. Third, the validity and reliability of the optimized function are verified by comparative and residual analysis. The process of optimization makes the proposed model simple and well describes the main characteristics of vortex-induced vertical forces. Moreover, the maximum displacement is accurately predicted according to the proposed model. Simulation results show that the proposed model has a high coefficient of determination (R2) compared with Scanlan’s and Zhu’s models, which means that the proposed model is more suitable to describe vortex-induced vertical forces.
Keywords
Introduction
The vortex-induced vibration (VIV) for long-span bridges is one of the most common aerodynamic phenomena due to wind–structure interactions at low wind speeds. 1 If the frequency of vortex shedding approaches one of the natural frequencies of a long-span bridge, a “lock-in” phenomenon will occur. 2 Under “lock-in” conditions, the VIV causes large amplitude response on long-span bridges. 3 Although the VIV does not always result in catastrophic events, it seriously impacts the fatigue life and results in a loss of usability of the structure. The necessity of producing methods against VIVs has led a lot of researchers to study the VIV phenomena.4–13 However, the VIV is so complex that now a purely theoretical model cannot be established. A convenient way is to form a semi-empirical model based on the main phenomenology of VIVs through wind tunnel tests.
In the past few decades, many models have been proposed.14–19 The vortex-induced force is difficult to be accurately measured in wind tunnel tests because of the limitation of experimental technology; most of the models are unsupervised. These unsupervised models are built on the Van der Pol oscillator or the professional knowledge of researchers. Ehsan and Scanlan 3 proposed a nonlinear model based on the Van der Pol oscillator, and the model has been widely applied in engineering. However, it fails to describe the nonlinear vortex-induced vertical force (VIVF).20–22 Wu and Kareem 20 used the Volterra series to present a nonlinear model for long-span bridges. This model can capture the typical characteristic of VIV such as the limit cycle oscillation, but its kernels are very difficult to obtain due to the complexity of the multi-input nonlinear system. Marra et al. 22 analyzed experimental data by Griffin plot and found that the relationship between the Scruton number and the linear damping coefficient of Scanlan’s model is linear and the relationship between the Scruton number and the nonlinear damping coefficient is quadratic. They proposed a model based on Scanlan’s model to fit the experimental data, but at least three wind tunnel tests are required to identify parameters of the model. Although these models enrich the knowledge of VIVs, they are to some extent ambiguous, because these models are built on and validated by the measured displacement. 21
With the development of science, the time history of the VIVF has been accurately measured in wind tunnel tests.21,23 It is possible to use the measured VIVF to supervise and evaluate a VIVF model. Zhu et al. 21 proposed an improved model by adding a quadratic term of velocity and displacement to Scanlan’s model and modifying the nonlinear damping term of the model. Compared with Scanlan’s model, this improved model well describes VIV phenomena. Zhu et al. 23 simplified this improved model by deleting the quadratic term, the linear stiffness, and the instantaneous lift term. However, the information embedded in the measured data is not fully mined in modeling, which may be good for modeling.
It is urgent to study a simple and convenient model with new technology. Supervised learning is a good modeling method, and its primary task is to infer a function from training data, including the labeled data. 24 The essence of learning is to find relationships between the feature data and the labeled data. Supervised learning is used to model regression 25 and classification. 26
In the study, the measured VIVF is regarded as the labeled data, and a functional relationship between the labeled data and other measured data is sought by supervised learning. According to this functional relationship, a novel semi-empirical supervised model is proposed. The proposed model has few parameters and low-computational complexity. Importantly, the maximum oscillation amplitude of bluff bodies can be accurately estimated at different wind speeds by the proposed model.
The rest of the study is organized as follows. In the “Related work” section, Scanlan’s model and Zhu’s model are simply described. In the “Proposed model” section, a new model is proposed, the modeling is discussed in detail, and parameters of the proposed model are identified. In the “Simulation results” section, by simulation results, the validity and reliability of the proposed model are verified. The “Conclusion and future works” section summarizes the study.
Related work
The study focuses on the vertical vibration of bluff bodies under uniform flow conditions and ignores variables of inflow and torsional response. Therefore, the general form of a motion equation that describes the across-flow response of a single-degree-of-freedom can be expressed as follows

where
Ehsan and Scanlan 3 proposed an empirical nonlinear model as below

where
Zhu et al. 21 put forward an improved nonlinear model, which can be expressed as follows

Compared with Scanlan’s model, Zhu’s model has a new term
Proposed model
Many studies on VIVF are based on measured vertical displacements. By comparing the reconstructed displacement with the measured displacement, the validity of the VIFF model is verified.3,13 Therefore, there is an unknown gap between the measured VIVF and the VIVF reconstructed by these models.
To better describe the characteristics of VIVF, the study uses supervised learning to mine relationships of data and build a good VIVF model, and the measured VIVF is regarded as the labeled data. As shown in Figure 1, a hypothesis function is set according to the Taylor expansion. Then the information embedded in the measured VIVF is mined by spectrum and correlation analysis to optimize this hypothesis function. The validity and reliability of the optimized hypothesis function is verified by comparative and residual analysis. Finally, the proposed model is achieved.

Modeling process.
The modeling process
The VIVF signal is superimposed on a lot of high-order harmonics. The Taylor expansion is used to approximate a nonlinear VIVF function.
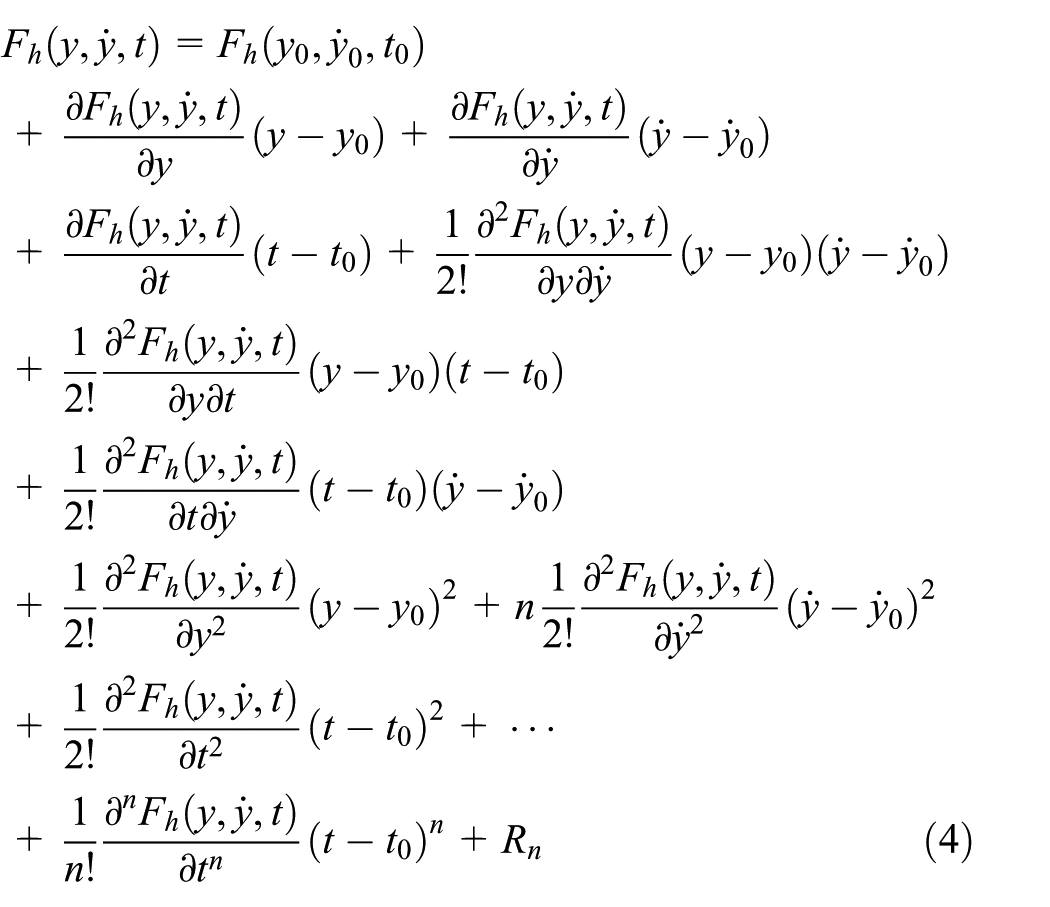
where
Equation (4) can also be written as follows
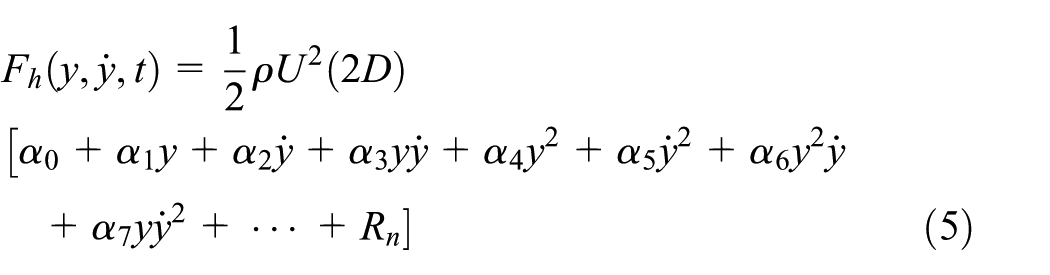
Equation (5) can theoretically describe the VIVF on a bluff body, but it contains too many high-order nonlinear terms. A desirable model should have few parameters that need to be identified and easily measurable quantities describing the physical behavior of the model. 28 Therefore, equation (5) needs to be optimized according to spectrum and correlation analysis.
First, the measured VIVF is analyzed in the frequency domain. In Figure 2, there are a green box and three red boxes. The green box represents a constant, and the red boxes represent three prominent frequency points


The frequency spectrum of the measured VIVF
Second, different terms make different contributions to the VIVF. If a term can capture the actual characteristics of the measured VIVF, it has a high correlation coefficient with the measured VIVF. Because moderate and strong correlations are taken into account, a threshold is defined as 0.3.
29
If the absolute value of a coefficient is larger than the threshold, there is a certain degree of correlation between the force variable and its column variable. Table 1 shows the correlation analysis of the measured VIVF and independent variables. Every red number denotes a high correlation between the measured VIVF
Correlation analysis of the measured VIVF and independent variables.

VIVF: vortex-induced vertical force.
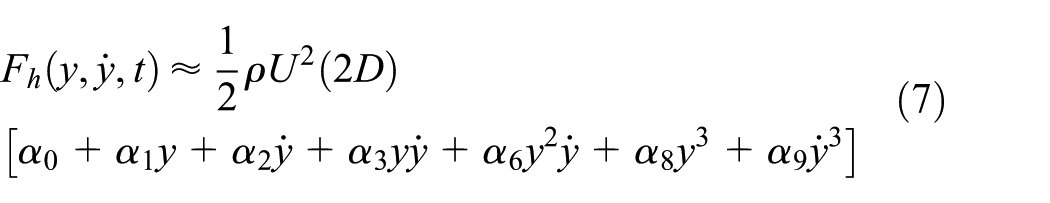
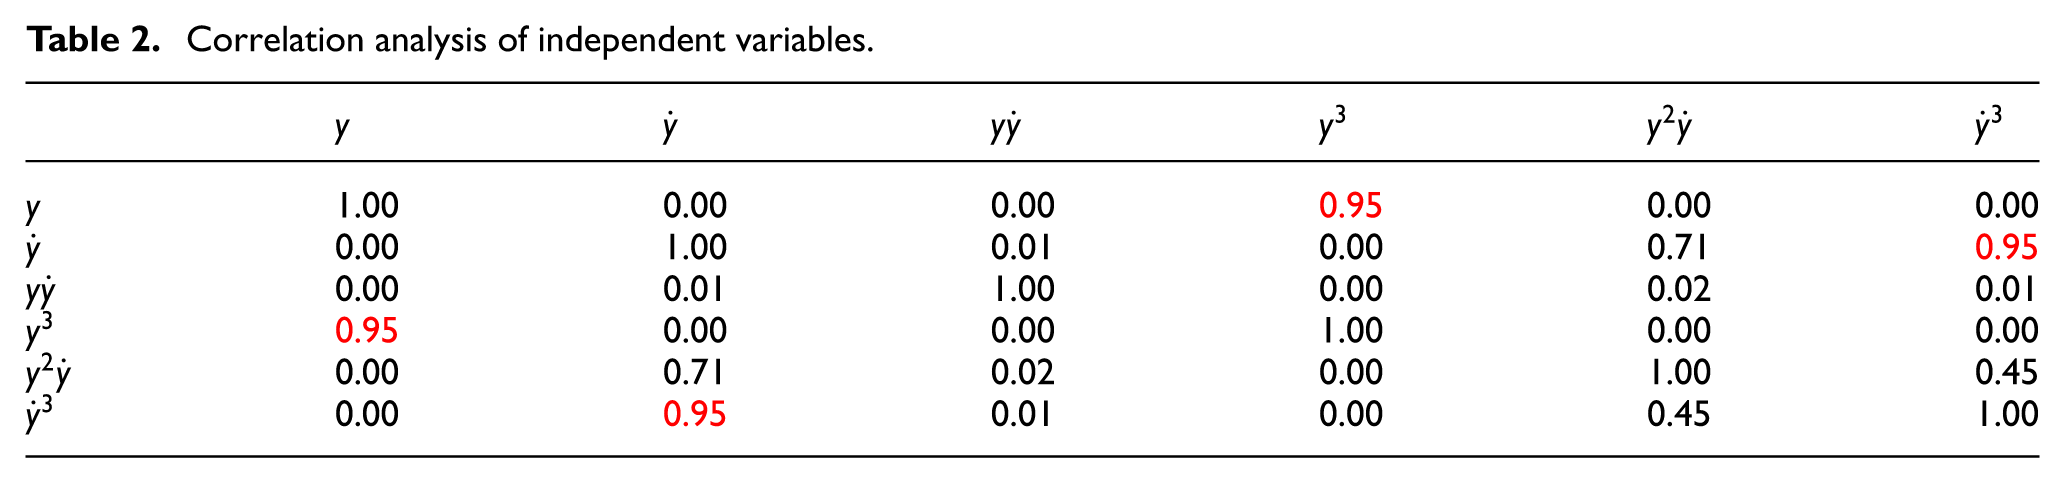
In addition, correlations between different independent variables in equation (7) need to be analyzed to keep the independence of variables. Since a strong correlation is harmful to the model, the threshold is set as 0.8. 29 If the absolute value of a correlation coefficient is larger than the threshold, there is a strong linear correlation between two variables.
Table 2 shows correlations between different independent variables. The correlation coefficient between

Correlation analysis of independent variables.
Through the optimization process, the proposed model can be expressed as follows
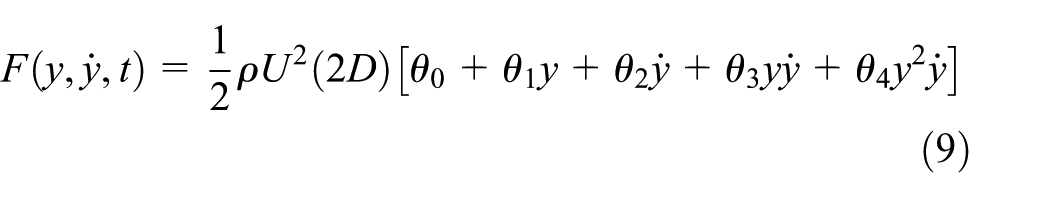
where
The dimensionless format of equation (9) can be expressed as follows

where
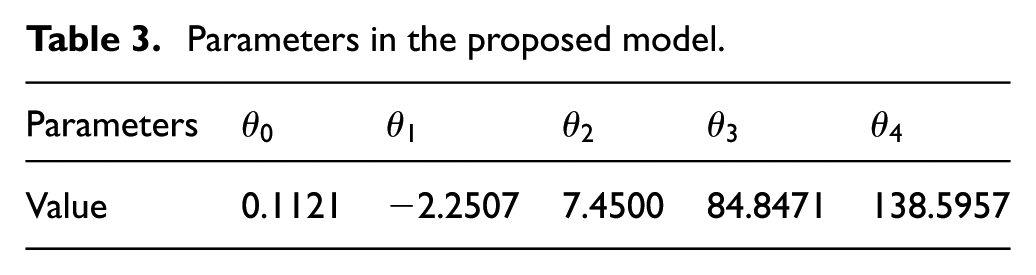
Parameter identification
Parameter identification is important because accurately predicting a prototype response directly depends upon the accuracy of the parameters identified from the experiments. Equation (10) is regarded as a linear combination of nonlinear basis functions which are
Let

Equation (11) is viewed as a linear function of

where
A cost function based on the least squares theory is defined to describe the distance between the measured and reconstructed VIVFs

The minimum of equation (13) is found by setting its derivative to zero. Since the proposed model contains five parameters, there are five derivative equations. Parameters can be obtained by solving the following equations

Simulation results
A training set includes 1024 data from the transient part of the steady stage of the VIV time history at the wind speed
Parameters in the proposed model.

The transient part of the steady stage of the VIV time history: (a) the VIVF, (b) the vertical displacement, and (c) the vertical velocity.
Figure 4 shows the weak nonlinear characteristics of the reconstructed VIVF. The proposed model is used to estimate the contribution of every term to the reconstructed VIVF. The percentage of each term of the reconstructed VIVF is shown in Figure 4. The nonlinear part, including
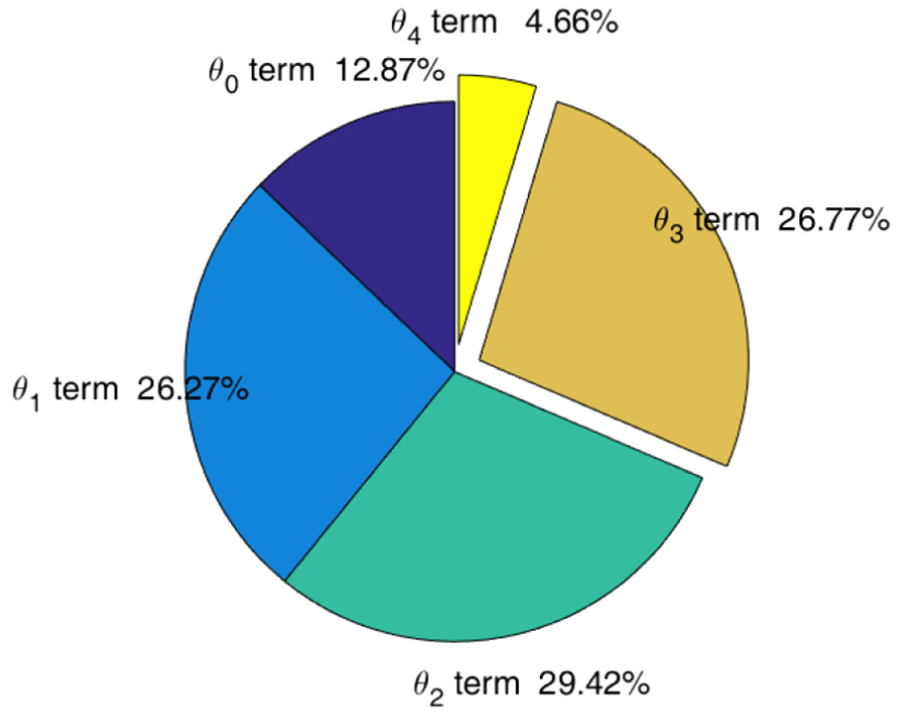
Components of the proposed model.
Comparison of VIVFs
In this section, the performance of the proposed model is compared with Scanlan’s nonlinear model and Zhu’s model. A testing set, including 5000 data from the transient part of the steady stage of the VIV time history, is used to test the performances of the three models, respectively. The parameters in Scanlan’s model and Zhu’s model are shown in Table 4.
The identified parameters. 21

Figure 5 displays the spectrum difference between the measured and reconstructed VIVFs. As shown in Figure 5(a), the reconstructed VIVF has a significant frequency component

Difference between the measured and reconstructed VIVFs: (a) Scanlan’s model, (b) Zhu’s model, and (c) the proposed model.
Figure 6 highlights the nonlinearity of VIVFs. Figure 6(a) displays the relationship of displacement, velocity, and the measured VIVF. As can be seen in Figure 6(b), the reconstructed VIVF based on Scanlan’s model is an ellipse with displacement and velocity, and the shape of the curve is obviously different from that in Figure 6(a). Both curves in Figures 6(c) and (d) are similar to the curve in Figure 6(a), while the position of the minimum VIVF in Figure 6(c) is different from that in Figure 6(a). Thus, the proposed model well describes the VIVF.

The relationship between the VIVF, displacement, and velocity: (a) the measured data, (b) Scanlan’s model, (c) Zhu’s model, and (d) the proposed model.
Figure 7 shows the fitting effect of the three models. The coefficient of determination, denoted as

Comparison of
Residual analysis is a method to evaluate the validity of a model.30,31 The ordinate in Figure 8 is the normalized residuals of VIVF, and the abscissa is the fitted values (the reconstructed VIVF). A blue circle denotes a data point, and the red curve shows the fitting relationship between the normalized residuals and the fitted values. If the residual sequence of a model has a regular distribution or tendency, the model needs to be improved.30,32

The residual plot of VIVF: (a) Scanlan’s model, (b) Zhu’s model, and (c) the proposed model.
In Figure 8(a), the red parabolic curve indicates that Scanlan’s model lacks quadratic terms. Lack of the
In Figure 8(c), data points are randomly scattered and the red line is almost parallel to the abscissa, which indicates that the residual sequence is irregular. Compared with the other models, the proposed model is valid.
Figure 9 shows the validity of the proposed model from the perspective of residuals. The blue bar denotes the frequency of the residuals, the red curve represents the kernel density estimation, and the green curve is the density diagram of the normal distribution. It can be seen in Figure 9 that the residual sequence has a normal distribution. By residual analysis, the validity of the proposed model is verified.

The residual histogram of VIVF.
The proposed model contains important terms corresponding to significant frequencies of the measured VIVF, and these terms have high correlations with the measured VIVF and low correlations with the other terms. Therefore, the proposed model is the most suitable model to depict the VIVF on a flat closed-box bridge.
Comparison of displacements
The maximum vertical displacement response is important to engineering applications. Thus, the validity of the proposed model needs to be furtherly verified by a comparison of the reconstructed and measured displacements. The Newmark-β method and the reconstructed VIVF are used to reconstruct the displacement. Figure 10 shows that the reconstructed displacement has the same frequency spectrum as the measured displacement.

Comparison of the measured and reconstructed displacements for
Figure 11 illustrates that the maximum amplitude varies with the wind speed at the lock-in range for the case of

Comparison of the maximum displacements at different reduced wind speeds.
Conclusion and future works
To better understand the VIVF, supervised learning is used to build a model by deeply mining the information hidden in the experimental data. First, a hypothesis function based on the Taylor series describes the VIVF. Then spectrum and correlation analysis are used to optimize this function. The essence of VIVF signal is obtained by spectrum analysis, and correlation analysis increases the ability to depict VIVFs and keeps the independence of independent variables. Finally, the validity of the proposed model is verified by comparative and residual analysis.
The proposed model has five parameters and is considered as a linear combination of nonlinear functions. The fit effect of the proposed model is better than Scanlan’s model and Zhu’s model. Due to its simplicity and low-computational complexity, the proposed model is easy to apply in engineering.
In China, the construction of large-span highway bridges and long-span high-speed rail bridges has rapidly developed. Machine learning is conducive to further study the nonlinear effects of VIVF of long-span bridges, so more wind tunnel tests on different cross-sectional shapes (including coupled motion and arbitrary motion forms) will be helpful to extend the theoretical model.
Footnotes
Handling Editor: Lalit Borana
Declaration of conflicting interests
The author(s) declared no potential conflicts of interest with respect to the research, authorship, and/or publication of this article.
Funding
The author(s) disclosed receipt of the following financial support for the research, authorship, and/or publication of this article: This work was partially supported by the State Natural Science Fund project of China (Study on hybrid time-frequency analysis method for long-span bridge under non-stationary wind load, Grant No. 51308330), the 2015 Open Fund of Structure and Wind Tunnel Key Laboratory of Guangdong Province (Regularization parameter identification method for bridge vortex vibration model, No. 201502), and the Department of Education of Guangdong Province (2017KTSCX121 and 2017KCXTD015). Thanks to Dr Xiaoliang Meng, Tongji University, for test data.