
Abstract
Slab track systems have the potential to become a more sustainable option for high-speed railway infrastructures than traditional ballasted tracks. Traditionally, the systems that monitor these infrastructures have been costly, but advances in the last few decades have made the use of wireless sensor networks within these infrastructures a feasible solution that can be used to evaluate their degradation for failure detection and prediction. Since the cost of these systems is steadily decreasing, it is now possible to use permanent wireless sensor networks as an integral part of the overall system to pave the way for smart infrastructures that can get real-time information about the structural health of the infrastructure at a relatively low cost. In order to show the suitability of this kind of system to monitor the structural health, three demonstrators, developed in the context of the FASTRACK project, related to the design and construction of a monitoring system for slab track systems that measures vibrations and displacements in the track, are presented. FASTRACK uses an innovative approach where data read by sensors are sent to passing trains, which are used as data mules to upload the information to a remote server. On arrival at the station, the data are stored in a database, which is queried by an application to extract relevant information by means of analysis algorithms to detect and predict failures. The first real scenario tests the limits of the system under stress situations. The second one tests the system in an actual, installed slab track to analyze the suitability of the communication architecture and to study a transition zone between slab tracks to a ballast track. The last scenario deals with the data mule performance tests.
Keywords
Introduction
The process undertaken to identify any damage in critical infrastructures (CIs) such as aerospace, civil engineering, or the rail industry is referred to as structural health monitoring (SHM). 1 The monitoring of these infrastructures is crucial from two points of views: first to reduce the cost of maintenance and repair and second, and most important, to improve public safety. The result has been the development of nondestructive testing and evaluation (NDT&E) which involves the identification and characterization of damage on the surface and interior of materials. 2
Although NDT&E’s traditional methods (especially eddy currents)3,4 are well established and performed well, the cost, maintenance, and measurement can be too high/complex for large-scale infrastructures, such as the rail network. Therefore, a less expensive and a more flexible and useful architecture for this kind of infrastructure which can be a good complement to traditional methods in long-term monitoring processes is proposed in this article.
Wireless sensor networks (WSNs)5,6 have long been identified as having the potential to become an integral part of critical infrastructure protection (CIP). 7 Infrastructures such as oil distribution and management, railways, power distribution, and nuclear power plants can all benefit from WSN deployments to make them safer. In addition, systems based on WSN can be applied to railways where there is room for improvement in the current monitoring procedures. The state of the CI is analyzed using specialized equipment whose cost is too high, sometimes even exorbitant. For this reason, this kind of solution can be only installed for short periods of time. In addition, the Internet coverage can be a problem, and so depending on the scenario, it might be difficult to send data to the remote server to be processed or analyzed.
WSNs were conceived to monitor infrastructures and their fast-paced development and reduced cost have made them really appealing for all sorts of monitoring projects. One interesting line of research is the study of new architectures or applications where this technology can be used to transform the infrastructure into what is called a smart infrastructure, capable of capturing and digitalizing information from the real world to analyze it in the virtual one. 8 Slab tracks are currently being studied as substitutes for traditional ballasted tracks for railways due to their advantages such as long design life, low whole-life cost, reduced dead load, high-speed operation, very low maintenance requirements, or engineered noise and vibration performance but at the expense of a higher price tag. In our approach, WSN is integrated in the slab tracks in order to reduce the cost of installation and maintenance since it can provide real-time data that can help predict and detect abnormal situations. The prototype and system architecture were described in two previous papers: the sensor platform was described in the study by Cañete et al. 9 and the communication architecture was described in the study by Cañete et al. 10 The previous publications studied the feasibility of this solution and came up with a system that meets the scenario requirements while at the same time meeting an important cost requirement; it cannot exceed 10% of the total cost of the infrastructure. In this sense, a real-scenario test of the prototype based on low-cost components needs to be carried out to validate and reproduce all the possible situations. This article focuses on the validation process, the description and results obtained from the demonstrators, and the lessons learned in the context of FASTRACK project 11 funded by the European Regional Development Fund program. The main objective of the project is to design a new slab track system for high-speed trains, which is environmentally and economically sustainable. In this context, a real-time monitoring of the system is vital to meet the project’s requirements. Three main demonstrators have been used to validate the system: a real slab track laboratory demonstrator, a real slab track demonstrator in Valencia (Spain) to carry out a ballast–slab track transition zone study, and a test of the data muling communication architecture.
The first phase was tested in laboratories at CEDEX (Spanish Government Institution for the Study and Experimentation of Public Works) in Madrid. The second was tested at a section of railway in Valencia that has a transition zone between slab tracks (from a tunnel) to a ballast track (out of the tunnel). The third test has been carried out in a straight road in Málaga. To the best of our knowledge, there is no proposal for slab tracks with a WSN integrated in the infrastructure, incorporating such a complete validation process and ensuring the viability of these systems in this type of civil infrastructure.
The rest of the article describes these requirements and the solution provided by the monitoring system. In section “Related work,” related work is presented. Section “System description” describes the system. In section “Testing the system,” the validation of the system by means of three demonstrators is presented. It comprises the evaluation of the communication scheme and the system’s capacity to detect stress situations in the track. Section “Lessons learned” enumerates the lessons learnt. Finally, section “Conclusion” details the conclusions.
Related work
There are several demonstrators for monitoring CIs based on WSN, but this work focuses on railway infrastructures.
A deployment of a railway bridge is presented in the study by Bischoff et al. 12 The WSN is based on TmoteSky nodes and it detects deformations in the infrastructure when trains are passing. It is composed of accelerometer sensors to detect approaching trains. The collected data are sent to a remote control center.
A similar paper, 13 based on TmoteSky WSN, describes the monitoring of a railway bridge where trains are also used as data mules.
SENSORAIL 14 integrates different kinds of sensors (such as temperature sensors and cameras) for the protection of railways. The framework provides information by means of abstractions of high-level programming. It also incorporates a threat detection system based on the information acquired by the sensors.
In the same railway monitoring context, Pascale et al. 15 proposed the use of hierarchically heterogeneous sensors. The sensors deployed in the railways integrate the IEEE 802.15.4 16 protocol to communicate with each other. The system includes an access point that uses more powerful communication technologies, such as GPRS (General Packet Radio Service) or WiMAX (Worldwide Interoperability for Microwave Access), to transmit the information to the control centers.
In the study by Gruden et al., 17 two interesting issues are studied, the behavior of the wireless communication system of sensors with respect to the sensor positioning and energy harvesting techniques to minimize maintenance of the sensors. The behavior of radio transmitters is better when they are placed above the train. The integration of sensors in the wheels makes the energy harvesting easier.
In the study by Scholten et al., 18 WSN are used to monitor the integrity of freight trains. Sensors detect the separation of wagons from the locomotive for no good reason. They propose mechanisms for energy harvesting. However, the hardware prototype does not include any of these proposals.
In the study by Anjali Bissa et al., 19 a WSN is proposed using distance and vibration sensors to report on the state of the route and the presence of other trains.
In the study by Wang and Ni, 20 the use of WSNs is proposed for early earthquake detection and control of security in railway networks. The WSN deployed in areas with high seismic activity is used to detect the onset of an earthquake with enough time to communicate the information to the control center. The control center then takes the most appropriate action depending on the location of the earthquake and its severity, for example, completely stopping the train.
In the study by Aboelela et al., 21 detection of wear and tear on roads is presented. The system integrates accelerometers and ultrasonic sensors.
In the study by Daliri et al., 22 a WSN with ultrasound is deployed to detect possible problems in the railway’s sensors. It also introduces the use of image processing and electromagnetic detection of dangerous objects on the railway tracks.
Zhang and Guiyun 23 proposed an interesting system able to detect railway cracks through RFID grids. Although it is a very interesting approach, a more flexible and useful architecture for this type of environment is presented in this work. Furthermore, the range of data transmission is higher.
Ding et al. 24 described the development of an SHM system to monitor the first 6-track high-speed railway bridge with the longest span in the world. The system is able to detect the bridge’s abnormal behaviors under varying environmental conditions through 28 sensors able to measure the following parameters: longitudinal and vertical displacement, static strain, temperature, and wind. In comparison with our proposal, the system and architecture proposed here is an appropriate solution to monitor specific zones of a railway, but it is not so suitable for monitoring large sections of a railway track due to the high cost of such a solution.
A different approach is proposed in the study by Kudryavtsev and Kleiman. 25 In this approach, the authors propose a cost-effective solution to measure the residual stresses of railway wheels through complex ultrasonic techniques. The main disadvantage of this kind of SHM system is that it cannot be applied in real time.
Chang et al. 26 proposed a novel SHM system using satellite-based interferometric synthetic aperture radar (InSAR) for monitoring railway infrastructures on a nationwide scale. This is probably the least cost-effective solution able to monitor railway structure health, but it does not allow monitoring processes that require a high level of detail.
A WSN to collect train loading and bridge response information is presented in the study by Moreu et al. 27 The system, validated in a real demonstrator, uses strain gages to monitor train loads and accelerometers and magnetic strain gages to measure the bridge response.
A WSN-based monitoring system for railway tracks is presented in the study by Popovic et al. 28 The system comprises two types of nodes: sentinel nodes detect approaching trains and wake-up monitoring nodes which then collect acceleration data.
These proposals are very interesting but they concern the typical railway infrastructures based on ballast and they are deployed in CIs such as bridges. Our proposal focuses on an alternative infrastructure, the slab track installations, as these facilities are more suitable for the passage of high-speed trains. In addition, the necessary studies and tests to validate the viability of low-cost components for this kind of facility are addressed.
System description
A detailed description of system can be found in our previous works.9,10 In section “System requirements,” the main system requirements are detailed. Section “System hardware” shows the system hardware including the communication architecture. Finally, the main characteristics of the control center with the specialized software developed to monitor and analyze the defects of the railway infrastructure are presented in section “Centralized control system.”
System requirements
The monitoring system is considered to be part of the infrastructure itself and it allows information to be collected about the structural health of the railway infrastructure and transmits the results to a remote-control center. The main requirements are as follows:
Sensors have to provide the information necessary to ensure the real-time knowledge of the state of the infrastructure.
The system must collect the frequency of the different vibrations obtained from the acceleration data.
It has to warn about changes in the inclination/position of the slab relative to its original position with a precision of at least 0.1°.
Fault tolerance related to low battery and sensor failure is necessary.
As stated, the system must also be part of the monitored infrastructure. Ideally, the monitoring system is installed during the construction of the slab track in a special receptacle made especially for it (see section “Testing the system”).
System hardware
For the demonstrators, the Arduino MEGA 2560 model has been chosen because it provides more than one serial port, which has been used for debugging, and because it is one of the most powerful boards of the Arduino family. It is a microcontroller board based on the ATmega2560. It has 54 digital input/output pins, 16 analog inputs, 4 UARTs (hardware serial ports), and a 16-MHz crystal oscillator among other interesting features. In a commercially viable implementation of the prototype, a dedicated PCB is the best choice as it provides optimized energy consumption and size. The platform used in the tests integrates an ADXL345 accelerometer sensor and an SCA100T-D2 inclinometer. An additional distance sensor and a 1.5 W solar panel could be installed in the system to measure distance between slab tracks and to increase the lifetime of the battery that supplies energy to the board, but they have not been used in the demonstrator presented. Finally, the sensor platform has been equipped with the XBee communication modules described in the following sections. A complete description of our chosen sensor platform is given in the study by Cañete et al. 9
Figure 1 describes the system, where nodes are a part of the slab track integrated during the installation. Sensor nodes are deployed in the railway slab tracks and the information they collect is sent to passing trains as indicated on the right-hand side of Figure 1. All the information generated by the system is collected by the trains and sent to a remote time series database (Database OpenTSDB). A monitoring and management application located at the control center queries the information in the time series database and its own database to show and extract useful information as detailed in section “Centralized control system.”

System behavior.
It is not necessary to install it in every slabs and it will depend on factors such as the cost of the monitoring system or the criticality of the railway section. The information collected by the sensors, after being partially analyzed and reduced, is sent from the sensor nodes to sink nodes placed on each of the passing trains. Finally, trains send the information to the remote-control center as trains usually have Internet connection. Trains are used as data mules to cope with the coverage limitations of railway infrastructures in far areas.
Centralized control system
The information gathered by the different sensor nodes deployed in the field is sent to a control center where the data collected by the trains from the slab tracks is stored. An OpenTSDB (Time Series Database) has been integrated into the system from which it is possible to query data from the nodes deployed in the slab track and to define defect patterns and enable warnings when they are detected.
Figure 2 shows how it is possible to define filters to analyze the data extracted from the slabs and also to monitor the slab track deployed.

Control center: data analysis.
Testing the system
In order to validate the proposed system, three different test scenarios have been carried out. The first one, in a special infrastructure-testing laboratory, called CEDEX, in Madrid, to test the limits of the system. It has undergone a fatigue test to validate the integration of monitoring system with the track. This scenario allows us to validate the analysis algorithms developed in the project. It has served to test whether or not the system is able to collect vibrations to analyze the structural heath. The analysis algorithms will detect the variation of natural frequencies of the structure that will be obtained from operational modal analysis (OMA) procedures, as will be explained in later sections. The second scenario was an actual installation in Valencia. A WSN was installed in a railway section to collect acceleration and inclination data from the railway infrastructure. Finally, the last scenario studies the behavior of data mules and their communication capabilities.
Analysis method
In order to analyze the collected data, first it is necessary to calculate the vibration modes and frequencies. OMA is used in large structural systems, such as bridges, and has the following advantages over experimental modal analysis:
It is a cheaper trial, since only facilities are needed to measure the response of the structure.
The test does not interfere with the service operation of the structure.
The measured response is a set of data representative of the actual operating conditions of the structure.
By not having to apply loads to the structure, the integrity of the structure is not put at risk when performing the test

In contrast, in this type of analysis relatively small responses are registered, very affected by noise, and since the excitation is unknown, the analysis is much more complex. Therefore, more precise equipment, a careful treatment of the data, and a high computational capacity are needed. The frequency domain decomposition (FDD) 29 has been used. The theoretical foundations of this method are based on the study by Brendat and Piersol. 30 The relationship between the excitation x(t) and the response y(t), measured by the monitoring system, can be expressed in the frequency domain as shown in formula (1) where:
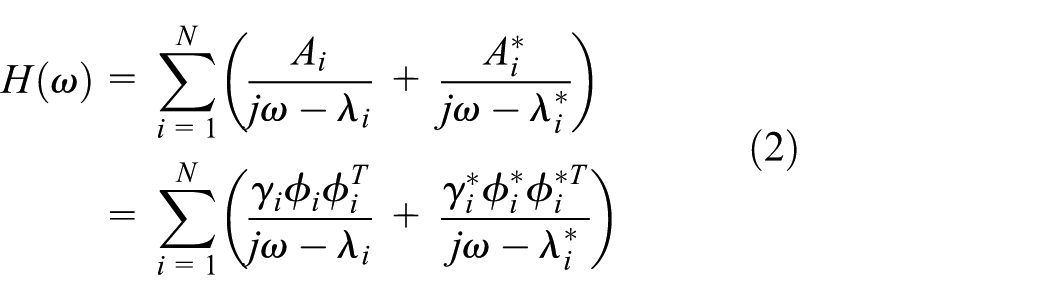
The matrix frequency response function is usually expressed in the form of residuals and poles as depicted in formula (2) where:
i is the mode index;
N is the number of modes;
Considering the excitation as white noise, so the power spectral density (PSD) of the excitation will be a constant diagonal matrix


Using the own orthogonal decomposition method, from the spectral density of the response, the eigenvalues and spectral eigenvectors of the system are obtained, as shown in formula (4) where:
M is the number of decompositions

Estimating that a valid approximation of the spectral density of the response of the system is that it is of first order, it must comply with formula (5).
The eigenvalues and eigenvectors of the first order are the dominant ones in terms of energy contribution in the response of the system; therefore, these values contain all the information to be able to obtain the natural frequencies and the own modes. The ith modal form associated with the ith natural frequency
From the theoretical developments shown up to now, the algorithm or procedure for the identification of own frequencies and modes through the FDD method is shown in Flowchart 1. The steps to follow in this procedure will be accompanied by calculations of real data from the experiments over the slab track railway:
A set of acceleration data of the different sensors positioned in the railway is obtained, as well as the sampling frequency with which the data has been taken.
The matrix of crossed spectral densities is obtained from obtaining the cross-spectral density of each time series by sensor, with the rest of the time series captured. For this calculation, the Welch 31 calculation method will be used. The crossed spectral density calculates the energy distribution as a function of the frequency crossing two synchronized time series of the same structure but with different location of the sensors. The dimensions of the cross-spectral density matrix will be (n×n×L) where n is the number of time series taken into account and L is the length (in data) of time series in the frequency domain. Therefore, this matrix is a hypermatrix (three dimensions) in which the largest dimension contains the discretization information in frequencies and the slices with respect to this axis of the hypermatrix are the cross-relationships between each of the signals at each given frequency.
For each frequency of the cross-spectral density matrix, the decomposition is performed in simple values by the own orthogonal decomposition method, obtaining the eigenvalues and eigenvectors of each slice of the hypermatrix (n×n×L). All the eigenvalues and eigenvectors of the first order of each of the slices of the hypermatrix are selected and packaged in a vector of eigenvalues of the first order and in a matrix of eigenvectors, all as a function of each discretized frequency. From the eigenvalues and eigenvectors of the first order, the natural frequencies and the associated modal forms will be obtained, as explained in the theoretical foundations section of the method.
It is usual to shorten the range of frequencies in order to detect the different resonance peaks within the spectrum of singular values of the first order of the previous stage. For this purpose, a range from 0.25 to 30 Hz is usually considered, a sufficient frequency range for the first proper modes in the usual structures to be considered.
A selection of local maximums is made by means of a search algorithm, and thus the number of natural frequencies desired is obtained
Once the resonance peaks of the spectrum of the first-order singular values are selected, the eigenvectors associated with them are located and selected as modal forms of the structure.

FDD method to identify frequencies and modes.
The damage detection will be carried out from changes in the calculated modal parameters from the data collected. In order to avoid loss of information from the data, they are organized in overlapped windows to get natural frequencies applying the described FDD method. The information must be grouped to determine the frequencies associated with the modes themselves. The applied algorithm for the clustering data is the DBSCAN algorithm. 32 It groups together points that are close to each other based on a distance measurement (usually Euclidean distance) and a minimum number of points. It also marks as outliers the points that are in low-density regions. Two parameters are needed, the distance and the minimum number of required points to consider a dense region. Applying the algorithm to the vibration data the groups are determined, considering the more common natural frequencies.
As described in section “System description,” data are stored in the database and the application carries out the clustering. It includes an automated alarm generation. It can be configured defining different warnings considering the variations of frequencies between data collected and FDD model calculated (see Figure 3).

Alarm generation.
Real slab track laboratory demonstrator:CEDEX tests
In this test, the monitoring system is an integral part of the slab track and is installed in the slab track during its construction. This test was designed to evaluate if the system was able to detect stress situations.
The system of slab track installed in the CEDEX was formed by five slabs. Three of them enabled the integration of the monitoring system. During the fabrication of each of these slabs, a special receptacle made of plastic was placed in one of the ends of the slab (shown in Figure 4 in red). Sensor node components are installed in the external housing shown in Figure 5. Once the tracks have been installed, the external housing is inserted in this receptacle.
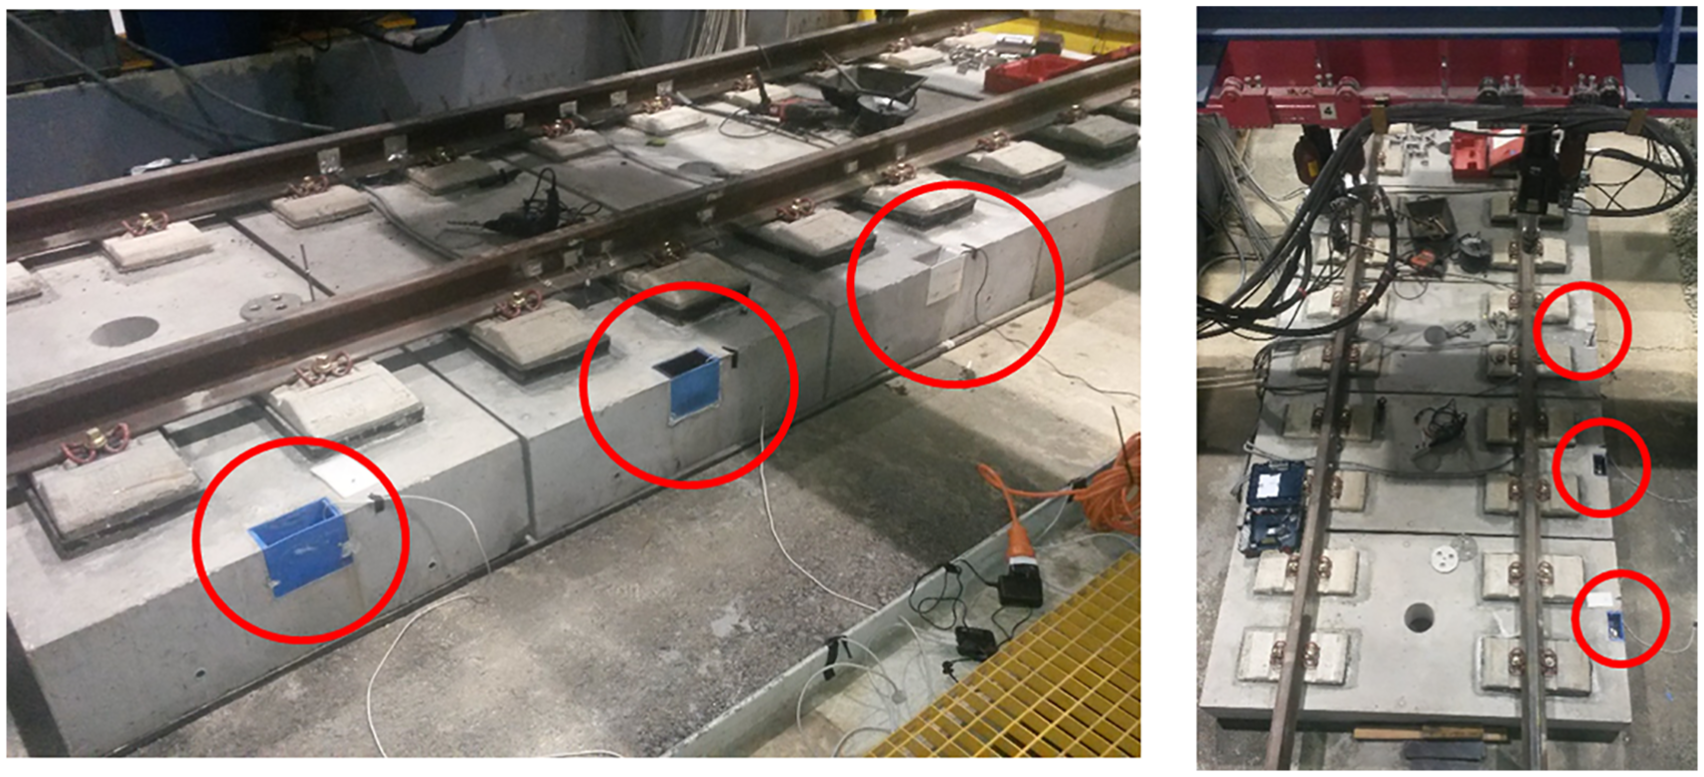
Slab track demonstrator in CEDEX.

Internal casing that is inserted in the slab track: (a) top view of container, (b) side view of container, (c) lid of the container, and (d) external housing.
The integration of the monitoring system in the infrastructure is one of the main innovations of this proposal. Testing the suitability of the integrated housing was another important result of this scenario.
To anchor the external housing firmly to the container, so that the vibrations of the track can be measured, it is screwed into both the base (5 screws) and the top of each corner (4 screws). The electronic elements were not placed at the bottom to avoid possible problems of humidity in the base.
Finally, the container is covered by a lid to isolate the contents of the housing. The lid is bolted to the container at all four corners. In addition, the lid includes a small gap (shown in Figure 5(c)) to install the solar panel in it, with a small hole to pass the cable through to inside the housing. This design simplifies maintenance and replacement of nodes since the whole sensor node can be easily installed and removed from the slab track.
Figure 6 shows the main components of the node. The outer case is the special receptacle installed as part of the slab track during the construction. The darker inner case is the external casing that contains the node components and is inserted inside the outer case. The lid is not depicted in the figure.

Components for validation in CEDEX.
Test protocol
Each sensor node has a program which controls the sensors and other components and also that each action is carried out at the specified time. Once each monitoring node has been activated, within it an algorithm in charge of carrying out the data capture process is executed (see Flowchart 2). It consists of the following:
Reading data. Read at a frequency of 800 Hz data from the three axes (X, Y, Z) of the accelerometer for 20 s and store them on the SD card attached to the monitoring device. This process is repeated N times. Readings from the inclination of the track plate are taken several times a day.
Data analysis. After the reading loop, a new phase begins where the Fourier transform is applied to the acceleration data to transform them from the time domain to the frequency domain. Data in the frequency domain are analyzed to detect the three frequencies where the peaks with the greatest amplitude occur. The results give the main frequencies at which the infrastructure vibrates to reveal its structural health.
Sending data. Finally, the three peaks obtained from the previous analysis (together with the tilt data taken) are sent wirelessly to a computer (base station) where they are stored in a time series database called OpenTSDB.
The data capture process has been repeated cyclically once per hour for the entire testing phase.

Data capture process running within a node.
Test 1
The test corresponds to a fatigue strength test carried out as part of more general validation tests. Actuators installed in the track exert pressure on it that follows the form of a sinusoidal signal of frequency 6 Hz (the actuators are shown in Figure 4). The applied pressure range is 14 tons varying between a minimum of 8.24 kN and a maximum of 145.58 kN.
To see the nature of the peaks obtained, an analysis of the amplitude of the observed peaks was performed for all nodes in the scenario. Figure 7 shows the biggest peaks obtained in one of the nodes during the test. It is observed that the amplitude of the peaks is not significant and therefore the peaks obtained are not meaningful. The low amplitude obtained is because the test of fatigue resistance does not produce great vibrations in the plate track since the actuators installed in the way apply pressure gradually and therefore the vibrations in the track in plate are minimal.

Amplitude of frequency peaks for one of the nodes.
However, this test has been useful as a first test to validate the monitoring system, the data analysis algorithms, and the communications system. All of these have worked correctly for the duration of the test.
Test 2
The second test simulates a number of trains passing by. The main objective of these tests is to detect the vibrations and test the operation of the monitoring system in a more realistic environment. In this test, a series of three actuators applied a progressive and synchronized hit to the railway tracks to imitate the passage of a train.
The amplitude obtained in the biggest peaks detected for one of the nodes is shown in Figure 8. It shows a series of zones where the amplitude obtained is significantly large and therefore corresponds to instants of time where acceleration in the railway track has been detected. The zones where there are no peak data correspond to zones where the actuators were not working.

Amplitude analysis of one of the nodes.
After carrying out a subsequent analysis of data capture by the nodes like the one shown in Figure 8, the algorithm is able to find the first, second, and third biggest peak in the frequency domain obtained during each acceleration collection period for one of the axes. In this particular test, the peaks obtained correspond almost unequivocally to three main frequencies: 22, 25, and 18.75 Hz.
It can be observed that the system is capable of picking up the main vibration frequencies produced in the slab track in response to a train’s vibration. This analysis should be complemented with the data collection and its subsequent analysis in real tracks in different environments and under the action of different trains. This would identify the set of vibrations corresponding to a healthy slab track. Once this range is known, techniques for detecting variations in the behavior of the slab track can be applied using the application presented in section “Centralized control system.”
Valencia railway tests
The CEDEX tests allowed us to guarantee the system can collect the necessary information to analyze and to detect the structural health of the tracks. These tests were developed in a controlled environment where the communication architecture was not affected by real interferences. In this new test, the communication architecture was tested to guarantee the system is able to communicate the information to the trains and also to collect and analyze the response of the infrastructure while passing trains are using it. It, therefore, serves to assure the suitability for structural health analysis. In order to validate this situation, our monitoring system was deployed in a railway installation in Valencia. The sensors were directly attached to the railway to detect vibrations via acceleration sensors. The system deployment was composed of a total of 32 nodes distributed in two different deployment areas as depicted in Figure 9.

Validation test in Valencia deployment.
The two different railway sections correspond to transition zones, that is railway sections where the track changes from ballast to slab track and vice versa. Each railway section has two railway tracks (one for each direction). For each section and each direction, eight monitoring nodes have been deployed on one side of the railway track to study the acceleration readings when the trains are passing by. The real time clock of each sensor node has been programmed to capture acceleration data when the trains are passing by, based on the train schedule and the collected data is sent to a sink node located in a cabin near the slab track. The sink node has a GPRS module which sends the information to a remote-control center that stores the data and analyzes it.
Figure 10 shows some photographs of the deployment. The accelerometer is attached to the railway track using Teromix 6700 (polyurethane two-component adhesive) and connected to a sensor node with wireless capabilities that sends the information to the sink node. Each sensor node is powered by a 7.4 V 2200 mAh battery.
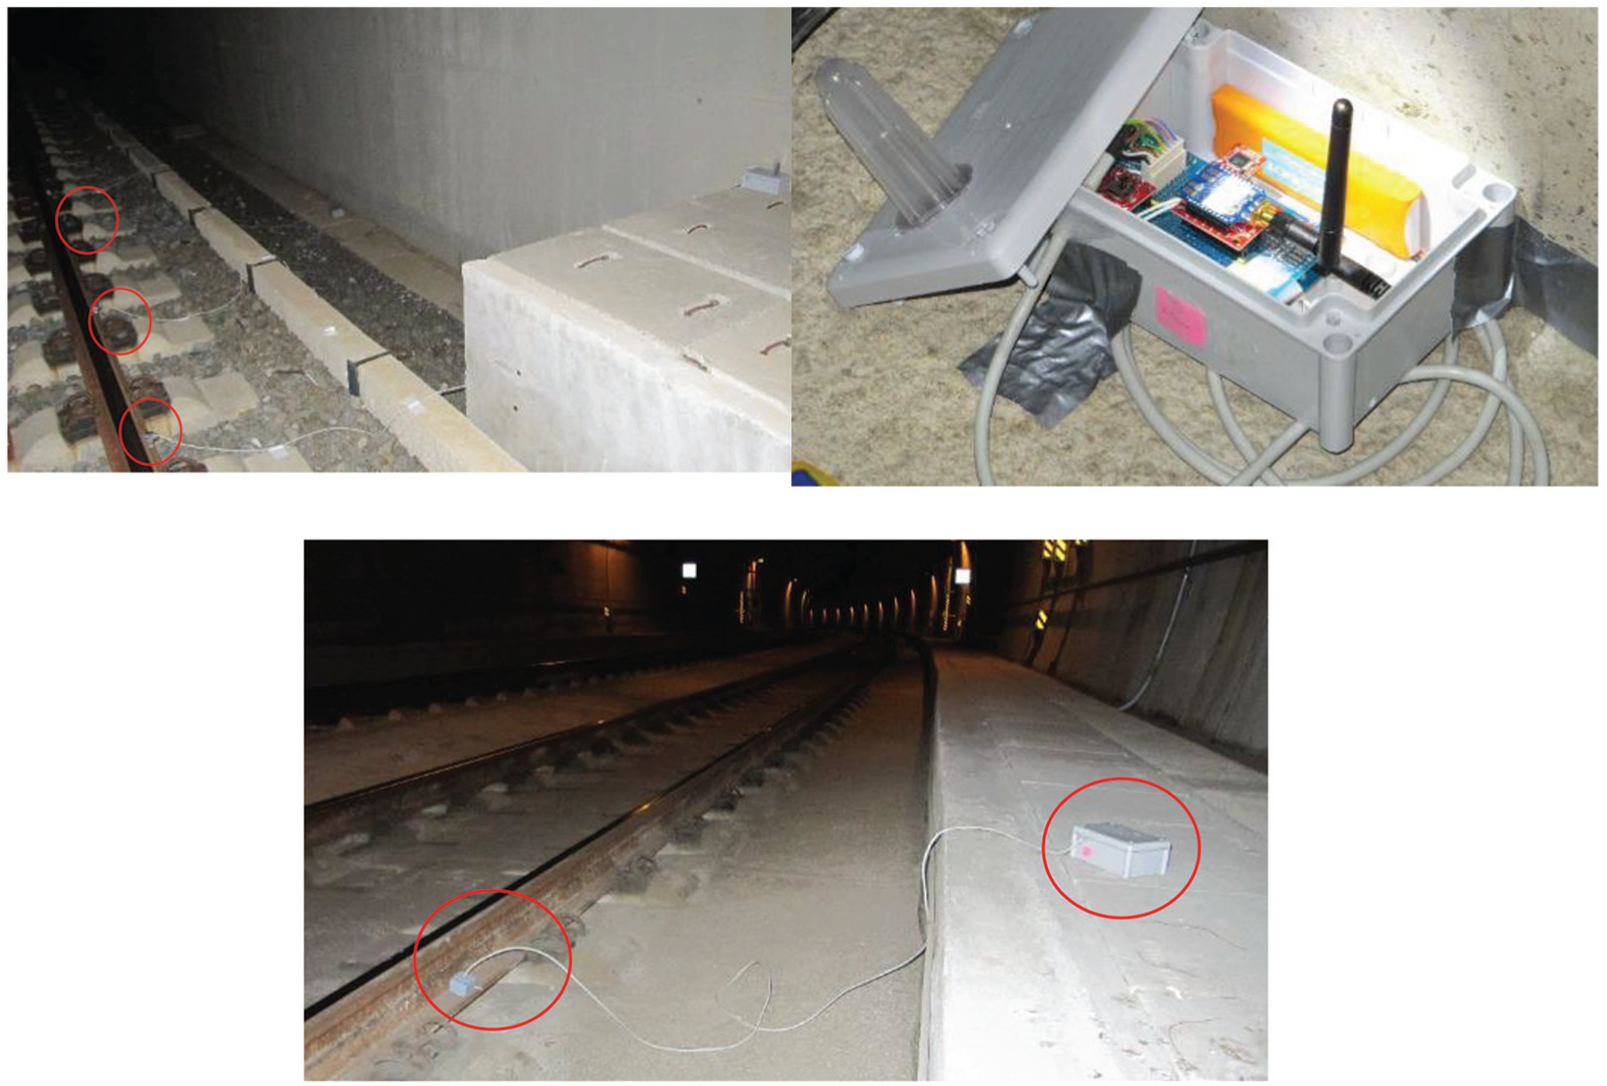
Valencia test. Photos of the deployment.
During the 2-day deployment, 14 sets of acceleration data corresponding to 14 trains were collected. The data were collected and relayed to the base station where a web GUI was installed to be able to visualize this information. In order to prevent loss of data all the data that was transmitted was also stored on the SD of each sensor node. It was verified that there was no data corruption by comparing the data on the SD with the data received in the sink node.
Figure 11 shows a graph of the acceleration data collected for a single train passing through a single railway track in one of the sections. All eight nodes deployed in a single railway track of one of the sections have collected the acceleration data when the train was passing by. A model has been designed and calibrated using this information in order to reproduce the behavior of the real infrastructure when the trains are using it. Based on this model, it has been possible to determine the optimal parameters in the stiffness transition in the terrain studied that guarantee the correct behavior of the infrastructure.

Accelerations when trains pass.
Data muling tests
The proposed communication architecture uses trains as data mules to collect the information obtained in the slab tracks. In order to validate the data muling performance, a test has been performed in a simulated scenario where the amount of data that two radio modules are capable of exchanging when one of them is moving has been measured. These tests could not be deployed in a real scenario because access was forbidden by the authorities. The train was simulated using a car driving at a controlled speed. The vehicle drives along a straight road 2.1 km long. The sensor node located on the ground continuously transmits information to the car. The car starts from a location where the radios are out of range, then passes to the sensor node on the ground and continues until the radios are again out of range.
The results obtained are shown in Figure 12. Based on linear extrapolation using 0 dBi antennas, a single transmitter would be able to transmit about 5 100-byte packets to a train moving at 320 km/h. Thus, if an average of five nodes in range of each other communicating with the train is assumed and knowing that the physical medium for communication is shared, the data muling scheme proposed is feasible. Depending on the amount of information that needs to be sent, it might be necessary to use additional mechanisms to increase the effective bandwidth of the radios that send information to the train. For instance, the use of multiple radio receivers on the train, for example, one at the front and one at the back, the use of more powerful antennas, and the use of more sophisticated channel access methods such as TDMA (time division multiple access). A detailed explanation of this test can be found in the study by Cañete et al. 10
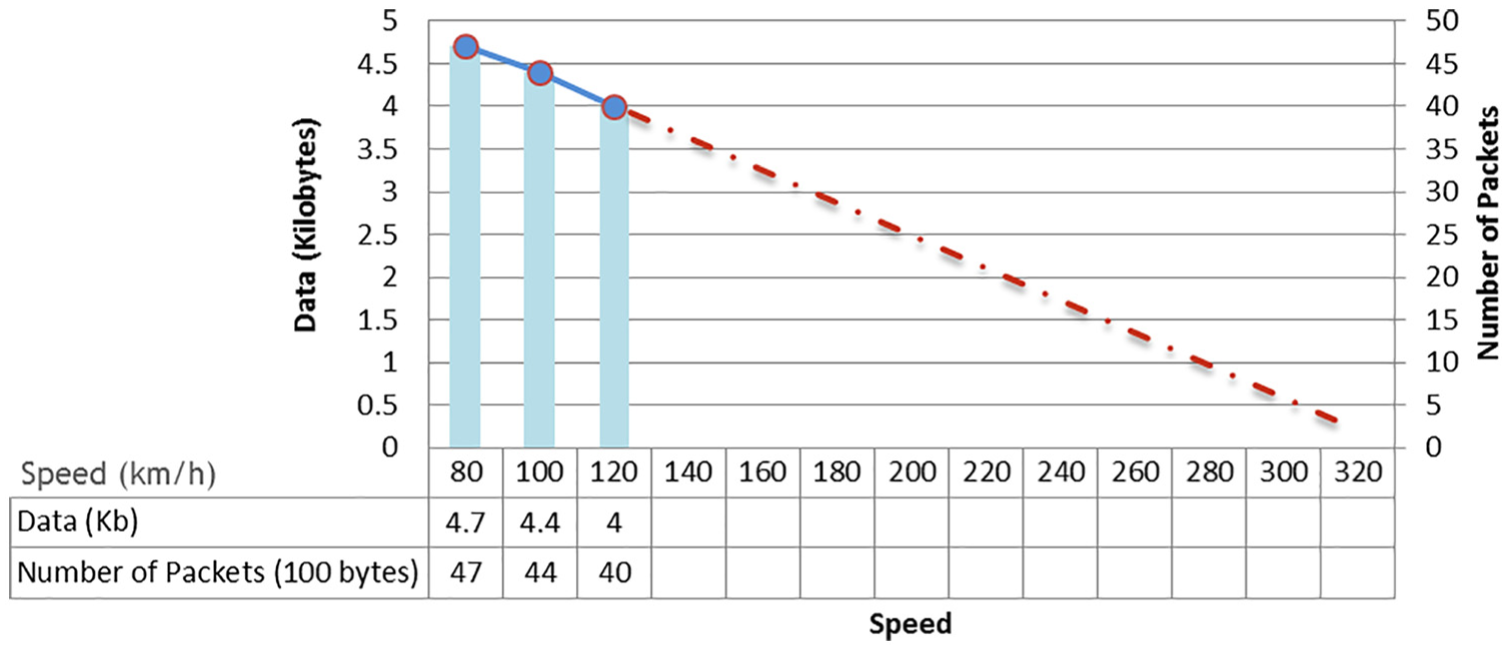
Relationship between data rate and speed of the mobile sensor node.
Lessons learned
To the best of our knowledge, this article presents the first monitoring system in which the monitoring device is fully integrated with the train track. The system is mainly based on the detection and analysis of frequencies generated after the train passes, which vary according to the structural health of the tracks. There are still many aspects that need to be evaluated or improved in order to considerably improve this system. For example, it would be useful to develop the container and the internal housing where the monitoring device is integrated with other kinds of materials to see if it is possible to achieve an improvement in the transmission of vibrations obtained by the accelerometer. This system is able to detect the vibrations, but it is highly probable that the sensing could be made more sensitive by changing the encapsulation materials. Regarding the classification of faults according to the frequencies detected, it would be very interesting to design and test intelligent algorithms (e.g. neural networks) to classify the signals produced by the train according to their amplitude and frequency. A critical point has been the wireless transmission of data; in this field, it is necessary to continue testing new communication topologies considering new communication technologies such as Lora or SigFox. Despite that many things can still be improved, the main idea behind this proposal, which allows directly instrumenting the slab tracks, can considerably reduce the costs of new kinds of real-time monitoring systems able to carry out long-term monitoring processes.
The scenarios described have taught us the following lessons about the suitability of our proposal:
The monitoring system optimizes data communication since it applies an algorithm that sends only the three main vibration frequencies instead of all the raw vibration data and therefore increases the system’s lifetime.
Sleep mode is essential for the sensor node in order to lower the energy consumption to a feasible extent.
The system is capable of taking the necessary data at the set frequencies.
The proposed algorithm is correct since after comparing the results obtained with a subsequent offline analysis from the raw data, similar results were seen in both.
The main frequencies of vibration detected are in line with the results obtained in the numerical models, so the whole strategy of structural monitoring from vibrations is feasible.
Although the received information generated by the monitoring nodes and transmitted wirelessly to the base station has not shown any problems since the data were not corrupt, there were interferences in the Valencia deployment scenario. The reason for these interferences is unknown as the monitoring system was only authorized to be within the deployment site for the 2-day test’s duration. A site study before the deployment is essential to examine possible interferences or other factors and prepare the deployment accordingly.
The data received in the base station have been successfully stored in the proposed time series database (OpenTSDB) for this project.
The external and internal casings have been manufactured from ABS (acrylonitrile butadiene styrene) material, which has not had a good result. In a future operation of this system, it would be better to use a more resistant plastic material. Since the costs of designing a mold was beyond the budget of the project, this option was chosen. However, in the process of integration of the outer shells with the plate path, these have been deformed. Possibly, a control in the integration and manufacture of the plate could be necessary to avoid this situation. In the case of a real-world integration, a mold should be designed that could be mass produced.
Conclusion
In this article, the development of a permanent monitoring system to analyze the structural health of a slab track has been presented. Economic viability was an important challenge in this project. This way, the use of low-cost components was the only possibility to create a smart infrastructure with a fully integrated monitoring system. To ensure that this proposal can collect and analyze the necessary information to guarantee the control of the infrastructure and meet the cost requirements specified within the project, it has been installed and validated in real scenarios in a way that allows us to ensure that the system is valid to control defects in real time. Some important lessons have been learned. Based on the results obtained, it can be concluded that the complete integration of monitoring systems in the infrastructures at a reduced cost is feasible.
Footnotes
Acknowledgements
We would like to thank Javier Morales and Francisco García from Cemosa for their support in the theoretical review of the method of analysis.
Handling Editor: Paolo Bellavista
Declaration of conflicting interests
The author(s) declared no potential conflicts of interest with respect to the research, authorship, and/or publication of this article.
Funding
The author(s) disclosed receipt of the following financial support for the research, authorship, and/or publication of this article: This work was funded by the Spanish projects ITC-20131017 (“Fastrack: eco-Friendly and Sustainable slab TRACK for high-speed lines”), TIC-1572 (“MIsTIca: Critical Infrastructures Monitoring based on Wireless Technologies”), and TIN2014-52034-R (“An MDE Framework for the Design and Integration of Critical Infrastructure Management Systems”).