
Abstract
To reveal acoustic emission and electromagnetic emission effects during hard rock impact failure is a crucial issue for monitoring and warning rockburst risk induced by hard roof fracture and fall. The presented research focuses on acoustic emission and electromagnetic emission and microseismic effects detected during laboratory tests and by in situ multi-parameter observations, and the field observations agreed satisfactorily with the experimental evidences. The following main conclusions were drawn: (1) the stress level, frequency of micro-cracks, and impact failure regularity of hard rocks can be revealed with electromagnetic emission and acoustic emission/microseismic parameters, respectively; (2) acoustic emission/microseismic event counts can directly reveal the cracks change in rocks, and the initiation, propagation, and coalescence of micro-cracks can be presented as first increase, followed by decrease in acoustic emission/microseismic event counts; (3) in most cases, only when stress suddenly decreases or the rock final collapses, acoustic emissions show obviously abnormal; and (4) acoustic emission/microseismic can be more effectively applied to warn rockburst danger. The above conclusions may shed light on the effective monitoring and warning methods of rockburst triggered by hard roof fall, and events contribute to some interpretations to originally transient precursors of hard rock fracturing.
Introduction
Rockburst in China is a kind of serious threat to production and is widespread in deep hard rock mass due to a large amount of elastic energy accumulation. For instance, on 3 November 2011, a disastrous rockburst happened in the 21221 working face headentry of the Qianqiu coal mine (QCM), which caused sudden release of the accumulated gas with the concentration of up to 20%. According to official investigation, the overlying hard conglomerate roof fracturing with the thickness of 410–650 m as an important triggering factor was clearly revealed. In addition, a rockburst occurred at the Junde coal mine (JCM) on 15 March 2013. Based on microseismic (MS) observation and prudent analysis, the accident was triggered by overlying coarse sandstone roof fracturing with the thickness of 19.3–70.4 m. A large number of induced MS events clustered in deep-buried and hard coal and rock mass along with mining activity, many of which were potentially damaging. Although many attempts were made to forecast such damaging events, it was not in general possible to predict when the damaging events would occur. Even knowing the possible location of a potential MS event, it was not accurately determined whether the MS event would cause damage and which regions of the excavation would be involved, indicating that the source was not generally consistent with the actual damage location.
Accurate prediction of rockbursts has been a conundrum for centuries in rock mechanics and coal mining communities. Especially, the brittle nature of hard rock can make it difficult to detect the early symptoms of rockburst failure using conventional indicators such as displacement or stress. However, rock sample subjected to stress can generate acoustic emission (AE) and electromagnetic emission (EME), and such signs can be experimentally detected in advance and further treated as precursors of upcoming rockburst failure in practice. Laboratory studies of rock fracture in many cases serve as model experiments that reproduce large-scale processes in geostructures, such as mine shocks and earthquakes.1–6 Many researches have been conducted fruitfully. For example, Matcharashvili et al. 7 found that the extent of order in time distribution of AE bursts clearly increased at stiffer springs with different stiffnesses of spring–block system. Cheon et al. 8 suggested the criteria for fracture types and damage levels using the trends and ranges of AE parameters. Lehtonen et al. 9 believed that AE Kaiser Effect was likely to be most effective where there was a simple geological history. Shear-type AE events could be consistent with tensile fracture associated with micro-cracks. 10 A good correlation was established between the amount of cracking simulated numerically and the experimental AE counting. 11 The emergence of low-frequency AE just before rock failure described the transition from diffused microcracking to localized macro-cracks. 12 Schiavi et al. 13 observed the frequency drop in low-frequency AE signals prior to rock failure. Lockner 14 reported the strong correlation between AE activity and inelastic strain. De and Ananthakrishna 15 found that AE activity for slip events show the exponential with corrections in terms of time to failure. Filimonov et al. 16 demonstrated a large effect of confining stress on AE activity in ductile rock. Li et al. 17 established a physical modeling system of hard roof fracture mechanism and studied the characteristics of AE signals during the process of hard roof failure. Nardi and Caputo 18 concluded that the fracturing played a fundamental role in the EME. Frid19–21 and Frid and Vozoff 22 presented the EME theoretical criterion of rockburst detection based on measurement of the anomalous EME activity much earlier than AE and applied EME for water infusion performance control in coal mines. In addition, the variation in EME amplitudes and rate allowed detecting the stages of nucleation, development, and manifestation of a dynamic event in rocks. 23 Bahat et al. 24 calculated the fracture sizes using the value of the pulse frequency of EME signal. Wang et al. 25 revealed the relationship between EME and stress in coal mass. The EME effect was directly related to the formation of fresh surfaces. 26 Troyanov et al. 27 conducted the simultaneous measurement in seismoacoustic emission (SAE) and EME in wells when studying the information on manifestation of deformation processes. The onset time of EME was found to coincide with the origin time of AE. 28 Compared to AE widely adopted in lab, the MS was investigated fruitfully in field observations. MS signals can be used to distinguish the fracture or damage in rock under high stress, as well as the damaged areas,29–31 especially for the fracture events of hard rocks accompanied with rapid release of energy.32–34
The phenomena of AE and EME that are met when a rock material is about to fail due to mechanical reasons are most interesting, especially when the rock belongs to the category of hard geomaterials, since such phenomena are promising candidates of rockburst failure precursors.35–37
Unfortunately, the comparative analysis of AE and EME effects during hard rock fracture until failure have not been paid much attention in coal mining community, and the differences compared with soft-ductile rock are not sufficiently studied yet.
In this article, AE and EME obvious manifestations called mutation effect were generally observed only in correspondence with sharp stress drops or final collapse. Especially, an excitation was to find a new failure type of hard rock, which was called the delayed rockburst (DR) as a special dynamic phenomenon in underground engineering. In addition, the mutation effect of AE and EME experimentally discovered was fully demonstrated by in situ observations prior to a rockburst induced by hard roof fall. 38
Uniaxial compression tests of hard rock samples
Samples
The cores were collected from two directional boreholes drilled inside surrounding rock of the 3# coal seam in the Muchenjian coal mine (MCM) characterized by strong rockburst tendency, and the lithology is siltstone and fine sandstone. An intensive rockburst hazard occurred in the 3# coal seam severely destroyed more than 530-m-long roadway in 2004, which caused a number of casualties. Especially, the shock wave generated by the rockburst significantly affected the adjacent working faces and roadways.
Via the standard ISRM, the cores were processed to the standard rock samples (φ50 mm × 100 mm) in lab. Total 11 samples were prepared, 6 of which were from the 3# drill core, and the rest were from the 4# drill core.
Load device and the Disp-24 AE workstation
Experimental system can be classified into load device and monitoring equipment. Load device used electro-hydraulic servo universal testing machine which can precisely control load speed and the load, and complete stress–strain curve of rock sample deformation and failure can be recorded. AE and EME acquisitions were accomplished by the Disp-24 AE workstation. The system contains 24 channels, 12 of which can record waveform and analyze real-time or post frequency-spectrum characteristics. Using the corresponding sensors, AE and EME signals can be simultaneously collected.
The Disp-24 AE workstation in general consists of preamplifier, filter circuit, A/D converter module, waveform processing module and computer, and so on. The basic operating principle of the system is as follows: the signals collected by AE and EME sensors were first pre-amplified and then were sent to the filter circuit by coaxial shielded cable. Second, the filtered signals were sent again to the 16-bit A/D converter module. After conversion, the digital signals were stored in the buffer. Eventually, the signals were transmitted to computer for further processing and displayed by the peripheral component interconnect bus.
Parameters setup of the Disp-24 AE workstation and test procedure
In this experiment, a total of three channels of the AE system were used, the channels #1 and #2 collected AE signal and channel #3 collected EME signal. Both preamplifier coefficients of AE and EME were set to 40 dB. The center frequency value of AE sensor was 7.5 kHz, and the threshold value was 60 dB. The center frequency value of EME dot-frequency antenna was 20 kHz, and the threshold value was set to 90 dB. The sampling rates of AE and EME signals were both 2000 kHz, and the sample length was 5 K. The threshold values of AE and EME were determined based on field observation results during rockbursts, as well as experimental results of hard rock from rockburst mines.
Displacement control mode was adopted in this experiment, and the loading speed was 0.005 mm/s. The stress, AE, and EME signals were recorded during loading, and the starting time of loading was synchronized with the recording of the AE system. The test system sketch is shown in Figure 1.

The sketch of test system. Notes: (1) A, B are the loading ram and gaskets, respectively; (2) a, b are the AE sensors and receiving antenna of EME, respectively; and (3) R is the rock sample.
Results and analysis
The results of six typical samples were analyzed in detail including four samples of the 3# drill core and two samples of the 4# drill core. By measuring AE and EME signals during deformation and fracture until final impact failure, the corresponding precursory effects were demonstrated as follows: AE manifestation is not obvious, while EME amplitude gradually increases with loading before impact failure. AE and EME intensity simultaneously reach the peak during impact failure and then both drop sharply.
Figure 2 shows the stress, EME amplitude, and AE energy variation curves of the samples 3#-1–3, 3#-5, and 4#-2 in whole process of deformation and fracture until impact failure.

Stress, EME, and AE variations of the samples during deformation and fracture until impact failure: (a) Sample 3#-1, (b) Sample 3#-2, (c) Sample 3#-3, (d) Sample 3#-5, and (e) Sample 4#-2.
From Figure 2(a)–(c), during initial loading, AE was not recorded because micro-fractures did not form inside sample. However, EME amplitude gradually rose with the increasing stress. Once the sample began to fracture, the obvious appearance of AE was recorded. During the sample impact failure, AE and EME intensity simultaneously reached the peaks. After that, both dropped sharply, and AE disappeared. From Figure 2(d), during loading (t = 0–77.4 s), AE was not observed, and while EME amplitude gradually rose with the increasing stress. During the sample impact failure (t = 77.44 s), AE and EME intensity simultaneously reached the peaks and then both dropped sharply. The maximum values of EME amplitude and AE energy rate were 27,626 mV and 14,621 mV ms, respectively. Compared with the test results of the samples from same core, it was found that EME amplitude increased about 30 times, which possibly related to the level of quartz piezoelectric material in the sample. However, AE energy rate did not significantly change, indicating that the release of strain energy determined AE intensity. From Figure 2(e), when micro-fissures were generated (t = 87.17 s), stress dropped suddenly, AE began to appear, and EME amplitude reached the peak. During the sample impact failure (t = 96.84 s), AE energy rate reached the peak. After that, AE and EME decreased sharply.
Figure 3 shows the typical photographs of above-mentioned rock samples after impact failure.

Typical photos of rock samples after impact failure: (a) remnant of rock sample and (b) small fragments ejected outward from samples.
Based on the impact failure process of the samples, it can be demonstrated that the damage pattern of the vast majority of rock samples can be characterized by instantaneous and high-intensity splitting, simultaneously accompanied with high-speed ejection outward of fragments. Before impact failure, AE was missing or not obvious because micro-fissures did not significantly form in samples.
At initial loading stage, the significant AE signals were recorded, and EME amplitude gradually rose with the increasing stress. When stress reached the peak value, the sample did not destroy, but a large number of micro-fissures were internally generated and mainly propagated along vertical direction, which caused a sudden drop of load, obvious appearance of AE and the peak of EME amplitude. After that, EME amplitude decreased suddenly with sharp drop of load. At stable load stage, EME amplitude maintained stable in a lower level. After a delayed period, the sample suddenly damaged as the type of impact failure called DR and EME amplitude obviously reduced, while AE energy instantaneously reached a peak.
Figure 4 shows the stress, EME amplitude, and AE energy variation curves of the sample 4#-1 in whole process of deformation and fracture until final failure.

Stress, EME, and AE variations during delayed impact failure of the sample 4#-1.
From Figure 4, when stress reached the limit of the testing machine (152.8 MPa) at 147.98 s, the sample did not destroy yet, while it was extrapolated that a large number of micro-fissures were internally generated causing a sudden drop of stress, obvious manifestations of AE, and the peak of EME amplitude. At low and stable stress stages, the overall EME amplitude maintained at a lower level, and AE energy began to increase due to convergence, connection, and coalescence of micro-fissures and macro-fracture formation. When the DR occurred at 208.2 s, EME amplitude significantly reduced, and while AE energy instantaneously reached the peak, indicating that compared to EME, AE/MS can be more effectively applied to warn rockburst danger due to the occurrence time of impact failure, which is generally at the stage of stress decreasing. 39 Particularly, the peak value of AE energy was only about 50 mV, which may be due to the micro-fissures at initial loading stage and lower stress level when the DR occurred, as well as the releasing form of strain energy.
Figure 5 shows the typical photograph of the residual rock fragments from the sample.

Photograph of small fragments ejected outward from the sample. Notes: (1) only few residual fragments left on the base of the testing machine and (2) the size of the fragments was approximate with the unit of mm.
From Figure 5, when the DR of the sample happened, a lot of debris fragments instantaneously ejected outward at high velocity, and only few residual fragments left on the base of the testing machine. It was demonstrated that the failure pattern of rock sample manifested explosive property and the accumulated elastic strain energy was mainly depleted by fragment ejection in the form of kinetic energy. Once impact failure occurred, EME amplitude reduced again, and while AE energy instantaneously reached a peak.
Figure 6 shows the relationship between uniaxial compressive strength (UCS), AE energy, and EME amplitude at the time of impact failure of rock samples.
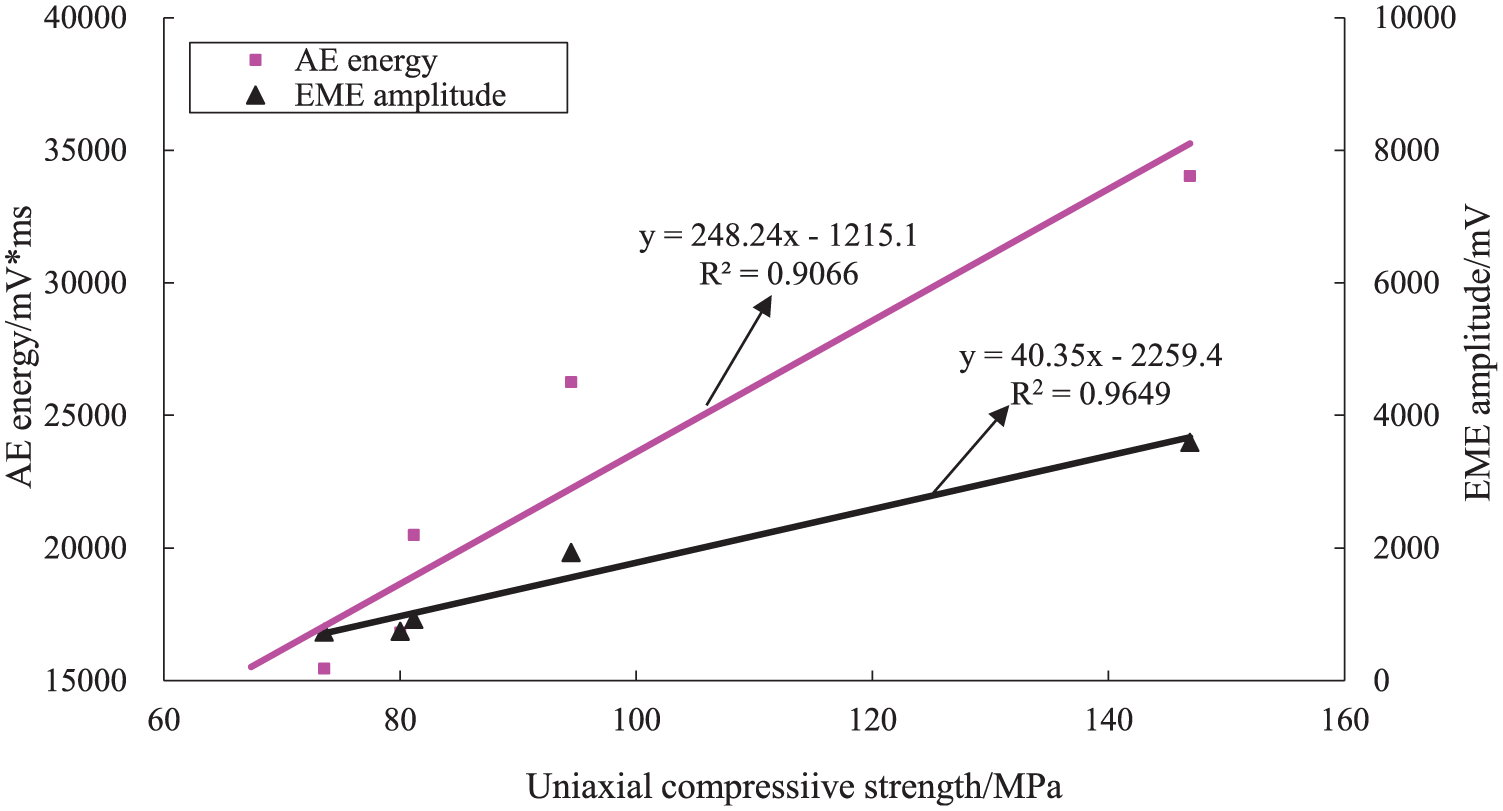
Relationship between UCS, AE energy, and EME amplitude at the time of impact failure of the samples.
Taking quantity limitation of testing samples into account, the distribution of UCS showed certain discreteness. By linear regression analysis, the positively linear relationship between UCS, AE energy, and EME amplitude was demonstrated at the point of impact failure. The harder the rock sample, the more the releasing strain energy prior to impact failure, and the stronger the AE and EME signals. Especially, a significant linear relationship between EME amplitude and UCS was revealed.
In summary, EME amplitude positively relates to the experienced load of hard rock sample, and AE energy positively relates to impact failure intensity. In most cases, only when stress suddenly decreases or final collapses of rock, AE parameter shows obviously abnormal, and it can be used as precursory sign of rock instability for early warning.
Field investigation
Field monitoring of hard roof fracture in a working face was conducted to verify the experimental results. The thickness of the roof is about 9 m, and the lithology is sandstone with the UCS of 170 MPa. The KZ-1 MS and KBD5 EME systems were used to record the signals nearby the working face. A roof fracture event was accurately located, and the corresponding monitoring data at this stage were analyzed in detail.
The duration, peak energy, and frequency-spectrum distributions of the roof fracture event recorded by two geophones are shown in Figure 7. The variation of waveforms, especially the high amplitude and duration of the MS events, can qualitatively reflect the characteristics of energy release. In Figure 7, the duration of fracture signal was very short with large amplitude, and the attenuation speed of the amplitude was very fast without obviously high values at the later stage, indicated that higher energy generated by hard roof fracture released instantaneously. In addition, the dominant frequency of roof fracturing was low accompanied by the congregation effect of low-frequency components, manifesting large-scale and high-intensity roof fracturing. MS event count and the maximum released energy at the stage before and during roof fracture were analyzed (the occurrence time of roof fracture was verified by the working resistance of hydraulic support, and the duration was 20 days), and the variation curves of MS event count and maximum released energy near the fracturing area are shown in Figure 8.

Waveforms and frequency-spectrum distributions of hard primary roof fracturing: (a) signal recorded by 1# geophone and (b) signal recorded by 2# geophone.

Variation curves of MS event count and maximum released energy near roof fracturing area. Note: the data of MS event count were derived from our previous work. 39
The variation of MS event count can indirectly reflect the number of fissures, and the maximum released energy can determine the scale of fissures. From Figure 8, the MS event count fluctuated stably until 10 days before fracture and then started to rise from 9 days before fracture, indicating that a larger number of micro-fissures initiated in primary roof. With initiation and propagation of micro-fissures, the event count gradually increased until 7 days before fracture and then gradually decreased until roof fracturing due to convergence and coalescence of micro-fissures. The maximum released energy fluctuated with lower values until 3 days before fracture, and an obvious higher value appeared on the third day before final failure. Therefore, it can be demonstrated that macro-fractures were formed prior to roof fracture. After that, MS event count, suddenly and sharply, increased and reached a peak, meanwhile the roof fracture occurred accompanied by the generation of a large number of new micro-fissures.
The EME at 35 and 50 m ahead of the cut before and during roof fracture were analyzed, to verify the EME characteristics, and the variation curves of EME amplitude and pulse are shown in Figure 9.

Variation curves of EME amplitude and pulse before and during roof fracture. Note: the data of subgraph (a) were derived from our previous work after filtering out interference: 39 (a) 35 m ahead of the cut and (b) 50 m ahead of the cut.
From Figure 9, the variation curves of EME amplitude and pulse at 35 and 50 m ahead of the cut were similar. EME amplitude and pulse basically maintained stable until 2 days before fracture, and the amplitude increased slightly during that day. However, the EME still was very small, indicating that the stress began to rise without micro-cracking. Prior to roof fracture, both the amplitude and pulse first increased, especially the former maintained higher level and then suddenly decreased, showing the stress of coal mass due to primary roof fracture. When roof fracture occurred, the amplitude suddenly decreased, and while the pulse increased sharply and maintained higher level. Then, the amplitude maintained stable followed by a slight increase with sudden drop of the pulse, which verified that primary roof has experienced an obvious fracturing process.
Discussion
Based on the experimental results, two forms of hard rock failures were uncovered as follows: (1) impact failure at peak stress and (2) DR under low and stable stress after peak stress. For the former, there is no obvious AE and the amplitude of EME gradually rises before impact failure, indicating that fewer micro-fissures generate in the samples and elastic strain energy continually accumulates. However, AE energy rapidly reaches the peak, and the stress and EME amplitude sharply decrease to low level when impact failure, indicating that a large number of micro-fissures initiate at the peak stress, resulted in abrupt and violent release of elastic strain energy. For DR of the sample 4#-1, the failure does not occur with the decreasing stress accompanied by formation of a large number of micro-fissures, and the AE and the peak of EME amplitude obviously manifest. After a delayed period, the sample suddenly destroys with the decrease in EME, and the AE energy instantaneously reaches the peak. Particularly, a lot of debris fragments eject outward at high velocity during impact failure of the sample, demonstrating that the accumulated elastic strain energy may release by the form of kinetic energy of fragments.
By in situ observations, the MS signals show very short duration with high amplitude, as well as low dominant frequency accompanied by the congregation effect of low-frequency components during hard roof fracturing, indicating that the higher energy generated by hard roof fracture releases instantaneously. Especially, it is verified that macro-fractures are formed prior to roof fracture based on the analysis of MS event count and maximum released energy. In addition, micro-fissures mainly initiate near the time of roof fracture according to EME variation.
In conclusion, the in situ observations are basically consistent with the experimental results on AE and EME mutation effect during fracturing of hard rock. In addition, the stress level, frequency of micro-cracks, and impact failure characteristics of hard rock can be revealed by EME and AE/MS, respectively.
Conclusion
The AE and EME mutation effect in the process of deformation and fracture until impact failure of hard rock samples was investigated in lab, and the in situ observations on MS and EME effects during primary roof fracturing were also conducted as verification of experimental findings. The in situ observations agreed satisfactorily with the experimental evidences. The conclusions are as follows:
Amplitude and pulse of EME correspond to stress level and micro-cracks frequency of hard rock, respectively, and the amplitude and pulse sharply decrease with impact failure of rock. In addition, AE/MS event count corresponds to micro-cracks frequency of hard rock, and the energy can reflect failure intensity. Only when stress suddenly decreases or final collapse of rock, AE shows obviously abnormal.
The more the hard rock, the larger the releasing strain energy prior to impact failure, and the stronger the AE and EME signals.
AE/MS event counts can directly reveal micro-cracks evolution in rocks. Before impact failure, the micro-cracks initiate, propagate, and coalesce to form macro-cracks, and AE/MS event counts show first increase and then decrease.
When the DR happens, AE energy instantaneously reaches a peak, while EME amplitude significantly reduces, indicating that AE/MS can be more effectively applied to warn rockburst danger compared to EME.
Footnotes
Handling Editor: Miguel Ardid
Declaration of conflicting interests
The author(s) declared no potential conflicts of interest with respect to the research, authorship, and/or publication of this article.
Funding
The author(s) disclosed receipt of the following financial support for the research, authorship, and/or publication of this article: We gratefully wish to acknowledge the collaborative funding support from the Fundamental Research Funds for the Central Universities (2017BSCXA19) and the Postgraduate Research & Practice Innovation Program of Jiangsu Province (KYCX17_1554).