
Abstract
Multi-sensor image fusion is always an important and opening problem, which can enhance visual quality and benefit some social security applications. In this article, we use contrast pyramid to decompose visible and infrared images, respectively, and the directional filter banks are applied to obtain multiple directional sub-band image features. Then, we compute the decomposition coefficients of visible and infrared images using a low-pass filter on the decomposed data; and finally, we introduce the whale optimization algorithm to search optimal coefficients to reconstruct the final fusion image. The experiments are conducted on multiple datasets with subjective and objective comparisons, in which the qualitative and quantitative analyses indicate the validity of the proposed method.
Introduction
Traditional imaging device can only capture a limited spectral emission or radiation of lights of the target scene, in which exist unpredictable objects or materials. Compound imaging and advanced signal processing are widely studied to enhance imaging capability and adjustability. Heterogeneous image fusion is a typical image-enhancing technique that combines at least two distinct source or sensor images into a single composite image. The fused image will be more informative, which may be deteriorated and limited by low signal-to-noise ratio condition. Hence, many applications are benefited from computational theory of multi-source image fusion, especially for the social security surveillance, network security monitoring, network video analysis, and military observation.1–3
According to the heat radiation emitted by the object, infrared rays can be used to detect hidden heat sources in complex environments. To capture the heat radiation of specific targets, the infrared image sensor is designed in such a way that it is only sensitive to light wavelength between 780 and 2000 nm, but at the cost to lose the information of visible light parts. On the contrary, visible images contain more rich texture of surrounding environment, which may also be important to effective target observation.4,5 In this article, we discuss the visible and infrared image fusion problem by contrast and directional features optimization (CDFO).
The image fusion can usually be divided into three levels: pixel level, feature level, and decision level. Traditional feature-level fusion method includes weight-averaging method, Bayesian estimation method, and cluster analysis method. 6 These methods combine the features extracted from multi-source information on different sensors (including shape, edge, region, contour, texture, and horn). The feature extraction and comprehensive analysis can be well processed even with number of different sensor images. However, the hierarchical information fusion at different resolutions is still an open problem. Decision-level fusion method 7 could find feature correspondence via classification and identification of each image, and then further fusion process will be carried out by global optimization. The non-uniform resolution problem cannot produce a good fusion result due to simple decision-level fusion with multi-resolution images. In recent years, pixel level–based fusion methods8,9 show more advantages on those cases with complex images. For example, Kannan and Perumal 10 proposed a pixel-level image fusion method based on discrete wavelet transform (DWT), in which an image can be decomposed into a sequence of different spatial resolution images. Then, the fusion process can be applied on different image scales. Li and Dong 11 and He et al. 12 presented a contrast pyramid (CP) fusion method. The original image is resolved into a series of decomposing layers with different resolution and frequencies. The fusion process is carried out separately on the components of each spatial frequency layer. In order to get better direction information, Jin et al.13,14 suggested fusing the satellite infrared image with visible image by introducing directional filter banks. This method can extract the directional sub-graph of infrared image, so that the directional information can be well preserved during the fusion process.
The signal processing by human visual system is performed on different channels of different scales, 15 so we introduced CP to pre-processing. Considering the direction information in full and the edge feature of high-frequency information, directional filter banks are used to get more direction features. First, the CP is used to decompose the image and adjust the contrast in different scales. The input multi-channel images are decomposed on different frequency bands, and the multi-resolution CP sequences form a pyramid-like structure. Each scale of CP corresponds to different spatial frequency characteristics. Second, we use directional filter banks to process the decomposition image on the basis of CP. Filter group provides an efficient analysis and synthesis of discrete signal structure. Specific structure of filter bank can obtain continuous multi-resolution base. Hence, we can obtain the abundant direction information and multi-scale information. During the fusion process, traditional methods determine the fusion coefficient weights according to the experience of human, but we cannot get a good fusion effect. Therefore, whale optimization algorithm (WOA) is introduced to search the optimal fusion coefficients adaptively. Compared to majority of the traditional methods, the proposed method based on CDFO provides an accurate image fusion result for getting the most significant features from the multiple sensor images. In this article, the overall technical route of image fusion based on CDFO is shown in Figure 1.

Overall technical route of CDFO image fusion.
Related work
Simple pixel-level fusion can be treated as a linear summation of pixels from the distinct source images, 16 as shown in equation (1)

where a1 + a2 + ⋯ + an = 1 represents the total contributions of different sources that should be normalized for the fusion image result g(x, y). The mechanism of pixel-level image fusion is shown in Figure 2. For two original images, pre-treatment is done first: inverted histogram matching and histogram equalization are performed; feature extraction and image registration are processed on it; next, fusion rule is applied to fuse image; finally, the corresponding coefficients are selected through the fusion rules to get the final fused image.

Pixel-level image fusion mechanism.
CP decomposition
In order to obtain multi-resolution-level image information, the original visible and infrared image should be pre-processed. The principles of CP decomposition are as follows.
Establishing Gaussian decomposition
CP is based on Gaussian pyramid. First, we use I(i, j) to represent the original image. Second, Gaussian pyramid17,18 is used to get the decomposition image Gl. Finally, interpolation method is used to enlarge the Gl, so that we can get the image
where 0 < l ≤ N, 0 < i ≤ u, and 0 < j ≤ v; and u and v are the number of rows and columns, respectively. In the l layer, w(m, n) is a window function and is actually a low-pass filter that satisfies the following constraints
Separability: w(m, n) = w(m)·w(n),
Normalization:
Symmetry: w(n) = w(−n)
The limitation of the above constraint is to ensure the low-pass property and the smoothness of the image after the image is reduced and expanded, and no seam effect occurs. Thus, we construct w(0) = 3/8, w(1) = w(−1) = 1/4, and w(2) = w(−2) = 1/16 and use the common window width of 5 × 5.
Building the CP
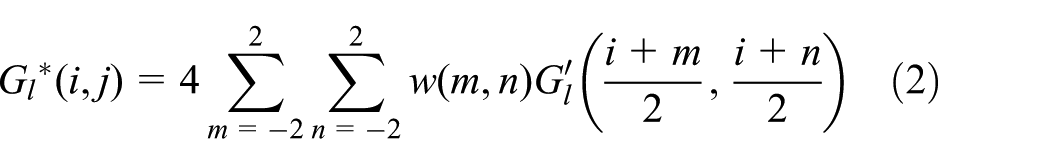
In equation (2), we can calculate
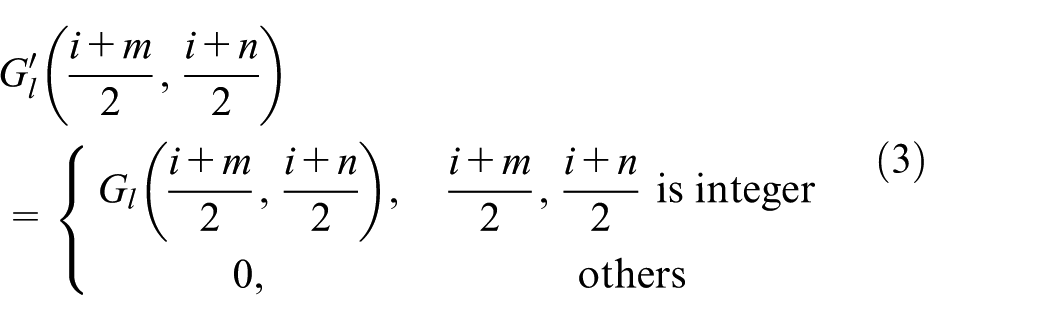
The window function has low-pass filter properties, thus

where Cl is the lth layer of CP decomposition; Gl is the lth layer of Gaussian decomposition; and Expand(Gl + 1) is the interpolation magnification of Gl + 1, and its size is same as Gl.
Rebuilding the original image from the CP
Transforming equation (4), we can get a reconstruction equation of CP
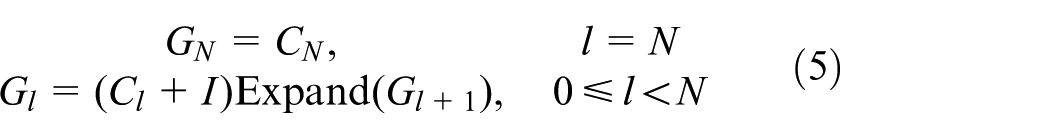
According to equation (5), we can iteratively start from the top layer, CN, of CP (CN, CN−1, …, C0) and make l = N, N−1, …, 0 at the same time. Each layer of the Gaussian pyramid can be obtained. Finally, the precise reconstruction of the original image, G0, can be recovered exactly by reversing the above steps.
Construction of directional features
Considering the multi-sensor image characteristics, we use directional filter banks19,20 to capture the directional features. The traditional directional filter banks lack multi-scale analysis capabilities, so in this article, we design a new directional filter bank to make it suitable for multi-sensor visible and infrared image.
It consists of two-channel diamond filter bank and parallelogram filter bank that cascade through the tree structure and through the L-level binary tree decomposition; the spectrum plane [−π, π) is decomposed into 2l sub-bands and the band is divided into wedges, where each wedge spectral sub-band extracts image information that is perpendicular to its direction, where l is the cascade series as shown in Figure 3.

Directional filter bank spectral segmentation: (a) spectrum division diagram and (b) decomposition part.
In Figure 3(b), Q1, D0, D1, D2, and D3 are the inseparable sampling matrices, as shown in equation (6)
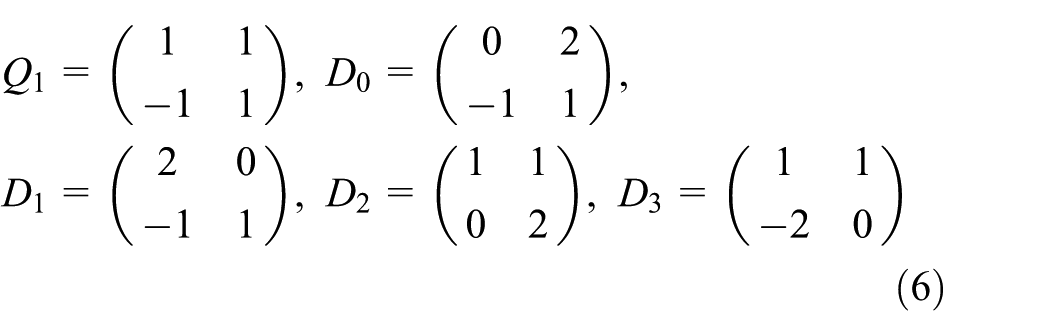
Figure 3(b) shows the three-stage cascaded decomposition of the directional filter bank (the reconstructed part is the inverse of the decomposed part). The wedge-shaped directional spectrum partitioning makes it suitable for extracting the edge contours with spatial localization in the image.
The WOA
Traditional fusion uses the maximum fusion rule or experience to determine the fusion coefficients, thus the fusion effect can be greatly deteriorated by unreasonable coefficient selection. In this article, we adopt a heuristic intelligent optimization algorithm to determine the optimal fusion coefficients.
Some brain regions of the whale are similar to the brain structure of human beings. 21 Prey is one of the most characteristic behaviors of the whale. By studying the hunting behaviors of whales’ group in the nature environment, researchers have proposed a meta-heuristic optimization algorithm which is called WOA. In 2015, Mirjalili and Lewis 22 proposed this method by simulating the hierarchy of the whale population and their hunting behaviors.
The proposed CDFO method
Contrast and directional features
The traditional CP decomposition has good physical meaning but ignores the direction information and affects the fusion effect. The directional filter bank adds direction based on the CP decomposition, which not only maintains the physical meaning of contrast but also detects the direction information well and can provide more feature information for the fused image.
In directional filter banks, we define a sampling of multi-dimensional space Zd in the grid, and the grid is expressed by a non-singular integer matrix M. The size of M is d×d. The equation of M is as follows

First, we give a proposition: LAT(A) = LAT(B), if and only if A = BE, among them, E is an unimodular integer matrix.
In this article, we use the decomposition of two-dimensional, two-channel ladder structure filter and quincunx sampling network. Two matrices are used to represent the quincunx sub-network

In directional filter banks, the following four basic unimodular matrices are used to achieve the invariance of rotation operation

here, we use Smith’s decomposition which can diagonalize any integer matrix M into a product form of UDV. In this form, U and V are the unimodular integer matrices and D is an integer diagonal matrix. 23 Thus, the quincunx matrix in equation (8) can be represented by Smith’s form as follows

where
In the first two layers of directional filter banks, quincunx filter banks (QFBs) will be used on each layer. Q0 is the sampling matrix on the first layer and Q1 on the second layer. From the third layer, the rest of the tree structure begins to extend. To obtain better frequency division, we use the QFB for resampling. The first half of the channel uses R0 and R1 resampling and gets a sub-band based on the direction of the basic level: +45° and 45°. The second half of the channel is resampled with R2 and R3 to produce the remaining sub-bands.
We can simplify the total sampling matrix of the QFB with the quincunx matrix of Smith’s form. We can calculate the sampling matrix using the following equation

According to the proposition presented above, we can get the following equation

The above equation shows the sampling network of QFB, which uses the R0 and R1 resampling and is equivalent to the down-sampling that is along the n0-dimensional space. Although CP with directional filter banks has some excellent features of multi-scale and multi-directional geometric analysis, for image fusion algorithms, the choice of fusion coefficients is also very important. WOA has attracted much more attention due to its excellent performance and powerful search capability.
Fusion coefficient optimization with the WOA
The traditional fusion coefficient is selected through human experience. In this article, WOA is introduced to optimize the adaptive fusion coefficient, so that the image contrast information and direction information can be maximally retained and the fusion effect is obviously improved.
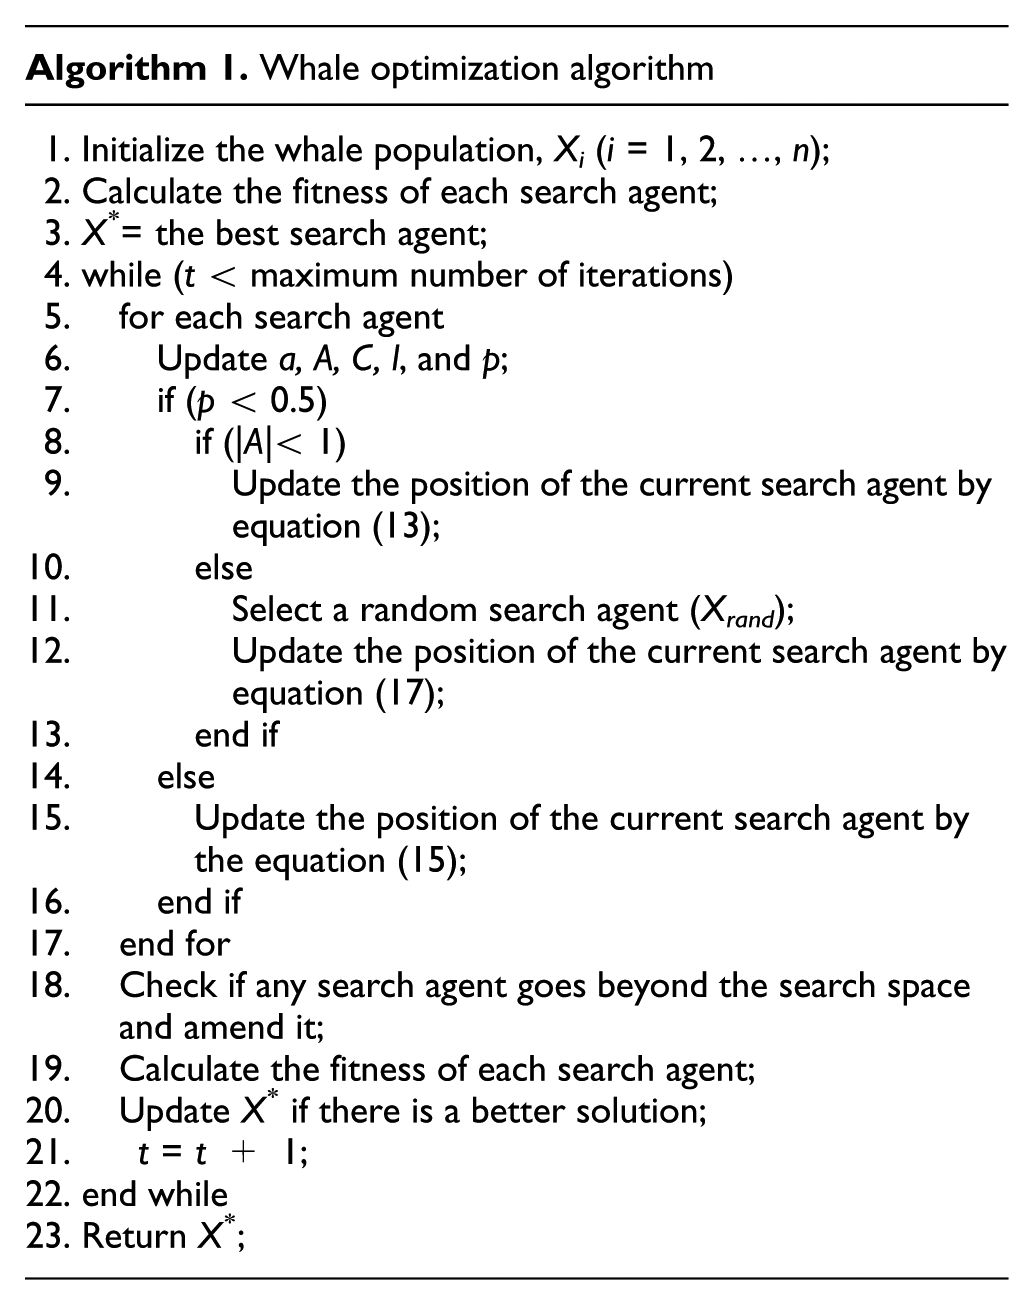
The WOA builds a global search mechanism by simulating the hunting behavior of whale, which can simulate the attacking mechanism of humpback whales (bubble-net hunting). The details of the WOA algorithm are described as follows.
Encircling prey
Before hunting, humpback whales identify the location of prey and then encircle their prey. In search space, the optimal position of the target prey is unknown at the beginning of time, thus WOA assumes that the current optimal solution is the target prey or close to the optimal position. When we ascertain the optimal search agent, other searches will update their own position based on this agent. Mirjalili and Lewis 22 described this behavior in a mathematical model as follows

where t indicates the current iteration,

here, the value of
The two-dimensional feedback behavior is shown in Figure 4. In Figure 4, X* is the best position we have got so far, and we can update the current position (X, Y) by (X*, Y*). The mathematical model to describe the hunting behavior of bubble-net is mentioned in equation (13).
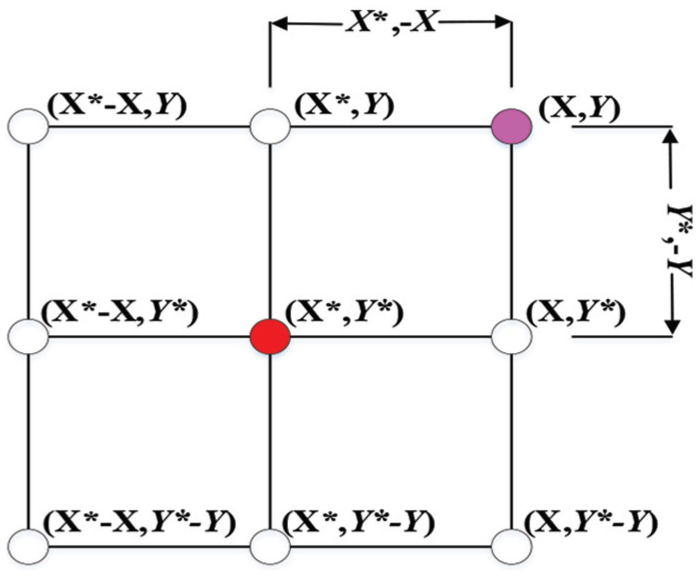
Predicted possible locations of position vectors in 2D space.
Bubble-net searching mechanism has two patterns: the first is shrinking encircling pattern and the second is spiral updating position.
Shrinking encircling pattern. Like a quadrangle, we updated the location of the optimal search agent by changing the value of
Spiral updating position. In this mathematical model, we use a spiral equation to calculate the distance between whale (X, Y) and prey (X*, Y*) as follows

where

Shrinking encircling mechanism.
In the process of optimization, we assume that if p < 0.5, we use the mechanism of shrinking encircling pattern; and if p ≥ 0.5, the spiral updating position is applied. The mathematical model is as follows

where p is a random number in the interval [0, 1]. Figure 6 shows the spiral structure clearly.

Mechanism of bubble-net searching with spiral pattern.
Search for prey (exploration phase)
Unlike the exploitation phase, the search agent updates its location according to the random selection during the exploration phase, thus the random value of

where pi, p = {p1, p2, …, pn}, is a random position vector chosen from the current population.
On the whole, WOA algorithm is a global optimization, because it has the capabilities of exploration and exploitation. Pseudo code of WOA is given as follows.
To generalize the proposed algorithm, our fusion can be summarized by the following steps:
Initialize parameters. We adopt window function, w, to decompose, and the decomposition level is set as 3. The “Phoong, Kim, Vaidyanathan and Ansari” directional filter banks of the trapezoidal structure are used, and the maximum decomposition layer is 4.
Decompose CP on each original image separately and obtain the decomposition images M1 and M2 with the size of 1/23 of the original image.
Use the directional filter banks built according to section “Fusion coefficient optimization with the WOA,” and decompose M1 and M2 to get the filtering images
Take the filtering images
In each final obtained image, add information D1 and D2 carried by directions into separate decomposition results y1 and y2 as the row vectors.
Conduct the low-pass filtering of decomposition results y1 and y2 separately and obtain two groups of decomposition coefficients C1 and C2.
Use the WOA proposed in this article to optimize the coefficients C1 and C2 to obtain the new fusion coefficient C.
Consider C as the input coefficient of directional filter banks for reconstitution to obtain reconstitution result y.
Conduct contrast reconstruction and obtain the final fusion result Y.
Computational complexity analysis
The computational complexity of the algorithm in this article consists of two parts: the computational complexity of the algorithm in section “Contrast and directional features” and that of the algorithm in section “Fusion coefficient optimization with the WOA.”
In section “Contrast and directional features,” CP decomposes the original images first before entering the directional filter bank. After down-sampling and filtering, the amount of data is reduced greatly, thereby improving the efficiency. Suppose the size of both images to be fused is N×N, and the number of levels to be CP decomposed is l, then after down-sampling and filtering, the size of images is (N/2 l ) × (N/2 l ). Hence, the size of the images to enter the directional filter bank is (N/2 l ) × (N/2 l ). The element number contained in two groups of coefficients, C1 and C2, can be calculated by formula (18)

where N is the size of the images to be fused, l is the number of levels to be CP decomposed, and M is the element number contained in two groups of coefficients, “C1” and “C2.” The complexity of comparison operation for finding the maximal absolute value is O(M), that is,
In the optimization of the fusion coefficient in section “Fusion coefficient optimization with the WOA,” if the maximum number of iterations is k and the size of the whale population is N, then the time complexity of the optimization coefficient of the WOA optimization algorithm is
As a whole, the computational complexity of the algorithm in this article is
Experiment and analysis
Numerical indexes
At present, there is no unified standard to evaluate the fusion effect for all kinds of images. In this article, we adopt some evaluation metrics presented in relevant references to evaluate the fusion results objectively, such as information entropy (IE), average grads, standard deviation, and spatial frequency. For example, the IE of the image reflects the amount of information of the image, where the larger the value, the more information the image contains. The average gradient (AG) of the image reflects the ability of the image to express contrast to the tiny details. The standard deviation (SD) of the image is a measure of the degree of dispersion of the pixel values of the image compared to the pixel average, which is the contrast information of the image, where the larger the value, the greater the contrast of the image. The spatial frequency (SF) effectively reflects the details of the image, where the larger the value, the clearer the image. The edge strength (ES) value of the image is an evaluation index that describes the visually important edge intensity information and direction information of the fusion result. The execution time (ET) reflects the efficiency of different fusion methods.
Experimental analysis
In order to verify the advantages of the proposed algorithm, we choose several fusion algorithms to compare, such as fast filtering image fusion (FFIF) method, 24 CP-based fusion method,11,12 DWT-based fusion method, 10 and principal component analysis (PCA)-based fusion method. 25 As shown in Figure 7, the first dataset represents a section (256 × 256 pixels) of visible and infrared images without smoke shielding acquired by a Sony Camcorder and a long-wave infrared (LWIR) sensor. The second group of visible and infrared images is near the street signs and a man in the doorway. The third group of images (256 × 256 pixels) is crossroads at night. The fourth group of images (256 × 256 pixels) is three soldiers and a jeep, and the last group of images (256 × 256 pixels) is two men in front of a house. The fusion results are shown in Figure 8.

Five pairs of visible and infrared images: (a) building images without smoke shielding, (b) man in the doorway, (c) crossroads at night, (d) soldiers with jeep, and (e) two men in front of a house.

Fusion results by different methods: (a) FFIF-based, (b) CP-based, (c) DWT-based, (d) PCA-based, and (e) CDFO-based.
In the experiments, fusion performance is evaluated by qualitative analysis and objective indicator (as shown in Tables 1–5). Qualitative analysis is adopted by the visual effect and spectral fidelity, including spatial resolution, clarity, and sophisticated details, which indicate the extent of preserving original spectral signal or characteristics.
Numerical results of the first line of Figure 8.

IE: information entropy; AG: average gradient; SD: standard deviation; SF: spatial frequency; ES: edge strength; ET: execution time; IR: original infrared image; FFIF: fast filtering image fusion; CP: contrast pyramid; DWT: discrete wavelet transform; PCA: principal component analysis; CDFO: contrast and directional features optimization; VS: original visible image.
Significant of bold values represents the optimal numerical value gained from different fusion methods using the corresponding evaluation index.
Numerical results of the second line of Figure 8.

IE: information entropy; AG: average gradient; SD: standard deviation; SF: spatial frequency; ES: edge strength; ET: execution time; IR: original infrared image; FFIF: fast filtering image fusion; CP: contrast pyramid; DWT: discrete wavelet transform; PCA: principal component analysis; CDFO: contrast and directional features optimization; VS: original visible image.
Significant of bold values represents the optimal numerical value gained from different fusion methods using the corresponding evaluation index.
Numerical results of the third line of Figure 8.
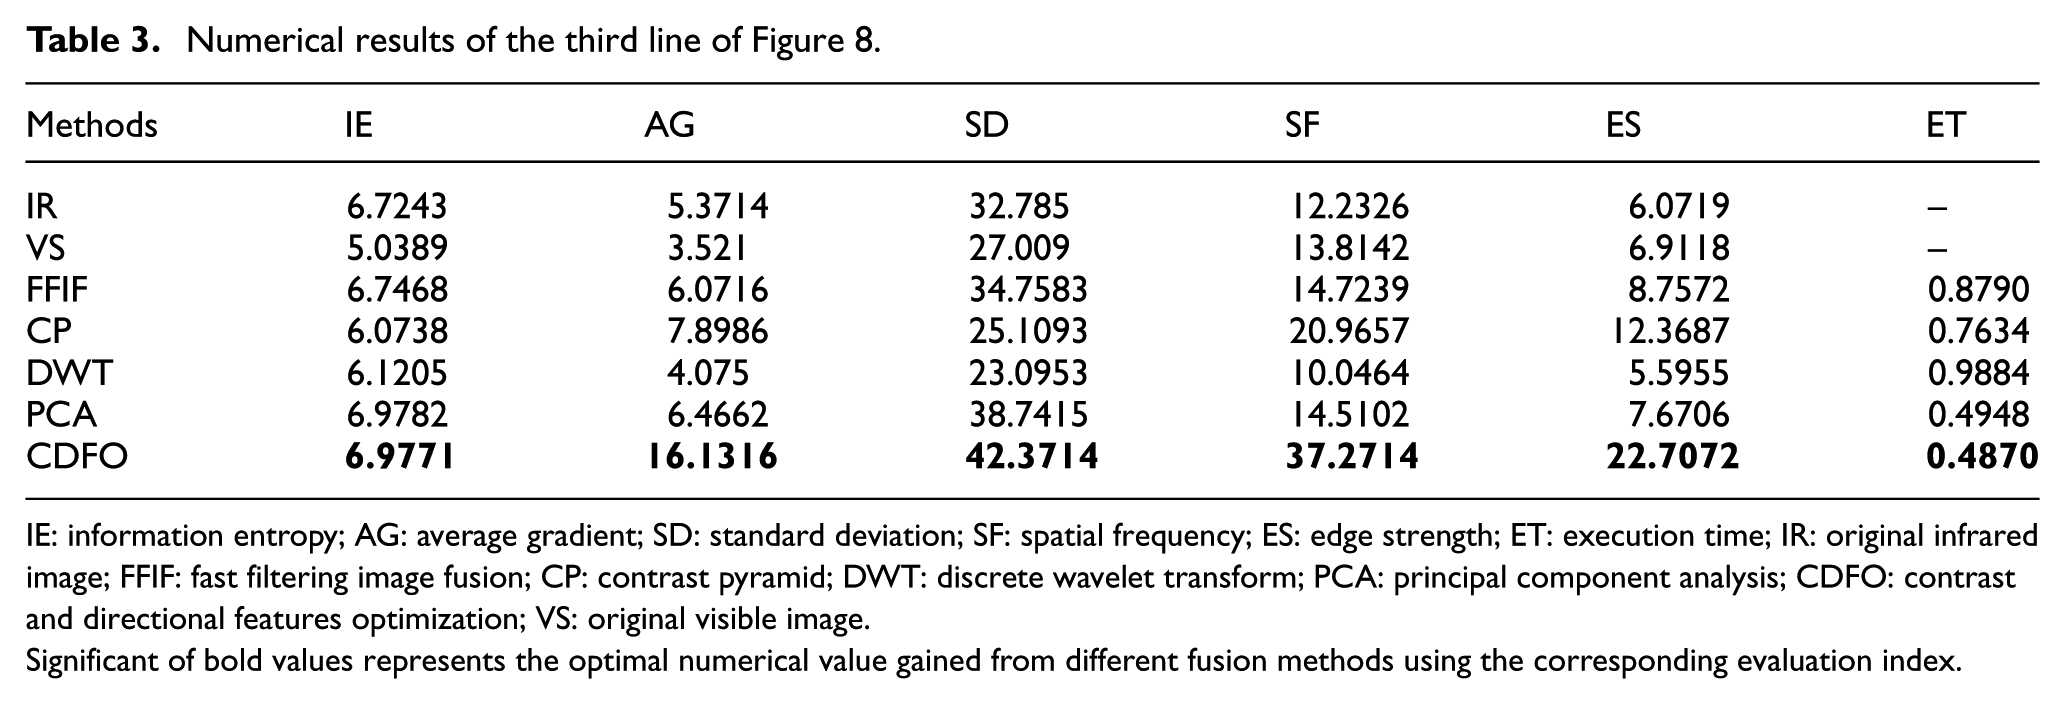
IE: information entropy; AG: average gradient; SD: standard deviation; SF: spatial frequency; ES: edge strength; ET: execution time; IR: original infrared image; FFIF: fast filtering image fusion; CP: contrast pyramid; DWT: discrete wavelet transform; PCA: principal component analysis; CDFO: contrast and directional features optimization; VS: original visible image.
Significant of bold values represents the optimal numerical value gained from different fusion methods using the corresponding evaluation index.
Numerical results of the fourth line of Figure 8.
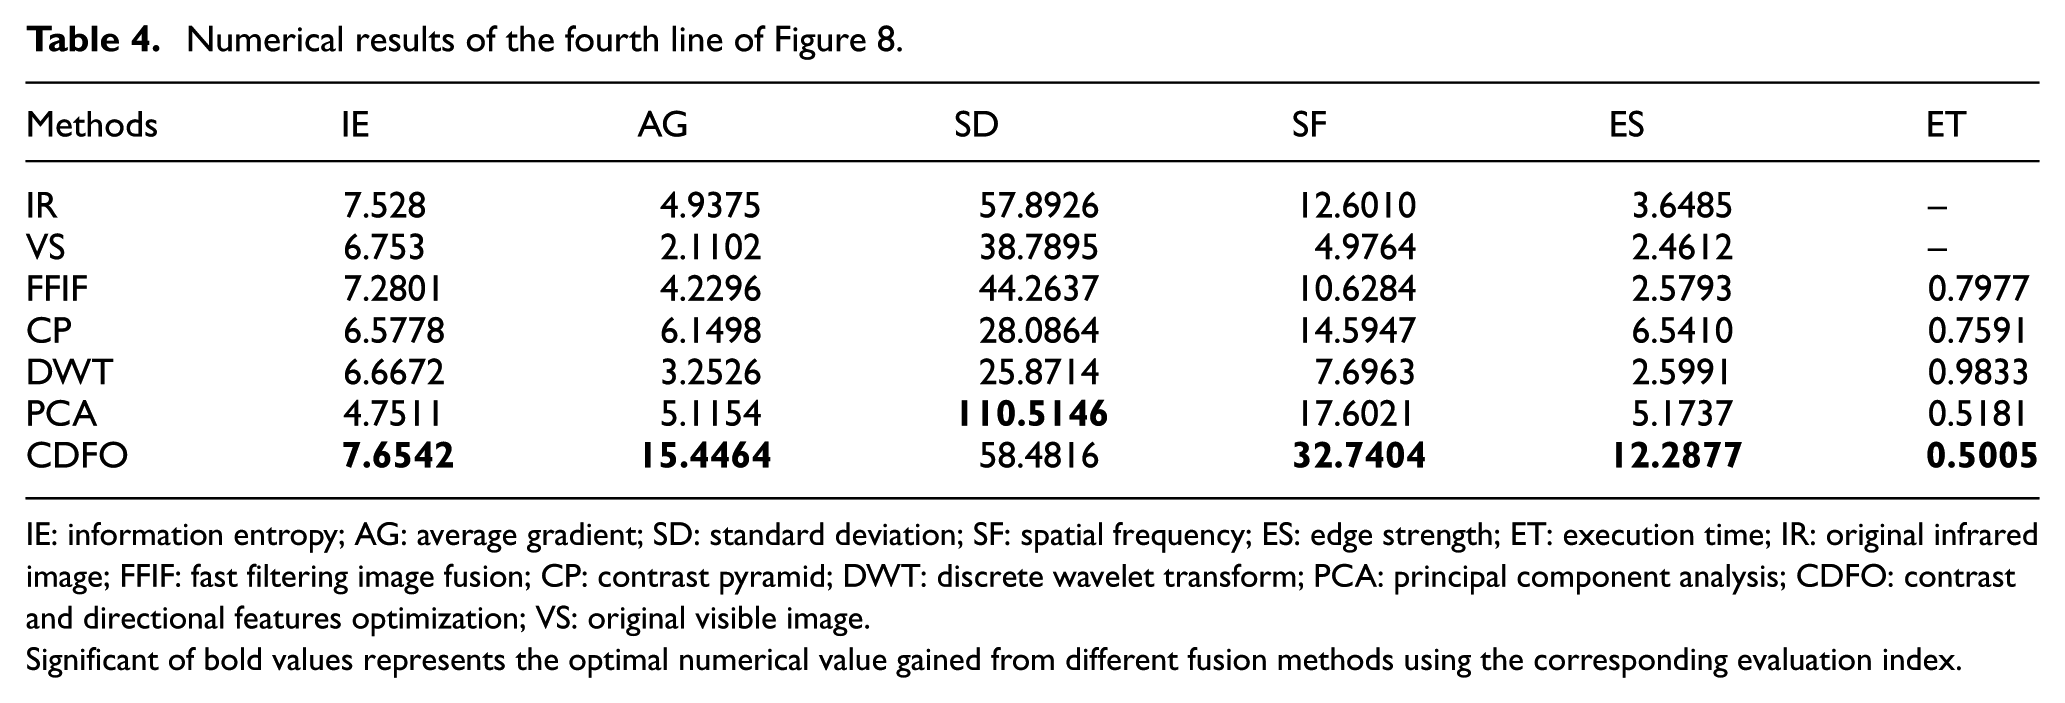
IE: information entropy; AG: average gradient; SD: standard deviation; SF: spatial frequency; ES: edge strength; ET: execution time; IR: original infrared image; FFIF: fast filtering image fusion; CP: contrast pyramid; DWT: discrete wavelet transform; PCA: principal component analysis; CDFO: contrast and directional features optimization; VS: original visible image.
Significant of bold values represents the optimal numerical value gained from different fusion methods using the corresponding evaluation index.
Numerical results of the fifth line of Figure 8.

IE: information entropy; AG: average gradient; SD: standard deviation; SF: spatial frequency; ES: edge strength; ET: execution time; IR: original infrared image; FFIF: fast filtering image fusion; CP: contrast pyramid; DWT: discrete wavelet transform; PCA: principal component analysis; CDFO: contrast and directional features optimization; VS: original visible image.
Significant of bold values represents the optimal numerical value gained from different fusion methods using the corresponding evaluation index.
From the visual effects (Figure 8), the overall profile of the FFIF fusion result is very rough and the saturation is distorted, especially in the second group of experiments; CP-based fusion results have higher contrast, but the edge contour is not clear enough; DWT-based fusion results lack spectral characteristics, and the sharpness is not enough; PCA-based fusion images have excessive brightness, rough edge contours, loss of a large amount of detail information, and severe distortion of saturation; the proposed CDFO method has better fusion results than the previous four groups of experiments. Rich-structure features and clear-edge contours can better highlight the target area of interest.
By the numerical results (Tables 1–5), the evaluation indexes of the proposed CDFO method are mainly the highest, which indicate that the fusion images have the highest sharpness and the most abundant details. However, in terms of the SD indicators, the SD values of the CP-based fusion results in the second, fourth, and fifth groups are higher. The reason is that the contrast of the fusion results based on the CP is too large, and its visual effect is particularly poor. Also, the time cost of the CDFO method is almost lower, which is very important in practical applications.
The convergence curve of the fusion coefficient optimization of the WOA in five different groups of images is shown in Figure 9. The second and third groups of images tend to converge when iterated 4 times, and the fusion result no longer changes. The first and fifth sets of images also reached a steady state when iterated 6 times, and the fourth set of images also converge when the number of iterations reached 8. Therefore, the figure shows that the image fusion method based on WOA for coefficient optimization has a fast convergence speed and good convergence stability, which can effectively save the optimization time of the fusion coefficient.

Convergence curves of CDFO method applied in five different sets of images.
In summary, the above five sets of simulation experiments have proved that both on the subjective vision and the quantitative numerical indicators, also taking into account the time cost, the proposed CDFO method has obvious advantages.
Conclusion
In this article, a CDFO image fusion algorithm is proposed to take advantages of both infrared images and visible images, which can better reconstruct the target scene using CDFO. The method can preserve more structural features and color spectrum information. At the same time, considering the high-frequency information with different scales, we construct directional filter banks to capture directional features. Finally, the WOA is applied to optimize the fusion coefficient. The proposed method has great advantages in both image quality and quantity. By testing on real visible and infrared image datasets, the proposed algorithm can preserve more scene details and information, which is more valuable for video monitoring and security surveillance in low visible environment.
Footnotes
Acknowledgements
H.J. and Z.X. contributed to conceptualization, methodology, and writing review and editing; M.Z. and Y.L. contributed to software, validation, formal analysis, and writing of original draft preparation; and H.J. contributed to supervision, project administration, and funding acquisition.
Handling Editor: Shancang Li
Declaration of conflicting interests
The author(s) declared no potential conflicts of interest with respect to the research, authorship, and/or publication of this article.
Funding
The author(s) disclosed receipt of the following financial support for the research, authorship, and/or publication of this article: This research was supported in part by the National Natural Science Foundation of China under grant no. 61472204.