
Abstract
With the development of indoor localization technology, the location-based services such as product advertising recommendation in the shopping mall attract widespread attention, as precise user location significantly improves the efficiency of advertising push and brings broader profits. However, most of the Wi-Fi-based indoor localization approaches requiring professionals to deploy expensive beacon devices and intensively collect fingerprints in each location grid, which severely limits its extensive promotion. We introduce a zero-cost indoor localization algorithm utilizing crowdsourcing fingerprints to obtain the shop recognition where the user is located. Naturally utilizing the Wi-Fi, GPS, and time-stamp fingerprints collected from the smartphone when user paid as the crowdsourcing fingerprint, we avoid the requirement for indoor map and get rid of both devices cost and manual signal collecting process. Moreover, a shop-level hierarchical indoor localization framework is proposed, and high robustness features based on Wi-Fi sequences variation pattern in the same shop analysis are designed to avoid the received signal strength fluctuations. Besides, we also pay more attention to mine the popularity properties of shops and explore GPS features to improve localization accuracy in the Wi-Fi absence situation effectively. Massive experiments indicate that SP-Loc achieves more than 93% localization accuracy.
Keywords
Introduction
With the development of mobile indoor localization technology, location-based services (LBSs) in the shopping malls have attracted widespread attention, particularly the shop-level indoor localization in the shopping mall has become a new research hotspot, since shop-level localization algorithm has a significant impact on the product advertising recommendation. For instance, when the consumer is walking into a restaurant, his smartphone automatically requests the indoor localization service to identify the specific restaurant in the shopping mall and then the restaurant owner is able to push new coupons directly. Similarly, as people step into a clothing store with precise shop recognition result, the merchant of the corresponding store may recommend the latest style clothes to them instead of the recommendation from nearby shops. Hence, the shop-level indoor localization algorithm leads to the more direct interactions and personalized recommendation services to users while providing more profit margins for businesses.
Among the available indoor localization approaches, the localization method drawing support from Wi-Fi fingerprints has become the mainstream technology due to the ubiquitous and widespread device deployment and relatively high localization accuracy. The Wi-Fi fingerprint-based indoor localization approaches are roughly summarized as two stages: generating offline fingerprint database stage and the real-time positioning stage. In the offline stage, the deployer collects scanned received signal strength indication (RSSI) in the environment repeatedly for every area in the room. Then, further generate the feature vector of the collected signal as Wi-Fi fingerprinting to establish a fingerprint database; during the real-time positioning phase, users scan current Wi-Fi signal in the environment to match the feature vectors with the fingerprint database built in advance, so as to find the location of the highest similarity Wi-Fi fingerprint corresponding to the location of the user. This approach achieves meter-level localization accuracy; however, since the auxiliary devices’ expense cost and labor-intensive deployment process,1–3 the promotion of Wi-Fi-based indoor localization approach is severely limited. Specifically, to collect Wi-Fi signals in every location grids of the indoor environment, it is essential to obtain the indoor floor plan in advance, resulting in an additional drawing effort for maps and potential localization errors from the unfaithful drawn maps. Moreover, in the construction phase of the fingerprint database, the Access Point (AP)-related equipment must be deployed by the professional staff, and the Wi-Fi signals are collected repeatedly in every location grid for lower measuring error, which leads to intensive manual labor and additional expensive devices expense with maintenance cost.
In order to alleviate the problems existing in the Wi-Fi-based indoor localization approach, the heuristic crowdsourcing fingerprinting collecting process naturally relieves the burden of device deployment cost and repeated fingerprint collection. Along with the popularization of mobile payment technology, we naturally utilize the indoor Wi-Fi signals, GPS coordinates and time-stamps that smartphones collected when user pay in the shop, which effectively avoids the cost of deploying AP device and manual labor. Moreover, we also pay attention to analyze the Wi-Fi APs’ variation patterns user scanned in the same shop and design robust features to reveal the relationship between AP sequences and the shop. Meanwhile, GPS coordinates are utilized to construct features to compensate for the localization accuracy in no Wi-Fi signal scenes. Last but not least, the indoor localization performance is further improved by exploiting the shop popularity features.
Note that shop-level localization problem is different from room-level localization problem, since a shop in the shopping mall may contain multiple rooms, and many shops may lie in the same room. Moreover, we are committed to determining the shop where the user is located and thoroughly combining the semantic properties of the shop to maximize the predicted location confidence, instead of considering the adjacent relationship of the physical location space.
The main contributions of our work are summarized as follows:
We introduce a novel, shop-level indoor localization algorithm based on crowdsourcing fingerprints without the indoor map. Utilizing the naturally collected Wi-Fi list with received signal strength (RSS) and opportunistic GPS coordinates that are when users pay in the shop, we achieve a zero-cost location estimation without the need for both auxiliary device deployment cost and labor-intensive fingerprint collection burden.
We propose a hierarchical, shop-level indoor localization algorithm architecture. The top-layer dynamically screens out a few candidate shops where users might be located. Moreover, the rule-based candidate expansion strategies are designed flexibly to extend the set of candidate shops. The bottom-layer refined classification process further distinguishes candidate shops.
We find that the indoor localization accuracy can be significantly improved by shop popularity semantic features, including shop popularity evaluation based on AP fingerprint ratio in various shops, shop payment time distribution, and shop competitiveness features to improve localization accuracy. Moreover, we pay more attention to the variation pattern of APs and GPS coordinates aggregation characteristics in the shops to design novel features to obtain better localization performance.
Related work
Nearly for two decades, Wi-Fi-based indoor localization approach has become the core method to gain outstanding performance. In the early study, RADAR 4 system based on the radio-frequency to collect and process the signal strength in indoor areas, combined with the empirical measurement and signal propagation model, achieved high positioning accuracy at that time. Later, the method based on location fingerprinting matures. 5 This approach consists of two key steps: building the location fingerprint database and real-time localization stage. In the offline phase, the RSSI of each area in the indoor environment needs to be collected to construct a custom signal vector as a fingerprint database for Wi-Fi fingerprinting. Moreover, in the real-time localization phase, the similarity between the collected RSSI signal and the fingerprint of offline fingerprint database is matched, and the location with the most similar signal vector is given as the location estimation of the current user. However, this enlightening method achieves higher accuracy with apparent deficiencies, 6 which is chiefly reflected in the manual labor burden to obtain fingerprints. Besides, the RSSI required proper calibration while localization accuracy is sensitive to the device heterogeneousness.
For overcoming the equipment deployment cost and signal acquisition burden during the offline fingerprint database building phase, C Wu et al. 7 attempts to build radio floor plan instead of signal signatures collection on the spot. They rely on RSSI signal abruption phenomenon when penetrating wall between rooms to distinguish locations, and in conjunction with the acceleration sensor to record the user motions to do auxiliary localization.
To calibrate the fluctuation of RSSI signals, researchers conducted intense exploration of the RSSI characteristics. H Liu et al. 8 found the reason for the vast range error in the Wi-Fi localization is radio signatures resemble in a far distance case. So, they make use of peer-phone and acoustic-assisted localization method to alleviate the problem. Q Chen et al. 9 proposed a rule-based Wi-Fi location method, which uses a more stable RRSS (relative received signal strength) instead of the traditional RSS and proposes a method based on static rules and dynamic rules for localization.
To obtain effective Wi-Fi fingerprints, S Eisa et al. 10 and Y Wu and Z Li 11 proposed AP or fingerprinting filtering methods, which simplifies positioning radio maps by classification rules or clustering methods to keep valid fingerprints. S He et al. 12 researched on how to update fingerprints automatically and designed Localization with Altered APs and Fingerprint Updating (LAAFU) system, which divides the RSS vector into multiple subsets and checks its dispersibility to identify changed APs efficiently.
With the development of intelligent mobile terminals, crowdsourcing-based approach brings about a novel idea for effectively preventing labor-intensive signal collecting. J Niu et al. 13 perceive crowdsourcing Wi-Fi signals and user actions simultaneously, accurately identify fingerprints of users at the corresponding locations, and employ weighted KNN (K-nearest neighbors) algorithms to assign APs with different weights for room-level localization. Moreover, the multi-dimensional scaling (MDS) algorithm is designed to calculate the coordinates of the corridor and the room and utilize the anchor points to match the corresponding map points for calibration. S Yang et al. 14 introduced an indoor localization algorithm based on crowdsourcing fingerprinting without calibration. It extracts fingerprinting values from short-term RSS feeds while maintains a single fingerprint for each sample point without the requirement for calibration stage on various devices.
In addition to the above deterministic methods, researchers figured out the probabilistic-based approach and the machine-learning-based approach could achieve excellent performance on this task. T Roos 15 considered the location estimation as a machine learning problem. A model of the signal strength distribution in different geographic regions is established based on the signal acquisition of several locations, and a probabilistic framework for location estimation is proposed. V Honkairta et al. 16 compared the localization performance of deterministic, probabilistic, Bayesian, and Kalman filter-based methods, and the best localization performance was obtained using the probabilistic approach of kernel approximation.
R Yasmine et al.17,18 proposed an indoor localization algorithm based on dynamic fingerprinting and support vector machine to cope with the RSSI fluctuation in the environment and cluster the most relevant reference points to estimate location. E Jedari et al. 19 used the professional equipment module to collect the Wi-Fi signal and trained the KNN and Random Forest (RF) models to obtain higher accuracy. They also studied the influence of the choice of k, the definition of distance and the number of trees on localization accuracy. However, the above proposed method still requires a professional device module for data acquisition. Y Jiang et al. 20 carried out zone-based clustering to automatically identify hotspots in the room by corresponding Wi-Fi signature, simultaneously distinguishes rooms depend on action clustering result.
Other researchers insist on improving localization performance via optimized features. Y Kim et al. 21 proved that the feature selection operations and feature quantity have a significant impact on the practical system, then proposed a feature selection method based on RSSI invariance and RSSI strength to optimize the selection of features. D Li et al. 22 combined conventional KNN algorithm with RSS scaling feature to achieve the localization accuracy of 1.7 m.
In the recent study, researchers attempt to locate user utilizing deep learning and compressive sensing approach. M Nowicki and J Wietryzykowski. 23 classify floors by training deep neural networks based on collected Wi-Fi signal strength. Experiments indicate autoencoder could effectively reduce feature space to receive robust floor classification with higher accuracy than the KNN algorithm. However, no further study has been carried out on the RSSI padding of unsearched APs. In virtue of compressive sensing, C Feng et al. 24 recover sparse signals from tiny noisy measurements by solving an l1-minimization problem which leads to a substantial improvement.
Different from the previous work, this article introduces a novel, shop-level indoor localization algorithm with no additional cost, which leads to outstanding location estimate through the natural collection of crowdsourcing fingerprints without detail floor plan.
Algorithm design
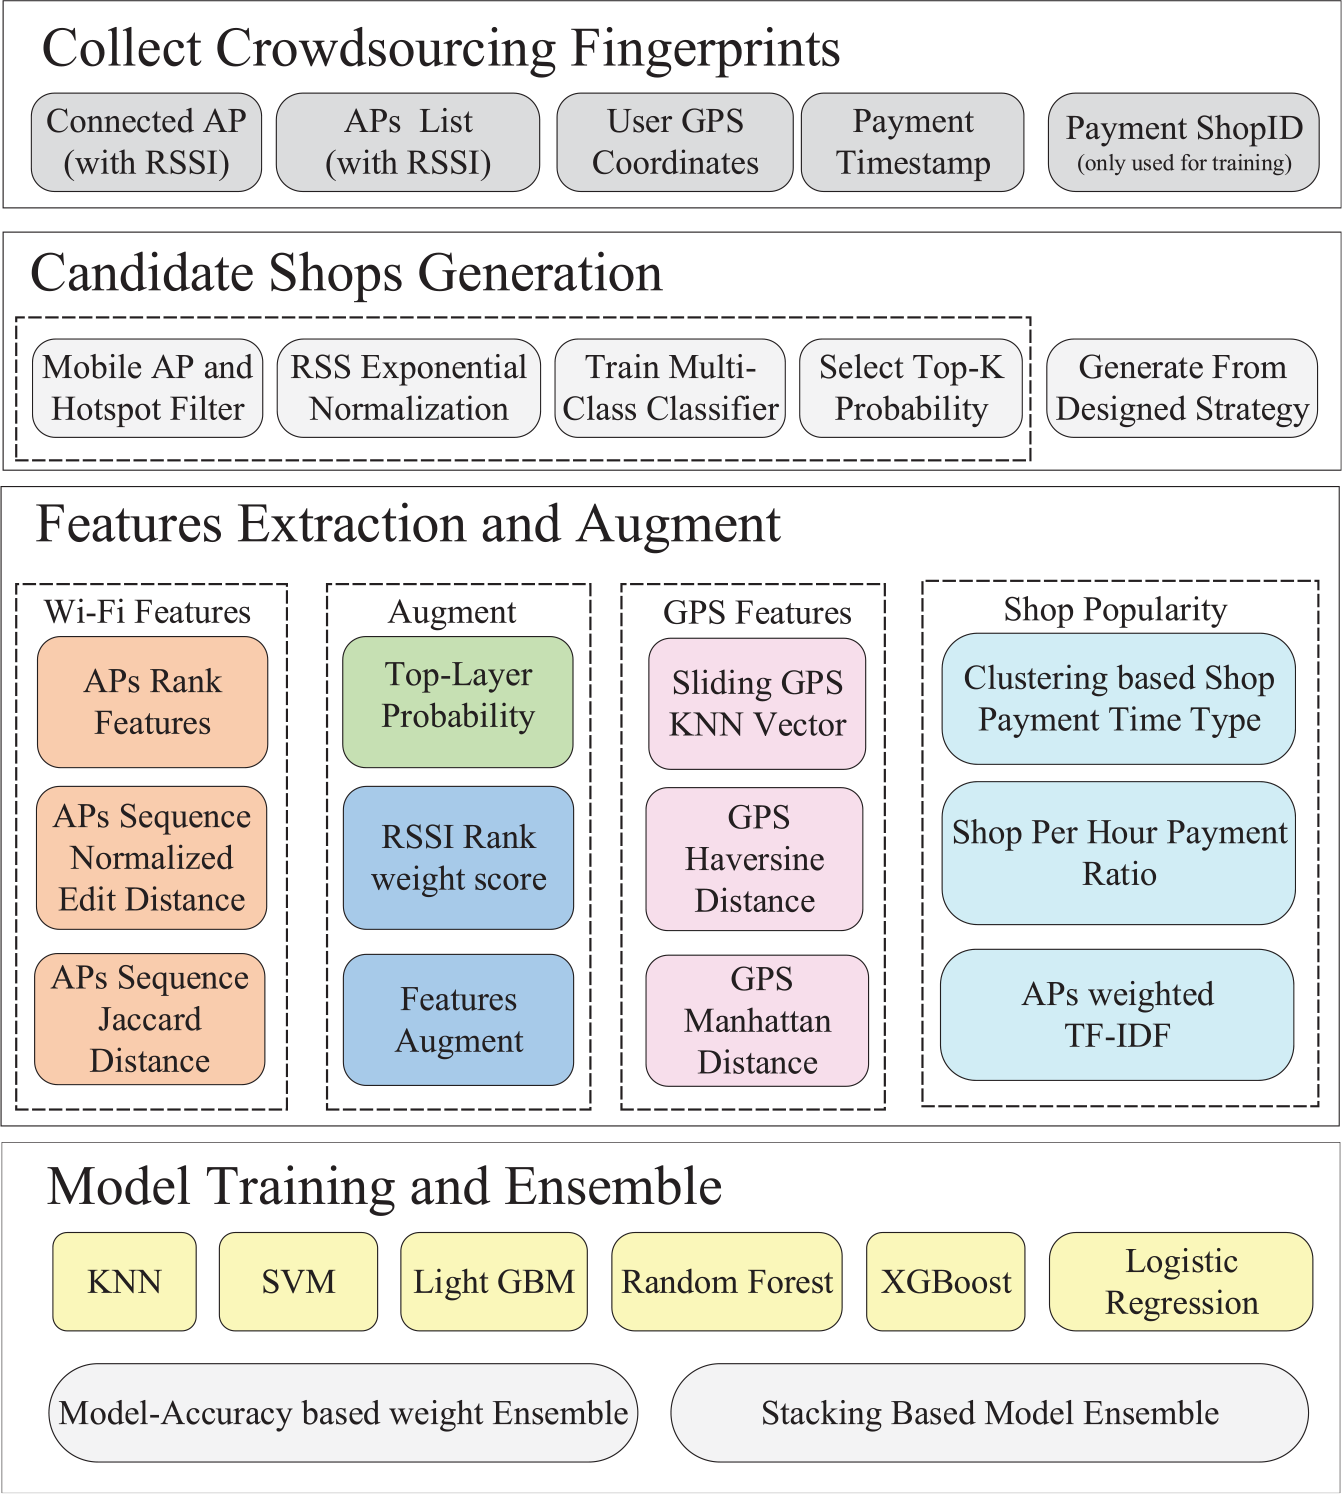
Hierarchical localization architecture
We propose a two-layer, shop-level hierarchical indoor localization architecture; mathematically, the hierarchical localization models the following probabilities

In the above formula, x denotes the shop localization, o denotes the observations from multiple sensors (Wi-Fi and GPS), and c denotes the shop belongs to a specific shop candidates set.
Based on the above theory, we divide the shop location estimation task into two stages: the top-layer candidate shop generation process and the bottom-layer refined classification process.
The top-layer candidate shop generation stage models the
The bottom-layer refined classification process models the
Algorithm architecture.
Candidate shop generated by the top-layer classifier
In the top-layer, SP-Loc selects 20–30 shops where the user is most likely located for reducing the global calculation cost and excluding the interference from geographically distant shops.
In specific, all shops in the shopping mall are considered as labels to train multi-classification model, and APs in the same shopping mall employed One-Hot encoding with RSS as features vector. Thus, during the top-layer, we obtain trained models for every single shopping mall. It is worth noting that the exponential function with base 1.035 normalizes the RSS, and the unscanned APs carry out zero padding. In the real-time localization phase, SP-Loc utilize trained model for the corresponding shopping mall to dynamically provide prediction probability for every shop and regard the 10–15 shops with the highest probability as the candidate shops where the user might be located.
Candidate shop generated by rule-based strategy
The candidate shops based on the top-layer classifier may not be adequate to contain the shop where the users are located, accordingly SP-Loc further extends the shops set to ensure ground truth shop is included in candidate shop set. Since the deployment of most APs in the mall is fixed, and those APs in the shops often have previous RSSI ranking in the list of APs scanned by the users who are located in corresponding shops. Taking users’ repetitive payment behavior in the same shop into consideration, we devised rule-based candidate shop set generation strategy as an impactful supplement to establish candidate shops. In detail, as long as one of the following conditions is satisfied, a shop is incorporated into candidate shops where the user might be located:
Select three scanned APs with strongest RSSI, and add three shops where selected APs were collected the most into the candidate group;
Select three scanned APs with strongest RSSI, and add three shops where selected APs were collected with maximum historical RSSI into the candidate group;
Select the currently connected AP, and add the shop where selected AP was connected the most into the candidate group;
Refer to the payment took place GPS coordinates location, and add the three shops closest to the location;
Add the shops where the user had ever paid in the mall into the candidate group.
The bottom-layer refined classifier
After screening the candidate shops where the user may be located, SP-Loc regards the shop-level indoor localization task as a supervised binary classification problem. In other words, we consider the differences in the signal feature spaces of different shops, including original statistical features from sensors and semantic statistical features belonging to the shop, and eventually predict the unique shop where the user is located rather than taking the precise physics location connection into account. Thus, we extracted features from diverse perspectives including Wi-Fi (AP list with RSS), GPS coordinates, and shop popularity features from collected fingerprints. Mathematically, the bottom-layer refined classifier further models the conditional probability of the ground truth shop location as follows

Specifically, for all given candidate shops, the shop where user truly located in is marked as 1 while the rest shops in the candidate set are marked as 0. In such a way, we convert the shop-level indoor localization task into a binary classification problem. In contrast to RSS-based feature, we pay more attention to analyze the variation patterns of AP sequences to build highly robust features without localization errors from RSS fluctuations. Besides, we try to employ the aggregation characteristic of GPS coordinates of the same shop to design effective features to distinguish shops. Moreover, SP-Loc also focuses on the semantic properties of shops popularity, including the popularity evaluation of shops, the time distribution of shop transaction, and the competitiveness of shops to improve the localization accuracy.
Mobile AP and hotspot filter
As massive mobile APs and hotspots are scanned in the shopping malls, it is essential to avoid the interference of AP noise on the localization algorithm. We preliminarily screen out the long-term stable APs in the shopping mall. In this regard, we filter the invalid AP through the minimum number of collected days, the minimum collected frequency, and the minimum collected user threshold, and utilize the chi-square statistics for auxiliary screening. In detail, we believe an AP as a stable AP only if it is satisfied with all of the following conditions:
The number of times the stable AP has been collected in the mall is not less than 10 times within 30 days;
The number of days the stable AP has been collected in the mall is not less than 2 days within 30 days;
For all APs in the shopping mall, computing corresponding chi-square statistics and sorting in descending order, the AP ranks in the former 90%;
The maximum RSSI of the stable AP in the mall is greater or equal to −90 dBm within 30 days;
The stable AP is scanned by at least three users in the mall within 30 days.
Wi-Fi features extraction
AP rank features
Due to the instability of the Wi-Fi signal, the RSS collected by the smartphone fluctuates over time. Meanwhile, the RSS is also disturbed by the flow of people and the occlusion of the object in the large-scale shopping mall. In addition, the Wi-Fi fingerprints collected by different users in a crowdsourcing way are severely affected by device heterogeneousness.
To avoid the above-mentioned influence of the Wi-Fi signal on the localization algorithm, SP-Loc does not directly use the RSS value to construction AP feature, but uses the RSS ranking of the AP to design the feature. Since the ranking-related AP feature has strong stability and robustness that naturally avoids the influence of RSS fluctuations and the heterogeneity between various hardware devices. When building AP ranking-related features group, we particularly define the AP sequence as follows: the sequence of APs scanned by the user in the shop sorted by the corresponding RSS value from the largest to the smallest. Thus, the four kinds of AP rank features in AP sequences are extracted for measuring the ranking statistics in specific sequence positions and obtaining robust features. The four categories of AP ranking-related features are defined in Table 1, and here, a basic service set identifier (bssid) uniquely identifies an AP.
Wi-Fi features.

RSSI: received signal strength indication.
Jaccard distance between AP sequences
SP-Loc models the similarity between the AP sequences collected by the current user and historical AP sequences in the shop. AP sequence is also defined as the AP sequence scanned by the user ranked according to the RSSI value from the largest to the smallest.
SP-Loc refers to the Jaccard distance to reflect the difference between the two collected Wi-Fi AP sequences. Mathematically,

In the definition of

In the above formula,
Normalized edit distance between AP sequences
Since the Jaccard distance is based on the original definition of Jaccard similarity, and the Jaccard similarity measures the consistency between sequences by calculating the ratio of the number of APs co-occurring in two AP sequences to the number of APs in the two sequences. The obvious drawback is that this similarity definition is unable to reflect the partial changes about the exchange of positions of APs in the AP sequence.
Fortunately, the editing distance makes up for the inadequacy of Jaccard distance and portrays the changes in the elements due to the exchange of ranking positions. Given two sequences a and b, the edit distance (a.k.a. Levenshtein distance) calculates the minimum number of steps required to convert sequence a to string sequence b, and the atom edit operation contains the insertion, deletion, or replacement for only one element. The edit distance can be calculated by the dynamic programming algorithm with O(mn) time complexity as follows

In the above formula,
In order to demonstrate the advantages compared to Jaccard distance, the normalization operation squashes the edit distance to [0,1] range. Hence, the

We deeply analyzed and compared the patterns of variation in the AP sequences collected by users in the same shop. Specifically, the variation phenomenon of AP sequences in the same shop is summarized into two common patterns: position swaps and local closure (or addition). The first pattern is caused by the object occlusion or RSS fluctuations, thus adjacent AP positions in the sequence are exchanged. The position swaps variation pattern as shown in Figure 2.

One variation pattern of AP sequences: position swaps.
The normalized edit distance feature is extremely sensitive to the sequence change caused by the exchange of positions in the AP sequence, but the Jaccard distance feature does not have this capability. We compared the two distances of the first AP sequence and the last three sequences. The results are shown in Table 2.
Comparison of Jaccard and edit distance.

As shown in Table 2, Jaccard distance does not help with the position swap pattern, and the normalized edit distance provides a valid measurement for position swap in AP sequence in such situation.
Local closure (or addition) is another more common pattern of AP sequence variation in the same shop. Specifically, the AP sequence increases (or decreases) one or several APs over time. The reason for this variation pattern is that the AP might be in the state of opening or being closed at different time periods. Simultaneously, it is still possible that the AP position swap with the fluctuation of RSS. In addition to the above situation, the ranking of the remaining AP sequence remains stable, and the minimum number of steps of changes from the normalized edit distance calculation effectively captures the sequence invariance in such cases. Intuitively, the pattern of local closure (or addition) changes as shown in Figure 3.

Variation pattern of AP sequences: local closure (or addition).
We compared the distance between the normalized edit distance features and the Jaccard distance features between the first and the last three AP sequences. The results are shown in Table 3.
Comparison of Jaccard and edit distance.

As shown in Table 3, the Jaccard distance and the normalized edit distance give distance metrics between AP sequences from different perspectives in the situation of local closure (or addition). Experiments show that both types of features are effective for the AP variation pattern modeling.
AP feature augment operations in the candidate group
Based on dynamically generated shop candidate set, all of the AP features extracted from various shops are independent of each other, so we try to carry out feature augment operations within the candidate shop, the AP rank-related numeric features (denotes as

In the above formula,
The top-layer prediction probability features
Since the features of the top-layer classifier and the bottom-layer classifier are independent of each other, the prediction probability for total candidate shops generated by the top-layer classifier is regarded as vital features for different candidate shops to supplement to the bottom-layer features set as shown in Figure 4. Simultaneously, employing probability feature from top-layer is equivalent to stacking the top and the bottom classifiers to receive a superior localization performance.

The top-layer prediction probability features are utilized in the bottom-layer classification process to improve localization accuracy further.
RSSI ranking weight features
To mitigate the effects of RSSI fluctuation over time and alleviate the influences of device heterogeneity on features, we take full advantage of the real-time scanned RSSI ranking characteristic of AP to seek more high robustness features. Hence, adaptive weights are assigned to AP-related features based on responding RSSI ranking, where APs with higher RSSI rankings receive correspondingly greater attention. Specifically, RSSI ranking weighted features are constructed according to the following formula

In the above formula,
GPS features design
GPS coordinates aggregation effect in the shops
GPS-based outdoor location technology has been widely promoted, while it is hardly applied to indoor localization due to the low signal power and signals are frequently blocked by the wall, which cannot fully satisfy the indoor localization requirements. However, in virtue of the visualization of crowdsourcing GPS latitude and longitude from users in the shopping mall, the user coordinates belonging to same are aggregated or clustered in near the shop as shown in Figure 5. Inspired by the aggregation effect of GPS coordinates of the same shop, we design various feature to determine the user location estimation.

Crowdsourcing GPS coordinates demonstration. It can be seen that the GPS coordinates of a shop surrounded by drawn artificial red outline are aggregated.
It is worth noting that the offline GPS coordinates of some shops and the GPS coordinates collected by users in the shopping mall are far away from each other, which can be attributed to the heterogeneity of indoor structures; the GPS coordinates collected demonstrate a particular spatial distribution; and for the GPS signal is blocked by the wall structure, the coordinates collected might be concentrated near the walls. In this sense, the GPS coordinates are gathered on one side of the wall or near a specific area of the wall.
Hence, to make better use of the characteristic that vast majority of users’ payment locations are aggregated or clustered, we further compared the GPS coordinates of shops and the median latitude and longitude of users from responding shop as shown in Figure 6.
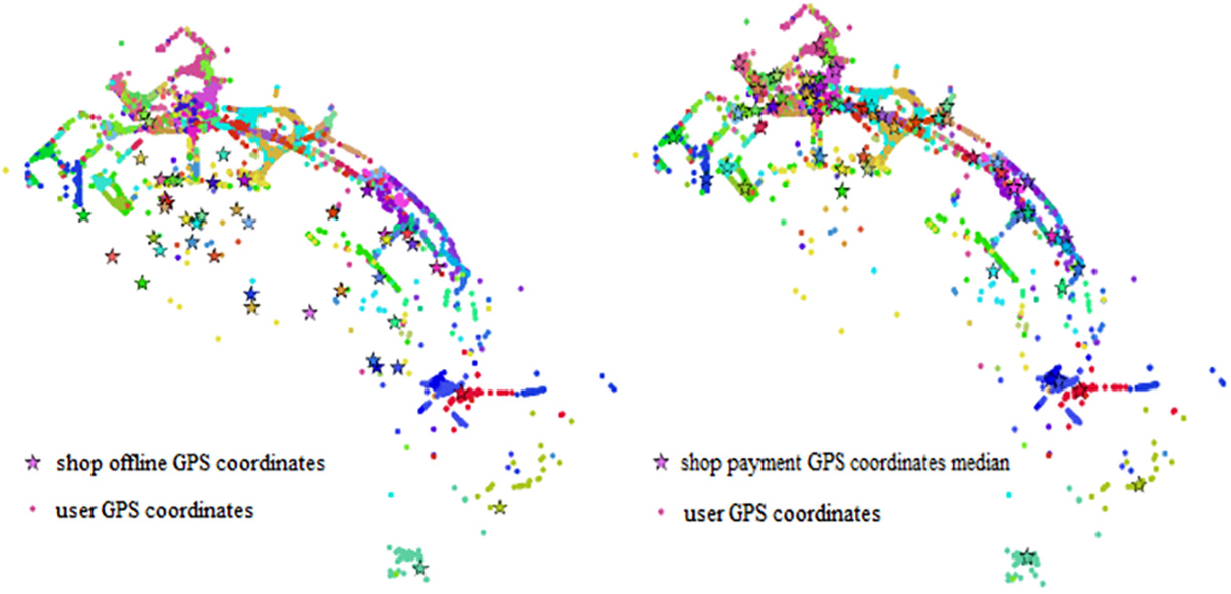
Comparison of offline shop GPS coordinates and the median GPS coordinates collected by users. It is demonstrated that median coordinates are able to catch the shop location information precisely.
As shown in Figure 6, we consider the median latitude and longitude of the users’ GPS coordinate fingerprint of the shop as a more reasonable statistical location estimation of corresponding shops. Hence, by the statistical location of shops defined by historical median GPS coordinates, haversine distance feature is chosen to calculate the distance between user current coordinates and shop statistical coordinates as the following formula

In the above formula,

Moreover, GPS signal belongs to a kind of opportunistic signal in indoor space, since it is impossible to obtain or collected GPS signal is abnormally far away from the real location in some cases. So, under these circumstances, we adopt a relative larger constant number instead of the unavailable or unreasonable distance feature (such as the maximum GPS haversine distance between the user and the shop in the training sample), and Wi-Fi-related statistical feature or the shop popularity plays a vital role in the localization process.
K value sliding nearest neighbors vector
In virtue to the property of aggregated user GPS coordinates of the same store, novel K value sliding nearest neighbors vector is designed combined with the KNN algorithm. Applying KNN to indoor localization, this algorithm calculates K most similar fingerprints to assign the shop with the highest proportion in the K-nearest shops as the final localization estimation. Essentially, the KNN algorithm is equivalent to leveraging a “hard” rule (i.e. the shop with the most occurrences) to determine the shop where the user is located and possesses the insensitivity to distant locations naturally.
Inspired by GPS aggregation property and KNN algorithm, our designed feature focuses on a generic improvement utilizing GPS fingerprints. Instead of directly using the most frequently collected shops as the final location estimate, SP-Loc novelly adopts multiple K values and calculates the shop fingerprints proportions in responding K-nearest samples rather than a deterministic shop to establish sliding GPS coordinates feature vector. Simultaneously, such ratio vector effectively avoids the problem of K value selection in the traditional KNN algorithm, and the multi-dimensional vector feature is also equivalent to specifying a “soft” rule to indicate the possibility that users are located in different shops.
It is worth noting that partial mobile operating systems have no access to obtain all Wi-Fi signals due to privacy restrictions. In this case, the K value sliding nearest neighbors vector feature brings about a significant improvement on localization performance. In Figure 7, we intuitively demonstrate the advantage of the sliding GPS KNN vector features based on simulate historical GPS coordinates of shops near the intersection location.

Simulated K-sliding GPS KNN vector features naturally extract the “soft” distance of statistical feature space from different shops.
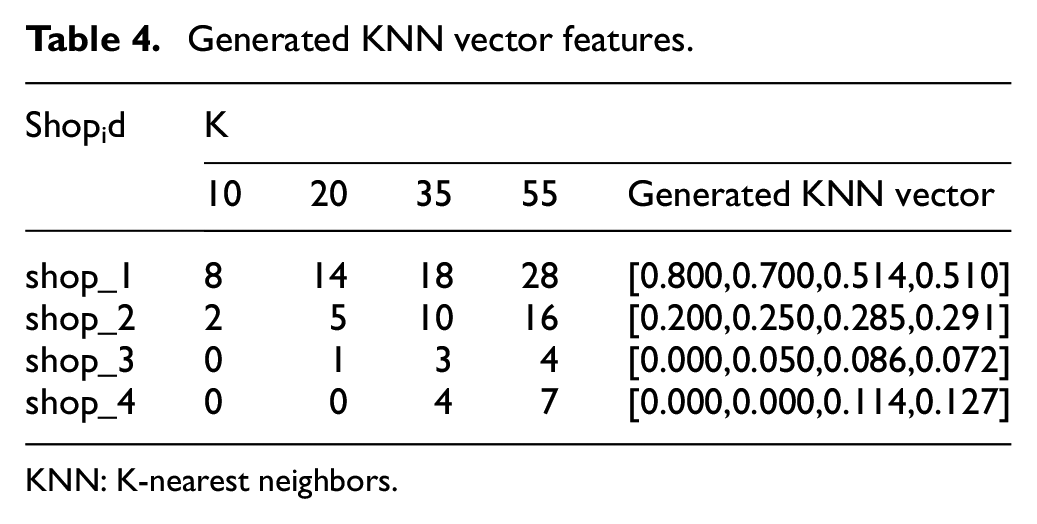
Based on Figure 7, we generate the GPS KNN vector as shown in Table 4.
Generated KNN vector features.
KNN: K-nearest neighbors.
As shown in Table 4, the generated GPS KNN vector effectively reflects the likelihood of users being located in four shops with multiple dimensions. During the experimental section, we heuristically choose K ∈ {15,25,35,45,55,65,75,85} to generate feature vectors for bottom-layer classification process.
Shop popularity features extraction
Weighted term frequency–inverse document frequency-based shop popularity
The popularity of shops naturally portrays the possibility that users are located in different shops, thus shops with higher popularity mean that users stay at responding shops more frequently, resulting in the more frequent acquisition of partial AP fingerprint near the shop. Therefore, the frequency or the proportion of collected Wi-Fi fingerprints in different shops naturally reflects the popularity of shops and the possibility of users staying at that location by statistical meaning.
To characterize the popularity of shops, we used Wi-Fi fingerprints to design shop popularity features based on term frequency–inverse document frequency (TF-IDF). TF-IDF is a statistical index for evaluating the importance of words in documents in the field of information retrieval, where the term frequency is applied to measure the frequency of the words in the document. Also, the inverse document frequency is used to reflect the uniqueness of words in all documents.
Migrating TF-IDF to shop localization scenario, we consider the spliced APs list from all of the collected fingerprints in the shop as a document belonging to the corresponding shop, and regard an individual AP as a word, thus generating a document for each shop in the mall. Therefore, the TF-IDF of APs is able to measure the proportion of the AP collected in different shops and evaluate the uniqueness of AP in various shops, which naturally depicts the popularity of shops.
Moreover, in addition to using the number of times the AP is collected in the shop, the connection proportion of the AP in the same shop is calculated as a weight factor multiplying by TF-IDF. Mathematically

In this formula,
Shop payment time distribution
By analyzing the occurrence time of payment behavior of the different categories of shops, it is clear that specific type of shops presents a discriminative payment time distribution as shown in Figure 8. For example, the payment times of a large number of restaurants are concentrated at about 12 a.m. and 6 p.m.; however, the payment times of partial clothing stores are more evenly distributed on an hourly basis during the whole day; in contrast to the above shops, the payment times of several shops keep a distinct higher deal percentage in the afternoon than in the morning.
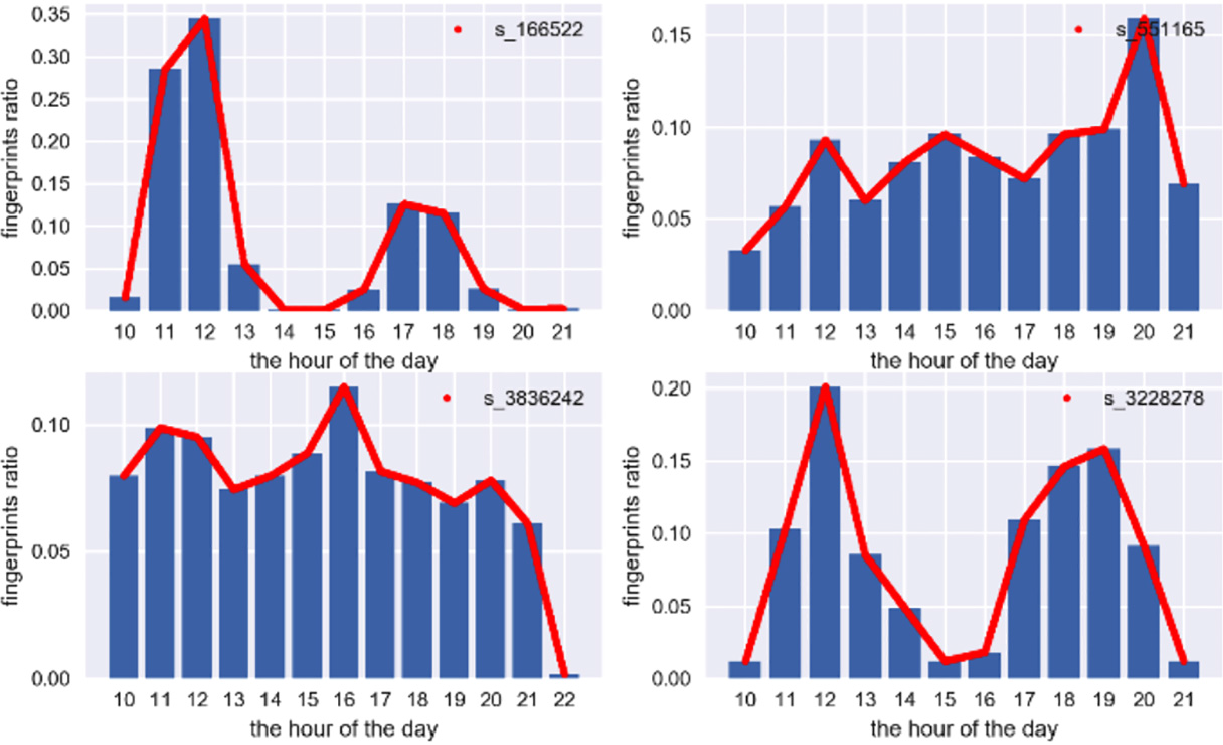
Fingerprint ratio of different shops within hours.
Drawing support from the payment time of shops to construct available features, the localization process is distinguished from another essential perspective. Thus, the percentage of transactions within hours in the shop is calculated as a helpful feature to characterize the likelihood of the user being located in responding shop at the corresponding time

In the above formula,
In addition, we further define 30 min as a unit period to count the fingerprint ratios collected by each shop to construct feature vector and then employ K means algorithm to unsupervised cluster the time vectors of all shops in the same mall. The selection of the K value still uses the sliding-window method, taking K = 5, 10, and 15, respectively. Thus, the cluster tag obtained by the clustering process is considered as a feature of the shop.
The competitiveness of shops
Statistical data proved the apparent trading volume disparity between various shops in the same type in the shopping mall. Based on the characteristics of the scale differences of payment amount in various shops, payment proportion of shops belonging to the same category in the shopping mall is extracted to describe the property of competitiveness of shops

In the above formula,
Models ensemble
Model confidence–based predictions ensemble
The ensemble method of voting by different classifiers gives a coarse-grained result fusion. However, different models predict the probability value of the candidate shops effectively and give the confidence of the model in forecasting the shop where the user is located. Therefore, different models are used to predict the confidence level of the candidate shops, and weighted rankings are performed using the corresponding model precision. The first ranked result is obtained as the fused position estimate. Experiments show that the proposed method integrates different classifications in a granular manner; the forecast estimates to obtain better localization results.
Stacking-based model ensemble
Stacking is a useful model ensembling technique used to combine information from multiple predictive models to generate a new model (Figure 9). In general, the stacked model (also called second-level model) outperforms each of the individual models due to its smooth nature and ability to highlight each base model where it performs best and discredit each base model where it performs poorly. During our ensemble process, nonlinear models including RF, XGBoost (XGB), 25 and LigthGBM 26 are used to train the first-level model to generate the second-layer train set. To differentiate the two-layer model, the second-level linear model (logistic regression) is employed to output the final prediction. The experimental result shows that the stacking ensembling technique is able to acquire the—stacking process also brings about extra training model time complexity.

Stacking-based ensemble.
Experimental result with analysis
Data set statement and split protocol
The experimental data set adopts the 2017 CCF Shop Localization Competition preliminary data set 27 and the training set contains 1,138,015 records. The fingerprints collect periods during 1 August 2017 to 31 August 2017, covering 97 shopping malls, 8477 shops, 714,608 users, 67 different store types, and 399,679 APs. It is worth noting that the crowdsourcing fingerprints collected by all the shops in the training data set are independent of each other, and the crowdsourcing fingerprints collected by the users belong to the unique shop.
For the performance on the validation set approximates to the test set, we split the data set in strict accordance with the date order and assign the time interval before the training set as the feature extraction interval. During this approach, we could avoid the false appearance of inaccurate offline accuracy caused by applying future data through the cross-validation model evaluation. The detail visualization for the splitting method based on natural dates is shown in Figure 10.

Data set split.
Refined classifier performance evaluation
Due to the different scales of crowdsourcing fingerprints collected by different shops and the unbalanced category of training samples, we use area under a curve (AUC) to evaluate the performance of the classifiers.
As shown in Figure 11, the AUC generated by the LightGBM (LGB) model uses all the features. The area under ROC curve reaches 0.91; besides, the AUC of 0.86 is obtained when the importance of the top 25 features is used.
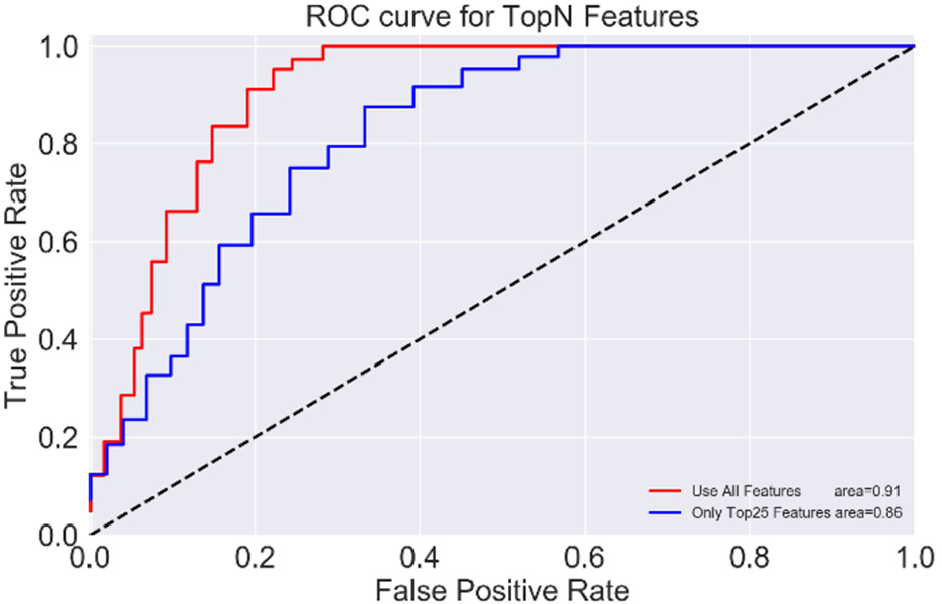
The ROC curve for classifier evaluation.
The accuracy evaluation from different features
The localization accuracy is compared under different situations including only Wi-Fi features, only GPS features, only GPS with sliding KNN features, and all of them via five machine learning models including KNN, support vector machine (SVM), RF, XGB, and LGB. The comparison results are shown in Table 5.
Localization accuracy evaluation of SP-Loc.

KNN: K-nearest neighbors; SVM: support vector machine.
The significance of bold values represents the highest score in each row.
The core information we read from Table 5 are as follows:
Shop popularity features bring more than 1% accuracy improvement in all five different models, which proves that making full use of the shop’s attributes can further enhance the performance of localization;
The localization accuracy of combined feature involve Wi-Fi & GPS & Shop Popularity and trained by the tree-based ensemble model (RF, XGB, and LGB) reaches 0.9, which exceeds the model accuracy of KNN and SVM than 3%;
The accuracy of only use GPS features is less than 0.65, and it is difficult to meet the requirement of indoor location; however, with the sliding-window KNN features we designed, the maximum accuracy can reach 0.78, so the accuracy of some mobile terminals which have no access to obtain Wi-Fi signal could be raised by more than 10%;
LGB achieves the highest accuracy of 0.9181 and obtains three highest localization accuracy using different features, which leads to a remarkable indoor localization performance.
Candidate shop generation evaluation
In this section, we compared two methods for generating a candidate set of shops: the method based on the Top-Layer classifier takes 20 or 30 candidate shops with the highest prediction probability, respectively, while the rule-based candidate shop generation method produces the number of candidate shops is uncertain, but mainly concentrated between 20 and 30 (Table 6).
Candidate shop generation.
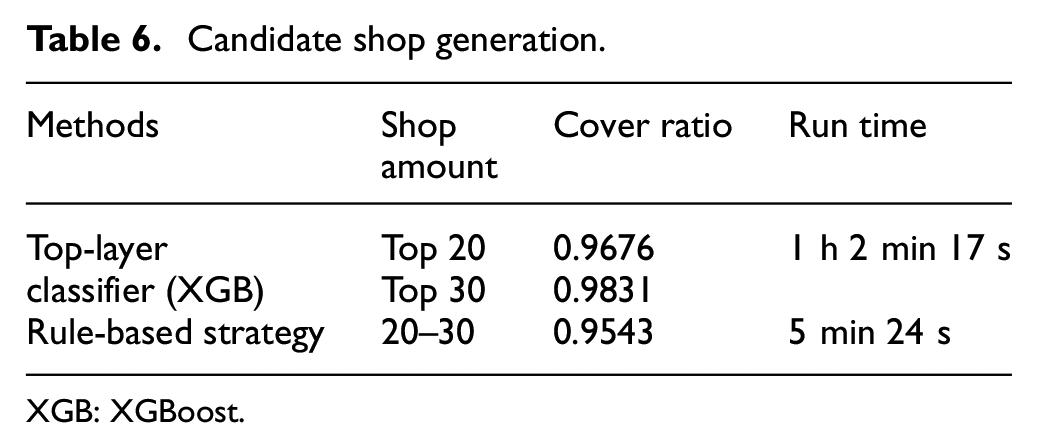
XGB: XGBoost.
Based on the top-layer classifier approach, the ground truth shop coverage ratio is more than 96%, so the training stage effectively covers the shop where the user is located. However, the rule-based strategy achieves an astonishing 95% coverage ratio, which albeit slightly lower than the previous method, but the method does not need extra time to carry out model training process, which produces available candidate shops set.
Model ensemble evaluation
Along with the single classifier (LGB) with the best performance, the accuracy of the confidence-weighted predictions ensemble approach and the stacking-based ensemble method is compared as shown in Figure 12.

Model ensemble accuracy evaluation.
As can be seen from Figure 12, the confidence-weighted predictions ensemble method gives full play to the advantages of different models. Compare to the highest single model from LGB, the localization accuracy is improved by 1.2%. Moreover, based on the stacking ensemble approach, we received more than 1.3% localization accuracy improvement. It is worth noting that the highest accuracy of 93.13% can be obtained by applying only three tree-based models stacking ensemble.
Feature importance ranking evaluation
According to the number of features used in the LGB classifier training process, we focus on the most critical 25-dimensional features. In order to compare the characteristics of different types of features including AP sequence, GPS, the popularity of shops, and probability features of the top-layer classifiers, we label the above accumulation features as different colors. The results are shown in Figure 13.

Sorted features importance from the training process.
As shown in Figure 13, we obtain the following main conclusions from the ranking of feature importance:
Wi-Fi-related statistical features (identified as blue and light blue horizontal bars) play the most crucial role in identifying the location of the store, as more than half (52%) of the top 25 features belong to Wi-Fi-related features, constructing robust features to avoid the impact of RSS fluctuations is the key to the shop-level indoor localization task;
GPS-related features account for 24% (identified as gold horizontal bars). Our sliding-window KNN features play a more significant role than the original Manhattan distance feature, which proves that this feature is capable of strong anti-anomaly ability;
The shop popularity feature (identified as a red horizontal column) includes the weight TF-IDF feature, and the retail time distribution fingerprint feature and the retail competitiveness feature account for 20%, which proves that the popularity of the store is improved compared to the localization accuracy brought by the sensor;
It is worth noting that the green horizontal histogram at the second position strongly suggests that the top-layer classifier brings about further accuracy improvement, also reflecting the effectiveness of the top-layer classification process.
The effect of RSS normalization approaches
In the top-layer classifier, RSS with different mapping approaches may have an impact on localization accuracy. Therefore, we compared the normalization effect of RSS using both linear and nonlinear methods. The linear mode uses Min-Max normalization, and the nonlinear normalization adopts the exponential functions with different bases and Z-score normalization. The accuracy comparison results are shown in Table 7 (here, we still train the LGB model for comparing with the same parameter in Table 5).
The effect of normalization approaches.

RSS: received signal strength.
The significance of bold value represents the highest score in all accuracy.
Table 7 proves that the accuracy is slightly lower when applying Z-score approach for it might be susceptible to outliers. However, except for Z-Score approach, the accuracy of the normalization methods and non-normalized method (the absent AP is directly filled with RSS =−99) is roughly the same; after searching for the best base, we found that the exponential function takes the highest accuracy when base = 1.035.
Algorithm complexity evaluation
To measure the complexity of the proposed algorithm, we compared the training time cost of the top classifier, the bottom classifier, and the two-level classifier (with result ensemble) running on the Thinkpad T450s laptop (2.6 GHz CPU). The results are shown in Table 8.
Comparison of algorithm training time.

KNN: K-nearest neighbors; SVM: support vector machine.
Since the top-layer classifier carried out One-Hot encoding for all APs in the shopping mall to build features, the feature representation is high-dimensional with expensive training time cost. However, for only a small number of candidate shops are involved in the training process and feature space does not exceed 70 dimensions, the training time of the bottom-layer is considerably shortened. Furthermore, the training speed of LGB is superior to RF and KNN. Above experiments also give an expression that to pursue higher accuracy, the model ensemble process requires a redundant computational procedure to train multiple models.
Conclusion
In this article, we proposed SP-Loc: a zero-cost, shop-level indoor location algorithm in the shopping mall, which naturally utilized the Wi-Fi and GPS fingerprints collected from the smartphone by users when payment occurs, thus avoiding the requirements for indoor map and the cost brought by equipment deployment and labor-intensive manual signal collection process. Our algorithm adopts the novel idea of hierarchical localization, the top-layer classifier combined with the rule-based strategies to generate the shops where the users may be located, while the bottom-layer classification process extracts the robust features from various perspectives to predict the shops where the users are located, achieving high localization accuracy.
Footnotes
Handling Editor: Xiaoming Fu
Declaration of conflicting interests
The author(s) declared no potential conflicts of interest with respect to the research, authorship, and/or publication of this article.
Funding
The author(s) disclosed receipt of the following financial support for the research, authorship, and/or publication of this article: This work was supported in part by the National Key Research and Development Program (2018YFB0505200), the National Natural Science Foundation of China (61872046), and the Open Project of the Beijing Key Laboratory of Mobile Computing and Pervasive Device.