
Abstract
A high-sensitive thickness shear mode film bulk acoustic resonator pressure sensor based on lateral field excitation is designed with its structure simulated in environment of air and liquids. A finite element model of film bulk acoustic resonator pressure sensor structure is established to obtain frequency variation under different pressure conditions by parameter sweep method when the multi-physics fields are added to the model. The results of simulation show that the pressure sensor’s resonance frequency is 2.114 GHz and pressure sensitivity is 1200 Hz/kPa in air. In liquid environment, film bulk acoustic resonator pressure sensor displays a pressure sensitivity of 325 Hz/kPa in ethanol, 475 Hz/kPa in deionized water, and 612.5 Hz/kPa in glycerol. This film bulk acoustic resonator pressure sensor has been proved to be highly sensitive both in air and liquid environment and has the potential to be used in biomedical applications.
Keywords
Introduction
With tremendous development of micro- and nanotechnology, film bulk acoustic resonator (FBAR) has been widely used in mobile communications.1–3 The successes in the field of FBAR based on filters motivate researchers to explore these applications in sensors. 4 The use of FBAR in sensing applications is attractive because the high resonance frequency leads to the excellent sensitivity.5–7 In addition, FBAR sensors are also popular for many advantages, such as small size, small base mass, and IC compatibility, which make it possible to be integrated on a chip.8–13 In recent years, the FBAR sensor has become a new research direction for FBAR technology. 14
There are two modes of acoustic wave propagation in solid: longitudinal wave and shear wave. FBAR is a kind of electro-acoustic device, which can be divided into longitudinal mode and thickness shear mode (TSM). 15 In the longitudinal mode of FBAR, two electrodes are fixed on both sides of the piezoelectric film. The direction of electric field is parallel to the thickness direction of piezoelectric film. In the TSM of FBAR, two electrodes can be distributed on the same side or both sides of the piezoelectric film according to c-axis inclination of piezoelectric film. When an alternative electric field is applied between two electrodes, alternative frequency of the electric field satisfies certain conditions and the piezoelectric film will produce resonance and present specific impedance characteristic of electricity. 16 Because the longitudinal wave has rapid attenuation and the shear wave has almost no attenuation in liquid,17,18 TSM FBAR in shear wave mode is suitable to sense pressure in liquid environment. 19 At present, there are two kinds of TSM FBARs, which are lateral field excitation (LFE) and thickness field excitation (TFE). 20 When the two electrodes of TFE FBAR are on both sides of the piezoelectric film, the electric field is exerted along thickness direction of piezoelectric film. When the two electrodes of LFE FBAR are on the same side of piezoelectric film, the electric field is perpendicular to thickness direction of piezoelectric film. 21 Compared with TFE FBAR, the fabrication process of LFE FBAR is simpler and has a better repeatability because we do not need to control the c-axis inclination of AlN piezoelectric film. 22 TSM FBAR sensor based on LFE has great potential for research and has been receiving more attention in recent years. 23 Therefore, the LFE is used as the mode of TSM FBAR pressure sensor in this research.
In this article, an FBAR pressure sensor operating in TSM using LFE is presented. Its resonance frequency is obtained by simulation, the sensitivity of FBAR pressure sensor in air environment is calculated, and the sensitivities of the FBAR pressure sensor in different liquids like ethanol, deionized water, and glycerol are analyzed by finite element method (FEM).
Theoretical backgrounds and structural model
Generally, a solid deforms under the action of an external force. These deformations include plastic deformation and elastic deformation. Elastic deformation is the deformation caused by deviation of a particle from its equilibrium position when an external force acts upon the solid. When the external force is withdrawn, the elastic deformation of the solid restores the original state. When an elastic body is subjected to an external action, the inertial force and the elastic restoring force of each particle in the interior interact with each other, which cause the particle to oscillate and then produce a mechanical acoustic wave in the solid. The strain–displacement equation is as follows

where S is the vector of strain tensor and u is the vector of displacement. The particle motion equation is as follows

where
The constitutive equation of solid mechanics can be derived by equations (1) and (2). It is as follows

where c is the elastic stiffness constant matrix. Stress tensor and strain tensor are second-order tensors and elastic stiffness constant is the fourth-order tensor. This equation displays the functional relationship between stress tensor and strain tensor, and it designates a mathematical model that reflects the macroscopic properties of matter.
The relationship between electric field and electric displacement can be described as follows

where E is the vector of electric field, D is the vector of electric displacement,
Equation (3) reflects the mechanical properties of the material and equation (4) reflects the electrical properties of the material, so equation (3) and equation (4) can be described as follows


where
Based on the above theory, the finite element model of FBAR pressure sensor is established. Figure 1 shows the schematic representation of FBAR pressure sensor.

Schematic representation of FBAR pressure sensor.
The FBAR pressure sensor consists of electrodes, piezoelectric film, air gap, supporting layer, and Si substrate. The electrodes are aligned parallel to each other and attached to piezoelectric film. There is an air gap between piezoelectric film and supporting layer and the setting of air gap is to restrict acoustic wave within the piezoelectric film well. The supporting layer increases the mechanical strength of the FBAR pressure sensor. Electrodes and piezoelectric film use molybdenum and AlN, respectively, and supporting layer adopts Si3N4. Table 1 illustrates the materials and material properties of each layer. The c-axis orientation of FBAR piezoelectric film agrees with the thickness direction. When an alternating current is exerted on the electrodes, the electric field produced between the two electrodes is perpendicular to the thickness direction of piezoelectric film, so that the shear acoustic wave generated by the lateral field is excited in the piezoelectric film. Thickness of piezoelectric film determines the resonance frequency of FBAR pressure sensor. As the thickness of the piezoelectric film decreases, its frequency of the resonance decreases.
Materials and material properties of each layer.

The structure of the designed pressure sensor is simulated in finite element analysis software and simulation works in the following procedure. First, the boundary conditions are set. The boundary conditions contain two aspects: one is the solid mechanics field and the other the electrostatic field. Boundary conditions of the solid mechanics field include boundary load, fixed constraint, linear elastic material, and piezoelectric material. The boundary load is applied on the device; that is, the pressure is exerted on the upper surface of the sensor. The fixed constraint is set on a silicon substrate. The left and right boundaries of FBAR pressure sensor are the fixed constraints. The electrode layer, the supporting layer, and the silicon substrate layer should use the linear elastic materials. The piezoelectric film should use AlN which has the characteristics of a linear elastic material. The boundary conditions of electrostatic field include charge conservation, excitation electrode, and ground electrode. The piezoelectric film is the area of charge conservation. The left electrode is the excitation electrode and the right electrode is the ground electrode. Then, the finite element model of the sensor’s structure is meshed into large quantities of tiny finite elements. The trend of the deformation in the whole structure can be obtained by the FEM. The above setting satisfies the conditions of electromechanical field and the electrostatic field in the model. When a 0.3 V AC excitation is exerted on the electrode of the FBAR pressure sensor, the simulation is started.
Results and discussion
In this section, the simulation results of LFE FBAR pressure sensor are presented and analyzed. The distribution of sensor’s deformation displacement is shown in Figure 2. When the 0.3 V AC excitation is added to the electrode of the FBAR pressure sensor, the sensor will become deformed and shifted. In the longitudinal direction, the maximum deformation displacement occurs at middle of the electrodes and decreases gradually to both sides; the maximum deformation displacement is 0.012 μm. In the horizontal direction, the mode shape of piezoelectric film deforms toward the shear direction as is shown in Figure 2. The deformation displacement mainly occurs on the position of electrodes and piezoelectric film, with almost no change in the substrate. The range of deformation displacement can reflect the pressure capacity of FBAR pressure sensor, and the maximum deformation displacement is within the range of elastic deformation which can prove the availability of FBAR pressure sensor.

FBAR pressure sensor’s deformation displacement diagram (the maximum deformation displacement is 0.012 μm).
The electric field intensity distribution of the FBAR pressure sensor is shown in Figure 3. The increasing density of the arrows indicates the greater electric field intensity. The area between the two electrodes is the most concentrated region of arrows with the arrow direction being perpendicular and it remains in the maximum intensity of the electric field. The decrease in the arrow density indicates the decrease in electric field intensity. The arrows at each end of the sensor are most sparse and their directions keep almost parallel to the horizontal surface of the piezoelectric film. Thus, it can be found that the distribution of electric field intensity is similar to that of deformation displacement. The distribution of deformation displacement is affected by the electric field intensity. The greater the electric field intensity is, the greater the electric displacement will be, which agrees with piezoelectric coupling equation just given above. The feasibility of this FBAR pressure sensor has been further verified.

Distribution of electric field intensity of FBAR pressure sensor.
The resonance frequency of FBAR pressure sensor is related to the response voltage. In simulation process, in order to obtain resonance frequency of the designed FBAR pressure sensor, a probe is placed on electrode surface of the FBAR pressure sensor to get the real-time changes in voltage. The probe is a kind of implement in simulation software, which can extract the required physical quantities in the process of simulation, such as temperature, pressure, and voltage. In this article, the probe is used for detecting real-time voltage on electrodes. Through the parameter sweep, the real-time voltage can be obtained at any time during the frequency sweeping study; frequency sweep range is 2.11–2.12 GHz and the step value is 200 kHz. The relationship between voltage and pressure can be drawn by multi-physical field simulation software. Figure 4 shows the relationship between response voltage of FBAR pressure sensor and frequency in the vicinity of shear mode resonance frequency. Simulation results show that the response voltage reaches the maximum value at the frequency of 2.114 GHz. That is, resonance frequency of the FBAR pressure sensor in air environment is 2.114 GHz, which agrees with the mode shape analysis. The response voltage reaches the minimum value at the frequency of 2.118 GHz, which is the anti-resonance frequency. Since the value of the anti-resonance peak is very small compared to that of the resonance peak in the same coordinates, its value change is difficult to be observed in Figure 4.

Relationship between response voltage of FBAR pressure sensor and frequency in the vicinity of shear mode resonance frequency in air environment (2.114 GHz).
Simulation experiments on the relationship between the pressure and the resonance frequency show that the linear relationship is obvious under the pressure changes from 1000 to 5000 kPa. The relationships between the response voltage and the frequency at the pressure of 1000, 2000, 3000, 4000, and 5000 kPa are analyzed and the results are presented in Figure 5(a). Five curves of the relationship between response voltage and frequency corresponding to the pressure of 1000, 2000, 3000, 4000, and 5000 kPa show that the resonance frequency is different at different pressure. The response voltage at resonance frequency is almost constant, approximately 0.172 V. Figure 5(b) presents the relationship between pressure and resonance frequency. It can be seen that the linear relationship between them is obvious. As the pressure increases, the corresponding resonance frequency decreases. By least squares fit, the pressure sensitivity of FBAR pressure sensor is 1200 Hz/kPa in air environment.
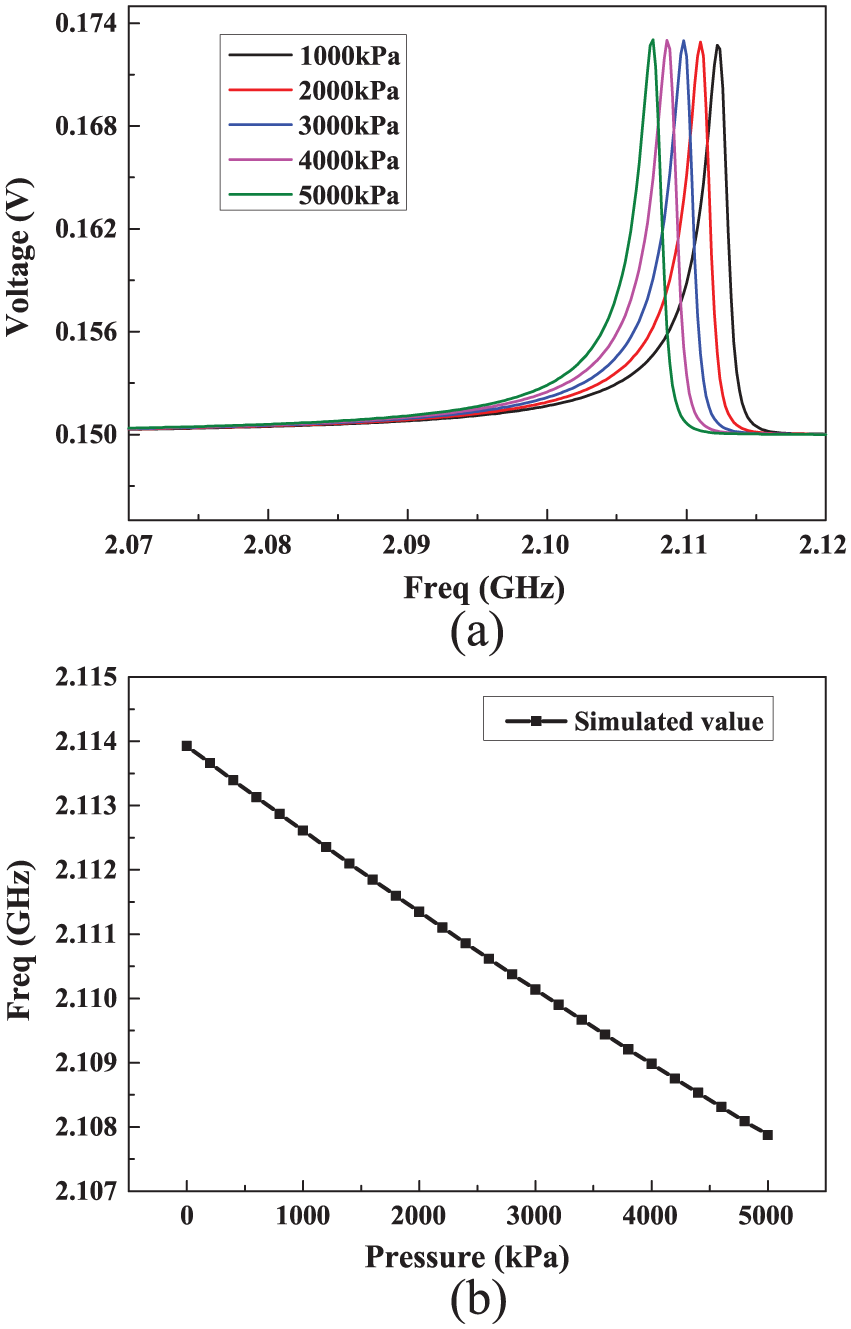
(a) In air environment, relationship between response voltage of FBAR pressure sensor and frequency in the vicinity of shear mode resonance frequency (2.114 GHz). (b) The relationship between pressure and frequency of FBAR pressure sensor in air environment.
Since there is nearly no attenuation to the shear wave in liquids, the FBAR in shear wave mode performs well in liquid environments. Therefore, FBAR pressure sensor is simulated in liquid environment. Figure 6 shows the schematic representation of FBAR pressure sensor in liquid environment. The modeling process, the simulation steps, and the setting of boundary conditions in the liquid environment are also presented. The influence of the liquid pressure on the simulation results is taken into account and the external pressure is set to a standard atmospheric pressure. In the design of sensors, a pressure application layer is installed on the piezoelectric film. The pressure application layer uses silicon material and connects with the piezoelectric film. This design can make the pressure act on the pressure application layer and avoid the damage caused by the excessive pressure acting on the piezoelectric thin film. However, in the process of simulation, the influence of pressure application layer on simulation results is very small. Thus, this structure is omitted in order to reduce the amount of calculation.

Schematic representation of FBAR pressure sensor in liquid environment.
Three typical liquids are used in simulation, as is described in Table 2. These three liquids are selected according to the physical properties, parameters such as density, acoustic velocity, and viscosity of the liquid are considered. As is shown in Figure 7, the resonance frequency of FBAR pressure sensor is different in three different solutions, which is the largest in glycerol, the medium in deionized water, and the minimum in ethanol. Similarly, the response voltage in glycerol is the largest, followed by that in deionized water, and the minimum is the response voltage in ethanol. The simulation also shows that FBAR pressure sensor works well in liquid environments. Resonance frequency changes with the detection pressure of the sensor.
Liquids’ material parameters.


Relationship between response voltage of FBAR pressure sensor and frequency in the vicinity of shear mode resonance frequency in ethanol, deionized water, and glycerol environment.
The sensing characteristics of FBAR pressure sensor in liquid environments are simulated and analyzed under different pressure conditions. Because sensitivity of FBAR pressure sensor in liquid environment is lower than in air, greater pressure is put in the simulation in liquid than in air in order to facilitate observation. Figure 8 shows the relationships between voltage response of the sensor and the frequency under three liquid environments at the pressure of 100, 200, 300, 400 and 500 MPa. Figure 8(a) is a diagram of corresponding resonance frequency of the FBAR pressure sensor in ethanol environment under those five different pressure conditions, Figure 8(b) shows a change in the resonance frequency of the FBAR pressure sensor in the deionized water under those five different pressure conditions, and Figure 8(c) is a diagram of the corresponding resonance frequency of the FBAR pressure sensor in the glycerol environment at those five different pressure conditions. When the pressure is set at 100, 200, 300, 400, and 500 MPa separately, the corresponding pressure and response voltage curves are obtained in the three liquids (Figure 8(a)–(c)). The same trend can be observed, which is the resonance frequency increases with the increase in pressure, the corresponding response voltage decreases and becomes more difficult to detect to a certain extent.

Under different pressure conditions, relationship between response voltage of FBAR pressure sensor and frequency in the vicinity of shear mode resonance frequency in (a) ethanol environment, (b) deionized water environment, and (c) glycerol environment.
The relationship between pressure and resonance frequency is shown in Figure 9(a)–(c). In three different liquids, there is a good linear relationship between the pressure and the resonance frequency in a certain range of pressure and the pressure sensitivity of FBAR pressure sensor in the three liquids is estimated by least squares fit; the results are that the pressure sensitivity is 325 Hz/kPa in ethanol environment, 475 Hz/kPa in deionized water environment, and 612.5 Hz/kPa in glycerol environment. The pressure detection range of the designed FBAR pressure sensor in the liquid environment is 50–550 MPa. Using the least square fitting method, the relationship between pressure and frequency of pressure sensors in liquid environment can be expressed as follows

In these three liquids, k = 3.25e−4, b = 1.73 in ethanol environment; k = 4.75e−4, b = 1.89 in deionized water environment; and k = 6.12e−4, b = 1.92 in glycerol environment.
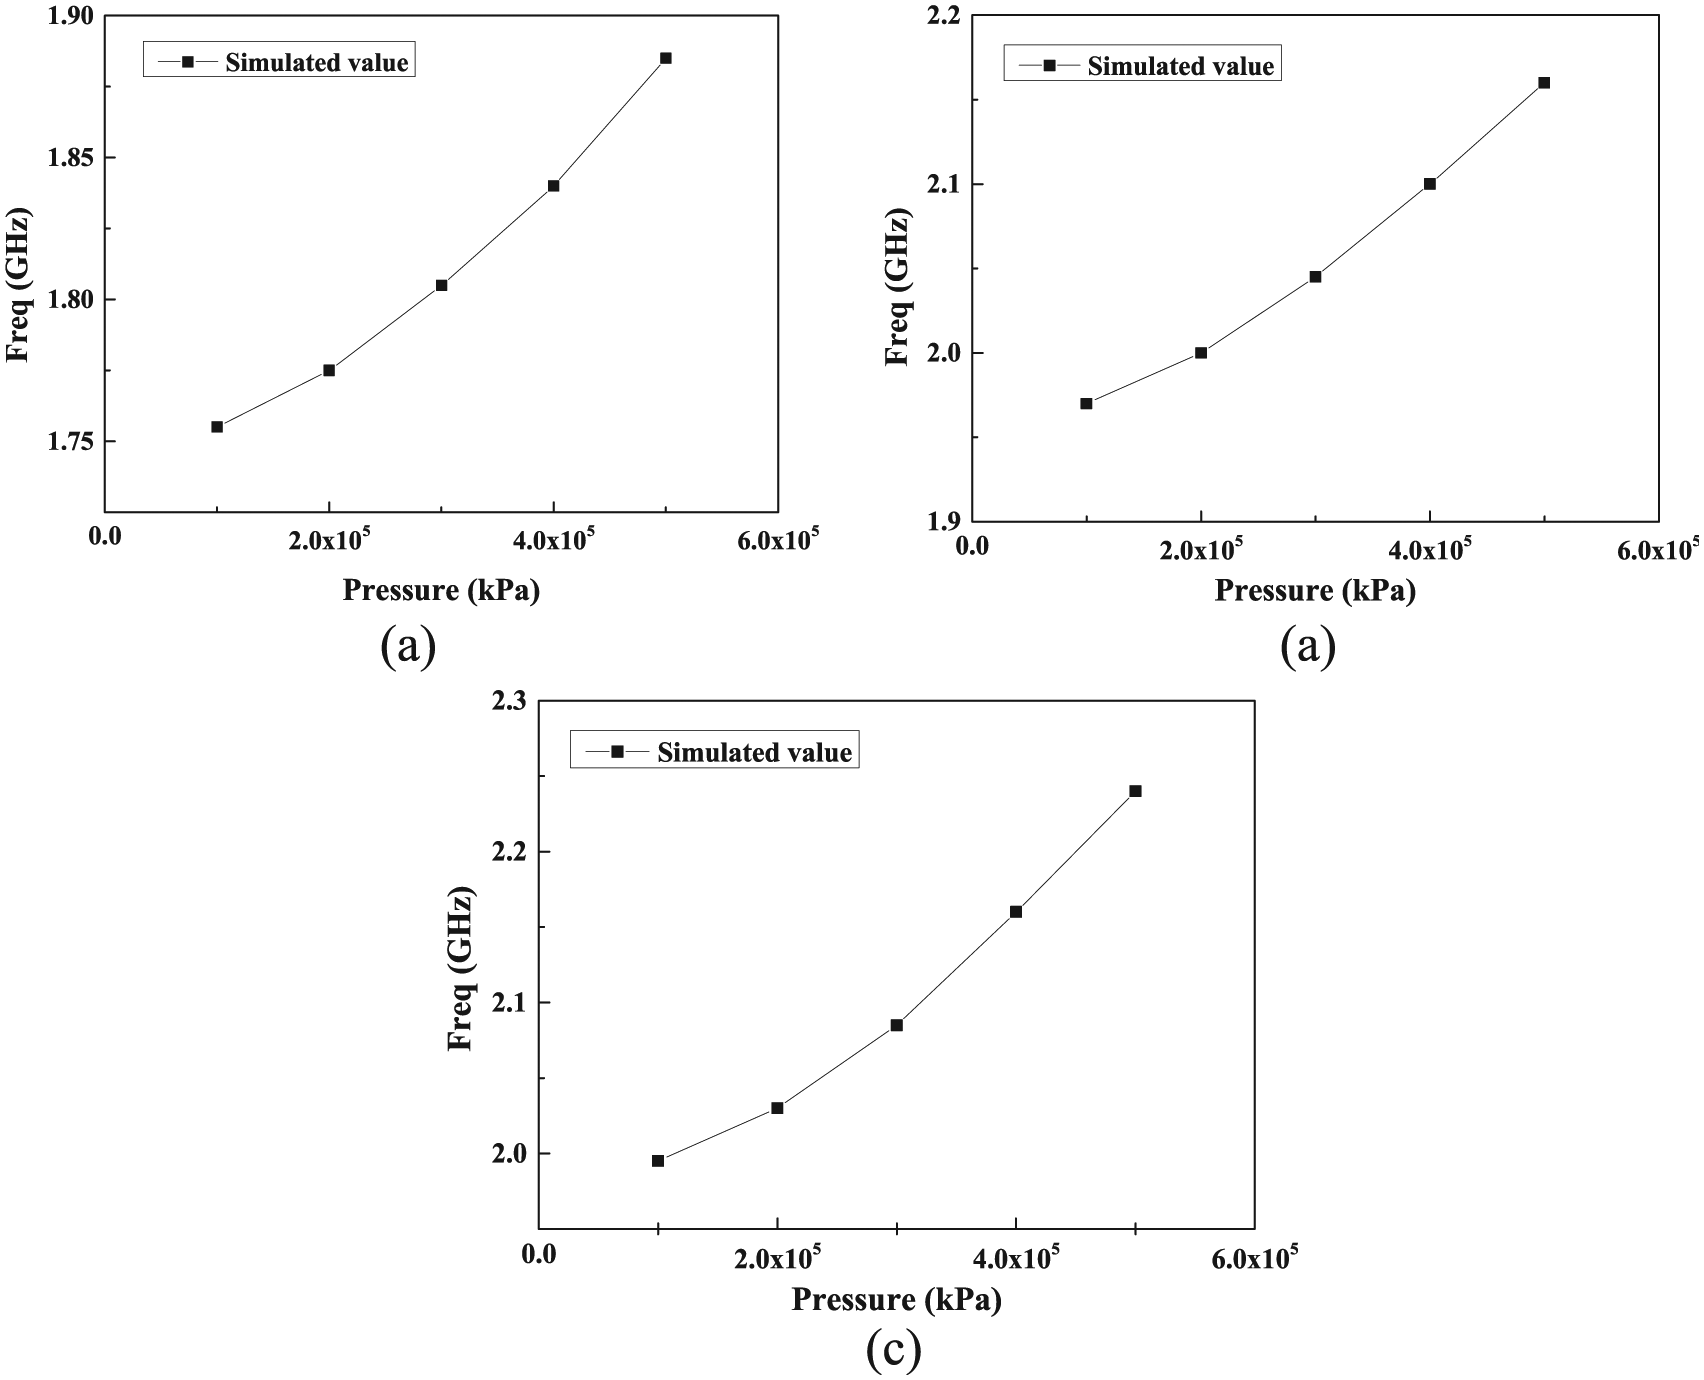
Relationship between pressure and frequency of FBAR pressure sensor in (a) ethanol environment, (b) deionized water environment, and (c) glycerol environment under different pressure conditions.
It can be seen that with the increase in medium liquid density, the greater acoustic velocity leads to the greater pressure sensitivity in liquid environment. Although the sensitivity of FBAR pressure sensor displays lower in liquid compared with that in air environment, it still demonstrates a good linear relationship to verify the availability of FBAR pressure sensor in liquid environment.
Conclusion
A thickness shear mode FBAR pressure sensor based on LFE has been designed, simulated, and characterized. The performance of the device has been addressed in liquid and air environments. The above results illustrate clearly that the designed sensor takes on a higher sensitivity and a good linear relationship between the pressure and the resonance frequency in both environments. In addition, it has some characteristics such as small size and low cost and is compatible with the standard IC technology.
Footnotes
Acknowledgements
S.S., Z.G., and X.M. designed the simulations and wrote the paper; Q.T. revised the paper; and J.X. contributed the analysis tools. This paper was submitted to The International Conference on Electrical, Electronic Engineering, Intelligent Computing and Sensor Network (ICEEE 2018) for selection of publication in journals, which is sponsored by the Advanced Science and Engineering Technology Institute, which aims at providing a forum for engineers and scientists in academia, university, and industry to present their latest research findings in any aspects of advanced science and engineering technology. Su Jianxiu from the committee assisted with the submission of the paper, which is authorized by all the listed authors. As a professional institute helping many scholars for their publications for several years, the assistance was paid for, which is also confirmed by all authors.
Handling Editor: Roberto Casas
Declaration of conflicting interests
The author(s) declared no potential conflicts of interest with respect to the research, authorship, and/or publication of this article.
Funding
The author(s) disclosed receipt of the following financial support for the research, authorship, and/or publication of this article: This work is supported by the National Natural Science Foundation of China (nos 51675493 and 51425505), Fund for Shanxi 1331 Project Key Subject Construction, Program for the Top Young Academic Leaders of Higher Learning Institutions of Shanxi Province, China.