
Abstract
Wind loads are the dominant loads for large-scale buildings and structures in tropical cyclone-prone regions; however, wind characteristics in tropical cyclones are still far from being understood. In this study, wind characteristics concerned in engineering applications, for example, wind attack angle, friction velocity, drag coefficient, turbulence intensity, integral scale, gust factor, and peak factor, were carefully investigated based on field measurements in typhoon Hagupit and were compared with measurements in typhoon Maemi and three hurricanes in literatures. The results show that drag coefficient increases with mean wind speeds at low levels and then decreases gradually at wind speed greater than 22.45 m/s in typhoon Hagupit over sea surface; turbulence intensities in front-side eyewall region are greater than those in back-side eyewall regions both in typhoons and hurricanes; the ratio between longitudinal integral scale and lateral integral scale,
Introduction
Typhoons frequently make landfall in South China each year and cause severe structural damages with attending serious economic and personnel loss. 1 Strong winds and turbulent fluctuations in typhoons are primarily responsible for such structural damages. 2 In the boundary layer of a tropical cyclone (typhoon or hurricane), mean and turbulent wind fields have characteristic flow structures driven by buoyancy and shear that are observed to vary significantly as the radius increases from wind eye to outer-vortex regions, and to render the wind characteristics different from synoptic winds. 3 In addition to the structural characteristics, sudden change in wind speeds and directions along the radial axis of the storm wind field may also lead to large excursions in wind speeds at ground level as the sharp interface/eyewall meets the ground and the radial pressure gradient associated with the turbulence gradient drives an inward flow, which stimulates roll structures that are aligned with the swirling flow by the combined convective and dynamic instabilities.3–6 Wind loads are the key load of tall buildings and long-span bridges in cyclone-prone regions. However, turbulent wind characteristics and flow structure in tropical cyclones are still far from being completely understood to guide wind-resistant design of structures and buildings and to mitigate the structural damages in cyclone-prone regions due to the complexity of tropical cyclone structure and the limitation of reliable data. 7
To learn more about boundary-layer wind characteristics in tropical cyclones, a number of field monitoring programs focusing on the wind characteristics and wind–structure interactions have been initiated in cyclone-prone regions.7–16 However, as wind characteristics are strongly influenced by the underlying surface exposure, observed locations in a tropical cyclone wind field (e.g. wind eye, eyewall regions, and outer-vortex regions), and the strength and spatial scale of a tropical cyclone, they are still ambiguous. Through a comparative study of multi-platform measurements in typhoons and/or hurricanes, it is meaningful to conclude the wind characteristics in tropical cyclones to advance the structural design in cyclone-prone regions.
In general, field measured winds were treated to be stationary, Gaussian and ergodic random processes. However, wind data measured in tropical cyclones show non-stationary and non-Gaussian features. The non-stationary wind will induce non-stationary wind effects on linear structures, which cannot be addressed through current wind codes as they are based on random vibration theory in frequency domain. Consequently, the time-varying wind characteristics and evolution spectrum of tropical cyclone winds were investigated by some researchers using wavelet transform (WT), empirical model decomposition (EMD), and short-time Fourier transform (STFT).17–23 However, due to the limitation of typhoon wind specimens and the variability of wind characteristics of non-stationary winds, there is still no consensus about the non-stationary wind characteristics in a tropical cyclone wind field.
In this article, a comparative investigation of wind characteristics measured in two typhoons (Hagupit in 2008 and Maemi in 2003) and three hurricanes (Katrina, Rita, and Wilma in 2005) was conducted. Basic descriptions of tropical cyclones and measured facilities were present in the “Tropical cyclone events and measurement facilities” section. The “Wind characteristics” section presents a comparative analysis of wind characteristics such as mean wind speed and direction, friction velocity, aerodynamic roughness length, drag coefficient, turbulence intensity, integral scale, gust factor, and peak factor in typhoon Hagupit and other tropical cyclones reported in literatures. The timescale for calculating the mean values is 10 min in typhoons and 15 min in hurricanes. Concluding remarks were given in the “Concluding remarks” section.
Tropical cyclone events and measurement facilities
Typhoon Hagupit was the 14th typhoon in 2008 and also the most intense typhoon that affected Guangdong province since 1996. Typhoon Hagupit made landfall near Dianbai city in western Guangdong province, China, at 6:45 a.m. on 24 September 2008. During landfalling of typhoon Hagupit, the maximum 2 min mean wind speed was 48 m/s near center, and the center pressure was 950 hPa. Figure 1 shows the track of typhoon Hagupit during 19 to 25 September 2008.
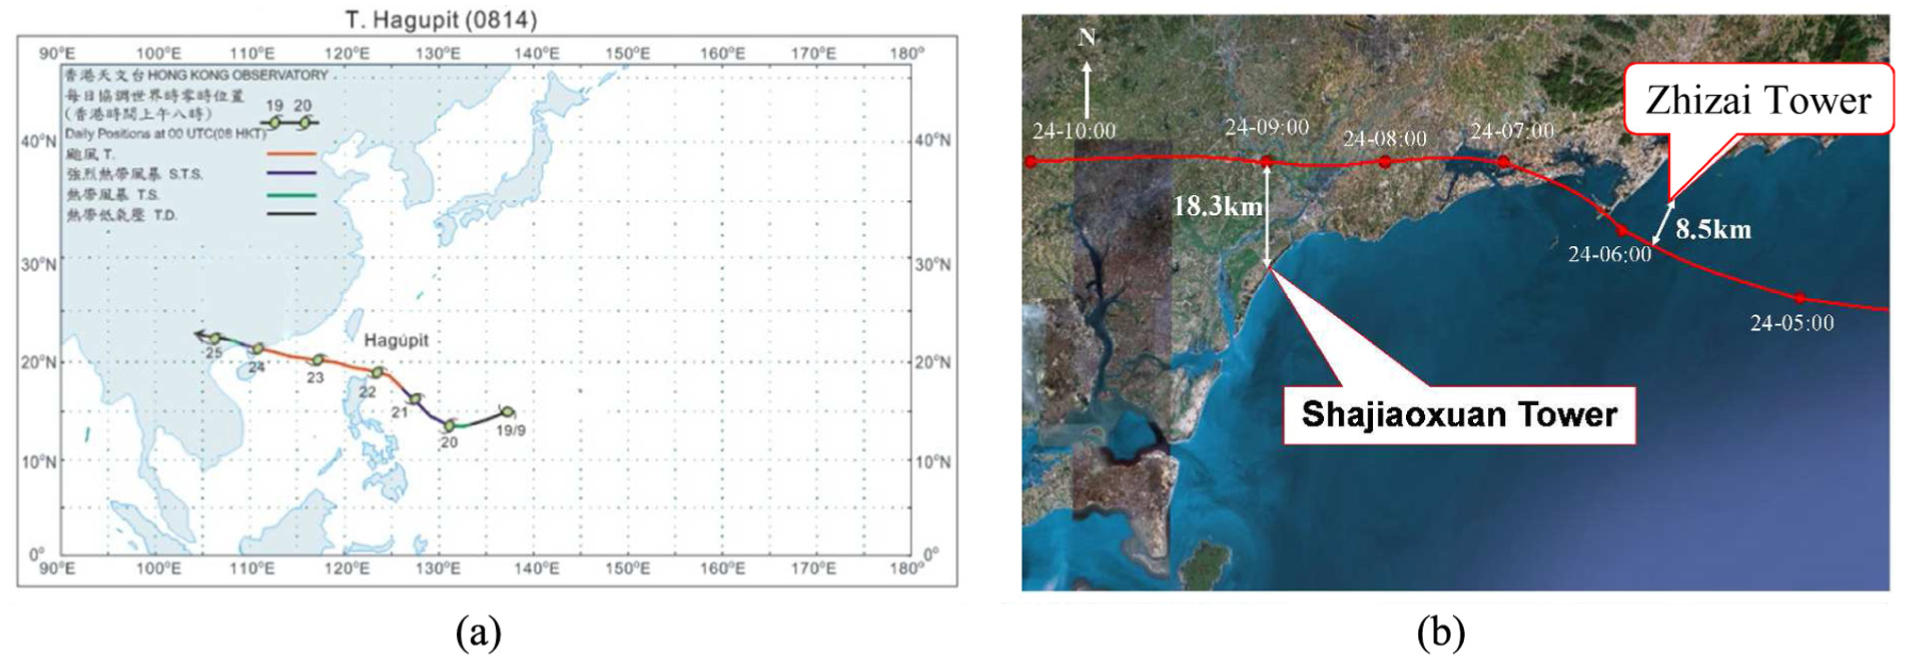
(a) Track of typhoon Hagupit and (b) the locations of wind observed towers.
Typhoon Hagupit was simultaneously measured at Zhizai tower (ZT) and Shajiaoxuan tower (ST). ZT is a 100-m high typhoon wind observation tower located at the top of Zhizai Island, which is a small island with length of 120 m, width of 50 m, and highest altitude of 18 m. The geographic coordinate of the ZT is 111°22′47.30″E longitudinal and 21°27′04.12″N latitudinal. The shortest distance from the ZT to the mainland is about 4.46 km. The ZT is fairly exposed to open water. There is a Dazhuzhou Island located in the south-southwest (SSW) side of the ZT with distance about 1 km. Seven levels of sensors outfit the tower at elevations of 8, 10, 20, 40, 60, 80, and 100 m. The data acquisition system measures three-dimensional (3D) wind speed and direction at 60 m height using Gill WindMaster Pro ultra-anemometer at a sampling frequency of 10 Hz and collects barometric and temperature at 8 m height using NRG BP-20 barometer and NRG #110S temperature sensor, respectively. Six NRG #40 anemometers were set at 10, 20, 40, 60, 80, and 100 m to collect wind profile data; meanwhile, three NRG #200P wind vanes were set at 10, 60, and 100 m to collect wind direction data. The wind speed range of Gill WindMaster Pro ultra-anemometer is between 0 and 65 m/s with resolution of 0.01 m/s and accuracy of smaller than 1.5% of root mean square (RMS) at 12 m/s. The wind direction range is between 0° and 359° with resolution of 0.1° and accuracy of 2° at 12 m/s. ZT recorded the wind data in typhoon Hagupit from 00:00:00, 22 September to 23:59:59, 26 September 2008. Figure 2(a) and (b) shows the location and outfit of the ZT.

(a) Location of Zhizai tower and (b) exposure of Zhizai tower.
ST is a 70-m high triangular lattice tower located near the seashore of Shajiaoxuan, Wuchuan city, Guangdong, China. The coordinate of ST is 21°15′13.5″ in latitude and 110°39′14.8″ in longitude. The shortest distance between the measurement site and the typhoon eye was about 18.3 km and the site is surrounded by the seaside from 23° to 215°. In other directions, it is exposed to flat land surface within a distance of at least 500 m, as shown in Figure 3(a). Figure 3(b) shows the outfit of wind speed measurement facilities on ST. Four NRG #40C anemometers were installed on the cantilevers at 10, 30, 50, and 70 m height, one propeller anemometer (Model 05106, R.M. Young Company, USA) and a CSAT3 (Campbell Scientific Inc., USA) ultrasonic anemometer were installed on the cantilever at 5 m, and another one propeller anemometer (Model 05106, R.M. Young Company, USA) and a HD2003 (Delta OHM, Italy) ultrasonic anemometer were installed on the cantilever at 11 m height. The wind speed range of the CSAT3 ultrasonic anemometer is between 0 and 65.535 m/s with resolution of 0.001 m/s of RMS. The wind direction range is between 0° and 360° and accuracy of ±0.7° at 1 m/s for horizontal wind. The dynamic characteristics of the HD 2003 ultrasonic anemometer are as follows: wind speed range is between 0 and 60 m/s with resolution of 0.01 m/s and accuracy of ±1% of reading; wind direction range is between 0° and 360° with resolution of 0.1° and accuracy of ±2°. The wind speed range of the propeller anemometer (Model 05106, R.M. Young Company, USA) is 0 to 100 m/s, and its distance constant is 2.7 m, 63% recovery for wind speed, and 1.3 m, 50% recovery for wind direction, respectively. The threshold is 1.1 m/s. In typhoon Hagupit, ST recorded the wind data from 18:27:06, 23 September to 10:18:05, 25 September 2008.
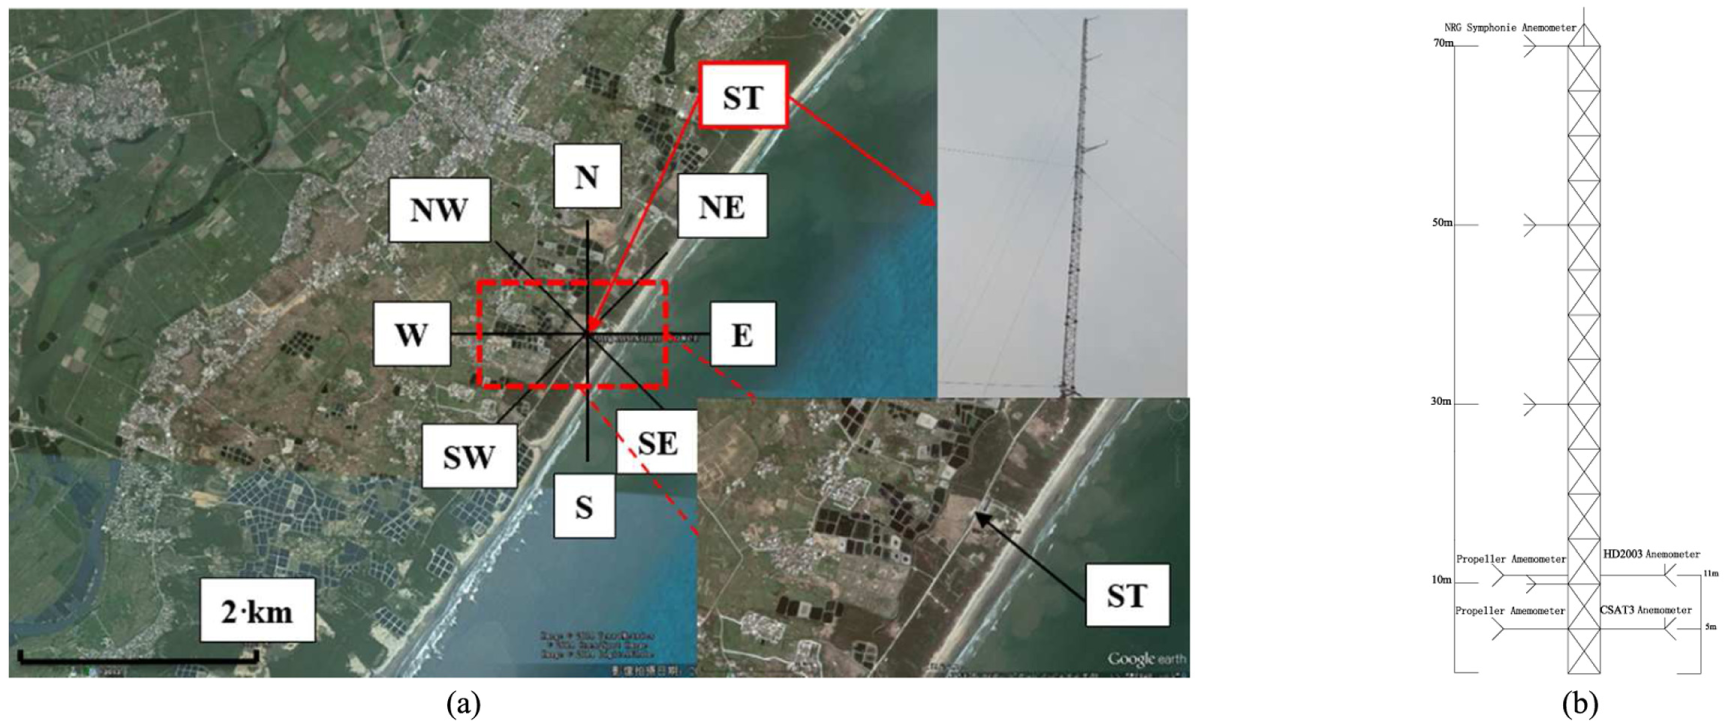
Shajiaoxuan wind observed station: (a) exposures of Shajiaoxuan tower and (b) layout of instruments on Shajiaoxuan tower.
Both the ZT and ST were triangular lattice tower, with each side of width of 0.6 m. The cantilevers are 1.5 m long (which is greater than the 1.5 times the largest lateral dimension of the tower), installed on the east side of the towers. The structural member densities of the two towers (ZT and ST) are less than 0.3. The distance between the anemometers and the tower meets the basic requirement for the observation. Thus, the distortion of flow induced by the tower was negligible. 24
Typhoon Maemi was recorded at an experiment site for electric cables of the Furukawa Electric Co. Ltd. The detailed description of the instruments and terrain condition was given by Cao et al. 7
Katrina, Rita, and Wilma were three hurricanes in 2005 and measured by portable instrumented towers developed by the Florida Coastal Monitoring Program (FCMP). The detailed account of the instruments and terrain conditions is available in Masters et al. 15
Wind characteristics
Mean wind speeds and directions
In order to investigate the wind characteristics in different locations in the wind field of typhoon Hagupit, the records were partitioned into two sections as the front-side eyewall region (Section A) and back-side eyewall region (Section B). Figure 4(a) and (b) shows the 10-min mean wind speeds and horizontal and vertical directions in the periods from 00:00:00, 24 September to 00:00:00, 25 September 2008 at 60 m height on ZT during typhoon Hagupit. The maximum of the 10 min mean wind speeds is 45.88 m/s. As wind eye passed through the ZT, the 10 min mean wind speeds have two peaks. The first peak was 45.88 m/s and the second was 40.08 m/s. The horizontal wind directions were shifted approximately 197° between the front-side eyewall region and back-side eyewall region.

(a) 10 min mean wind speeds and horizontal directions and (b) 10 min vertical mean wind directions at Zhizai tower.
Wind attack angle (vertical wind direction) is an important parameter for wind-resistant design of long-span bridges. In Chinese wind code (GB50009-2012), the wind attack angle is set to be between −5° and 5°. From Figure 4(b), it is noted that the wind attack angles were mainly between 1° and 7° in the front-side eyewall region in typhoon Hagupit. When the wind eye passed through the observation tower, the wind attack angles dropped off quickly. In the outer-vortex region, the wind attack angles were mainly between −1° and 2°.
Figure 5(a) and (b) shows the 10 min mean wind speeds and directions from 00:00:00, 24 September to 00:00:00, 25 September 2008 at 5 and 11 m height on ST in typhoon Hagupit. The maximum of the 10 min mean wind speeds and directions were also listed in Table 1. The horizontal wind directions were shifted approximately 119° before and after the pass by of wind eye. From Figure 5(b), it can be noted that the downward winds were dominant at 5 m height in both front-side eyewall region and back-side eyewall region, while at 11 m height the wind gradually changed from downward to upward.

10 min mean wind speeds, and horizontal and vertical wind directions in Shajiaoxuan tower: (a) 10 min mean wind speeds and directions and (b) 10 min vertical mean wind directions.
The maximum of the 10-min mean wind speeds, directions, and 3-s peak gusts.

In typhoon Maemi, the 10-min mean wind speeds and directions are given in Cao et al. 7 The maximum of the 10-min mean wind speeds and directions and the maximum of 3-s gust winds were also given in Table 1. When wind blows from east direction (seaside), the wind attack angle is 4.8°; when wind blows from west direction (land side), it is 1.6°. The wind attack angle dropped off about 3.2° before and after the pass by of wind eye, which is similar to that in typhoon Hagupit at Zhizai station.
The maximum of the 10-min mean wind speeds and directions, and the maximal peak gusts in the three hurricanes were shown in Table 1.
Friction velocity and aerodynamic roughness length
According to the law of the wall, there is an overlap region with approximately constant shear stress and far enough from the wall that viscous effects can be neglected. Therefore, the friction velocity is defined as the following

where τ is the wall shear stress and ρ is the flow density. In the constant shear stress region, the mean wind speed profile follows the logarithm law and the friction velocity keeps a constant.
Aerodynamic roughness length z0 is defined as the distance from surface to the height where the idealized velocity given by the law of the wall tends to zero. It should be nonzero as the wind velocity profile defined by the law of the wall does not apply to the laminar sublayer. There are basically two approaches to determine the roughness in atmospheric boundary layer (ABL). One is called morphometric method,25–27 which uses the geometric characteristics of the surface morphometric to determine the roughness length. Another one is called micrometeorological method,28,29 which uses field measured wind and temperature data to determine the roughness length. In this study, the wind profile method is used to determine the friction velocity and roughness length. In this method, the roughness length, z0, is defined as the height where the downward extrapolated logarithmic velocity profile reaches zero. The friction velocity is defined as the slope of the mean wind speeds against the log heights. In this method, relatively small variations of the mean velocity would lead to a relatively large variation of the roughness length.
In typhoon Hagupit on ZT, due to the topographic influence, the wind profile did not follow the log law well; the following formula was used to calculate the friction velocity
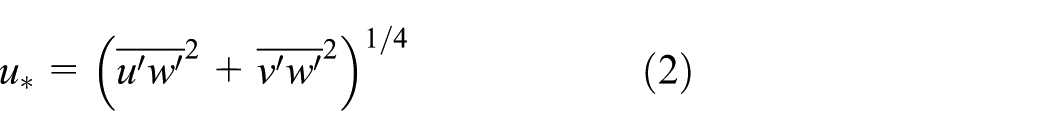
where
Figure 6(a) and (b) shows the relationship between the 10-min mean wind speeds and friction velocities at ZT and ST, respectively. It is noted that the friction velocities increase linearly with the 10-min mean wind speeds, and the slope also increases with the underlying surface roughness. The relationship between the friction velocities and mean wind speeds was linear fitted by least square fitting method, and the parameters were listed in Table 2. The turbulence ratios,

Relationship between the friction velocities and mean wind speeds: (a) Zhizai tower and (b) Shajiaoxuan tower.
Linear fitted parameters between friction velocities and mean wind speeds.

Turbulence ratios in typhoons and hurricanes.

The drag coefficient, CD, is commonly used to describe the aerodynamic properties of wind–terrain interaction. It is defined as

The air–sea interaction in tropical cyclones is of primary importance for severe weather forecasts and risk assessment. There is little comprehensive study on it. The behavior of CD in tropical cyclones is extrapolated from field measurements in weak winds. These extrapolations describe an increase in CD with mean winds. Powell et al. 31 found that the drag coefficient leveled off and started to decrease at wind speed of about 33 m/s. Figure 7 shows the relationship between the drag coefficients and the mean wind speeds at ZT. At a wind speed of about 22.45 m/s, the drag coefficients begin to decrease gradually with the mean wind speeds; this may be because the sea surface was covered by a layer of foam at high wind speed that progressively forms a “slip” surface at the air–sea interface. 31

Drag coefficients, CD versus 10-min mean wind speeds.
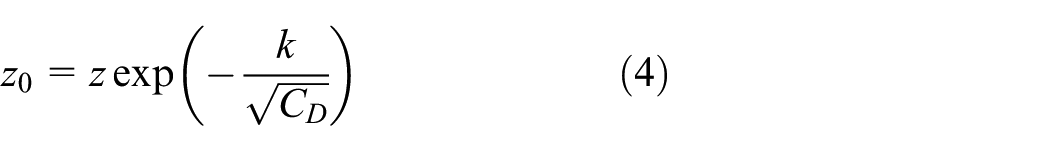
Combining the log law and equation (3), the roughness length is expressed as
Over the sea surface, the relationship between the friction velocity and roughness length has been presented as 32

where
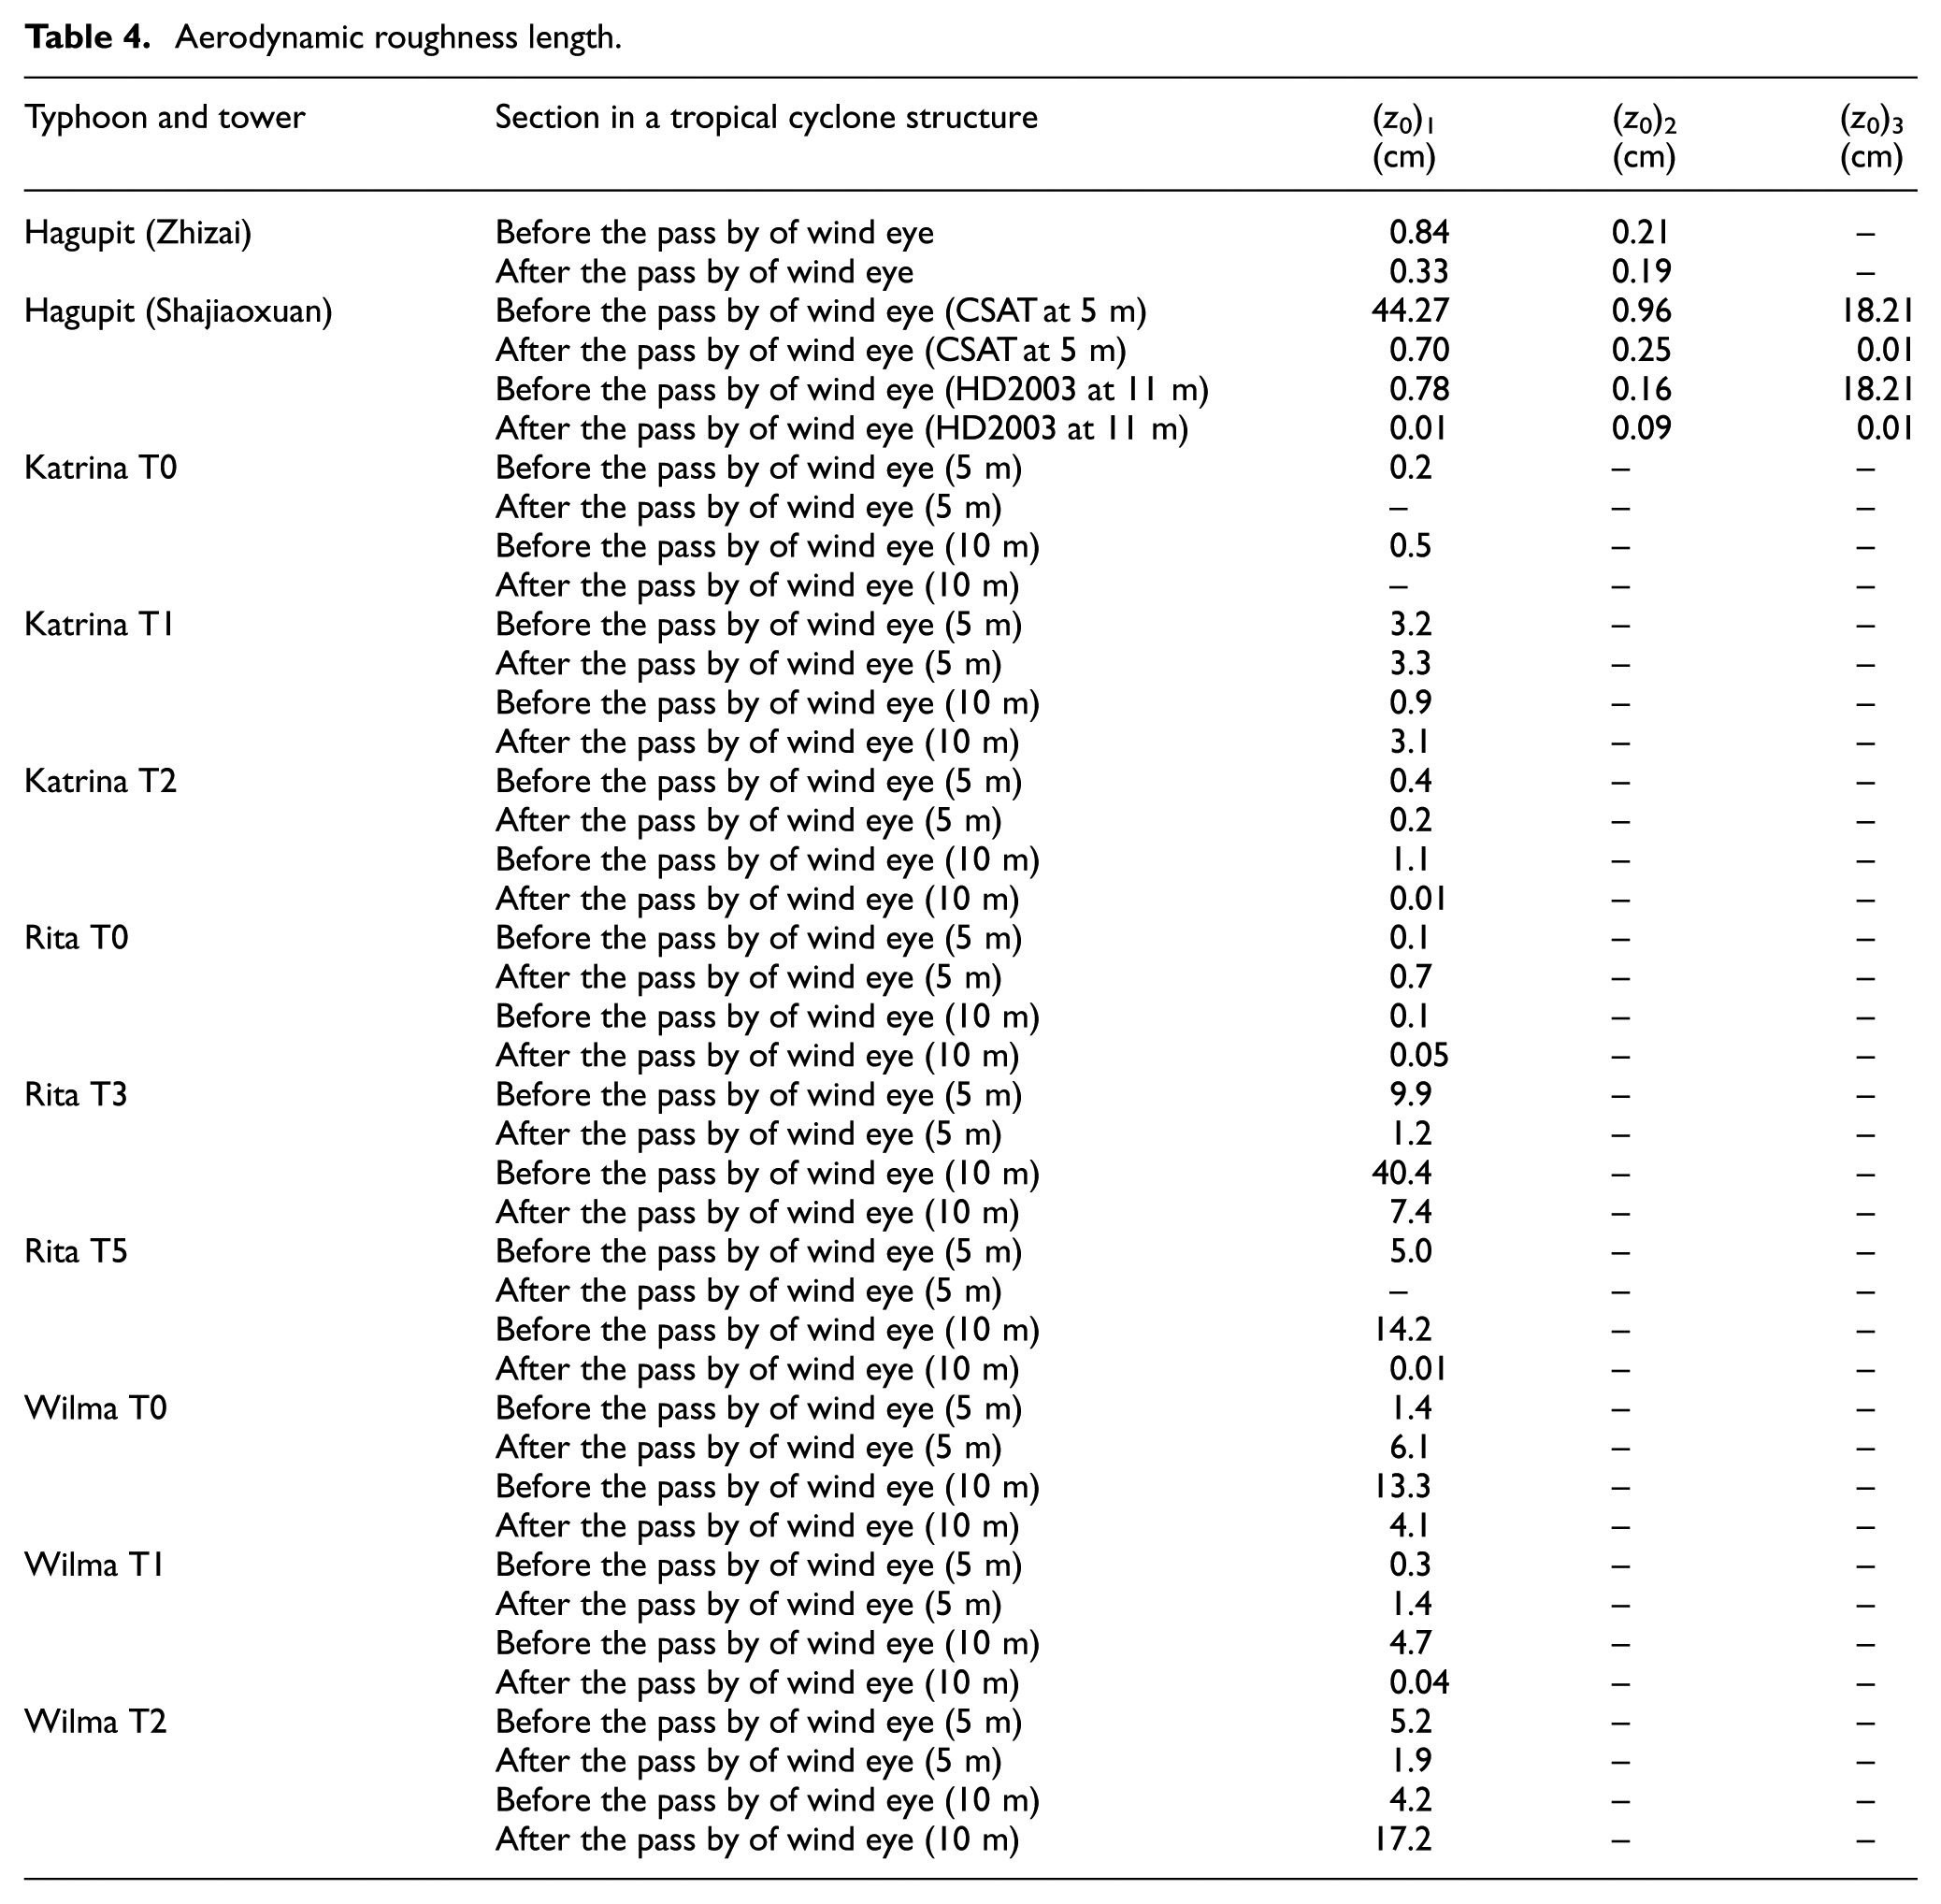
Table 4 lists the aerodynamic roughness in typhoon Hagupit and the three hurricanes: (z0)1 is derived by inserting the average value of CD for each section into equation (4); (z0)2 is derived from equation (5) for each section, and the Charnock constant is chosen as 0.025; and (z0)3 is derived from the wind profile method. At ZT, the roughness length in front-side eyewall region is greater than that in back-side eyewall region, which can be attributed to the high wind speeds inducing high wind wave. In ST, the roughness length in northwest direction is greater than that in south direction; it is according to the underlying surface condition. The aerodynamic roughness calculated in different methods is at the same decade mostly. Aerodynamic roughness for the three hurricanes was also shown in Table 4.
Aerodynamic roughness length.
Turbulence intensity
Turbulence in tropical cyclones is mainly affected by the mean wind speeds, underlying surface, atmospheric stratification, and cyclone structure. The variations of turbulence intensities with the mean wind speeds at ZT and ST in typhoon Hagupit were shown in Figures 8(a) and 9(a), respectively. It is noted that the turbulence intensities increase slightly with the mean wind speeds at ZT, which is inconsistent with other publications state that turbulence intensities decrease with the mean wind speeds and remain a constant at high wind speeds, similar to Figure 9(a). This may be attributed to the sea surface roughness changing with wind speeds. The sea surface roughness will reach an equilibrium state at high wind speeds and beyond that the surface roughness does not increase with wind speeds; however, the critical wind speed is very high. Lower than the critical wind speed, the roughness increases with wind speeds.

Variation of turbulence intensities.

Variation of turbulence intensities with mean wind speeds and time at Shajiaoxuan tower: (a) variation of
Figures 8(b) and 9(b) show the three directional turbulence intensities varying with time in ZT and ST during typhoon Hagupit, respectively. It can be seen that the turbulence intensities in the front-side eyewall region (Section A) are larger than that in the back-side eyewall region (Section B). In typhoon Maemi, Cao et al. 7 also found that the turbulence intensities in easterly wind (front-side eyewall region) are larger than that in westerly wind (back-side eyewall region). When wind speeds are larger than 30 m/s for vane anemometers and 40 m/s for sonic anemometers, the difference becomes insignificant. In the three hurricanes, similar trend was also noted in all nine towers at 10 m height except T0 in Wilma. This phenomenon needs further investigation based on more field measure data.
A detailed comparison of turbulence intensities in typhoons and hurricanes is given in Table 5. Turbulence intensities have minimal dependence on averaging time once above 5 min. 14 Hence, the turbulence intensity in hurricanes based on 15 min average interval can be compared with those in typhoons based on 10 min average interval. The average values of the three components of turbulence intensities measured in ZT are 0.10, 0.09, and 0.05 (Iu:Iv:Iw = 1:0.90:0.50), which are similar to the results (Iu = 0.11) at 59.4 m height reported by Choi. 8 The average values from propeller anemometer and HD2003 sonic anemometer at 11 m height at ST on onshore winds are 0.12, 0.09, and 0.03 (Iu:Iv:Iw = 1:0.75:0.25), which are less than the results (Iu = 0.17) at 12.8 m height reported by Choi. 8 The average values from propeller anemometer and HD2003 sonic anemometer at 11 m height at ST on offshore winds are 0.17, 0.14, and 0.05 (Iu:Iv:Iw = 1:0.82:0.29).
Comparison of turbulence intensities in typhoons and hurricanes.

In the three hurricanes, according to the roughness length, all towers were divided into two types. The average turbulence intensities for the first group with roughness lengths in the range of 1 to 3 cm are 0.17, 0.12, and 0.07 (Iu:Iv:Iw = 1:0.71:0.41) which are similar to that in offshore wind at ST, and 0.23, 0.18, and 0.10 (Iu:Iv:Iw = 1:0.78:0.43) for second group with the roughness length of the order of 13.3 cm.
The ratio among the three directional turbulence intensities measured with propeller anemometer or vane is higher than those measured with sonic anemometers; the reason may be ascribed to the limited frequency response of the mechanic anemometer, which leads to partial filtering of the higher frequencies of velocity components and overestimates the lateral turbulence intensities due to the wind direction change associate with the calculation of lateral wind speeds. 33
Turbulence integral scale
Turbulence integral scale is a measure of the average size of turbulent eddies in the flow. It is significantly influenced by the length and stationarity of the specimens and the calculation method.34–36 Turbulence integral scales vary greatly in the ABL. In this article, the turbulence integral scales are calculated by integrating the autocorrelation function

where
Figure 10(a) and (b) shows the relationship between the three directional turbulence scales and mean wind speeds and standard deviations of fluctuating velocity at ZT. It is noted that the three turbulence integral scale components increase with mean wind speeds but deviate. The turbulence integral scales increase linearly with standard deviations. Figure 11(a) and (b) shows the relationship between the three directional turbulence integral scales with mean wind speeds and standard deviations of velocity fluctuations at ST. Similar trends were also presented in typhoon Maemi. At ST, the turbulence integral scales in offshore winds are less than those in onshore wind; it can be attributed to the surface friction leading to small eddies.

Turbulence integral scale at Zhizai tower in typhoon Hagupit: (a) variation of integral scales with mean wind speeds and (b) variation of integral scales with standard deviations.

Turbulence integral scale at Shajiaoxuan tower in typhoon Hagupit: (a) variation of integral scales with wind speeds at 5 m height, (b) variation of integral scales with standard deviations at 5 m height, (c) variation of integral scales with wind speeds at 11 m height, and (d) variation of integral scales with standard deviations at 11 m height.
The average values of the three directional turbulence scales
Comparison of the turbulence integral scales in typhoons and hurricanes.

According to AIJ-RLB-2004 and ASCE7-10, the longitudinal turbulence integral scale can be estimated by the following formulas, respectively


Taking equation (7) with z equal to 60 m for ZT, 5 and 11 m for ST, 5 and 10 m for the three hurricanes, one can get Lu equaling to 141.4, 40.8, and 60.6, 40.8, and 57.7 m, respectively. They are less than the measurements. Taking equation (8) with
Gust factor and peak factor
Gust factor

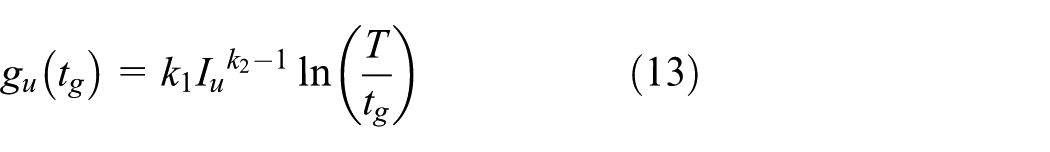
where tg is the gust duration (tg = 3 s in this article);
The relationship between gust factor and turbulence intensity in typhoons has been suggested in linear35,38 and non-linear relationships, 13 which are based on the typical formulas suggested separately by Ishizaki 9 and Choi, 39 and can be combined into one equation as following

where Ishizaki suggested
Peak factor is the ratio of the maximum wind speed fluctuation in a duration tg to the standard deviation of the fluctuate wind speeds in the corresponding 10 min time scale, that is

From equation (11), one can get

Substitute equations (10) into (12), one can get
Figures 12(a) and 13(a) show the variation of gust factors with mean wind speeds at ZT and ST in typhoon Hagupit, respectively. It is noted that the relationship between gust factors and mean wind speeds are insignificant. At ZT, gust factors in front-side eyewall region are greater than that in back-side eyewall region at same wind speed, which is also noted in typhoon Maemi as the gust factor in easterly winds is greater than in westerly winds. Figure 12(b) shows the variation of gust factors with gust averaging times at ZT. It is interesting to see that the gust factors vary approximately linear with the gust durations in semi-logarithmic scale, and it is irrelevant to wind speeds.

Gust factor at Zhizai tower in typhoon Hagupit: (a) variation of gust factors with mean wind speeds, (b) variation of gust factors with gust duration times, and (c) relationship between gust factors and turbulence intensities.

Gust factor at Shajiaoxuan tower in typhoon Hagupit: (a) variation of gust factors with mean wind speeds and (b) relationship between gust factors and turbulence intensities at 11 m height.
Average values of the gust factors are presented in Table 7. The mean value of the longitudinal gust factors is 1.29 in the front-side eyewall region and 1.20 in the back-side eyewall region at ZT, which is close to the recommended value of 1.23 by Harper et al. 40 over at-sea exposure at 10 m height. At ST, the mean value of the longitudinal gust factors is 1.42 in offshore winds, which is a little less than the recommended value 1.52 by Harper et al. 40 over off-land exposure at 10 m height and 1.65 by Krayer and Marshall, 41 and is 1.25 in onshore winds at 11 m height that is accorded with the value over at-sea exposure reported by Harper et al. 40 During typhoon Maemi, the average value of the longitudinal gust factors is 1.60. For the three hurricanes, the average value of the longitudinal gust factors with roughness length between 1 and 3 cm is 1.52 which is same as the recommended value by Harper et al., 40 and 1.70 for those datasets with roughness length between 9 and 18.99 cm.
Comparison of gust factors and peak factors in typhoons and hurricanes.
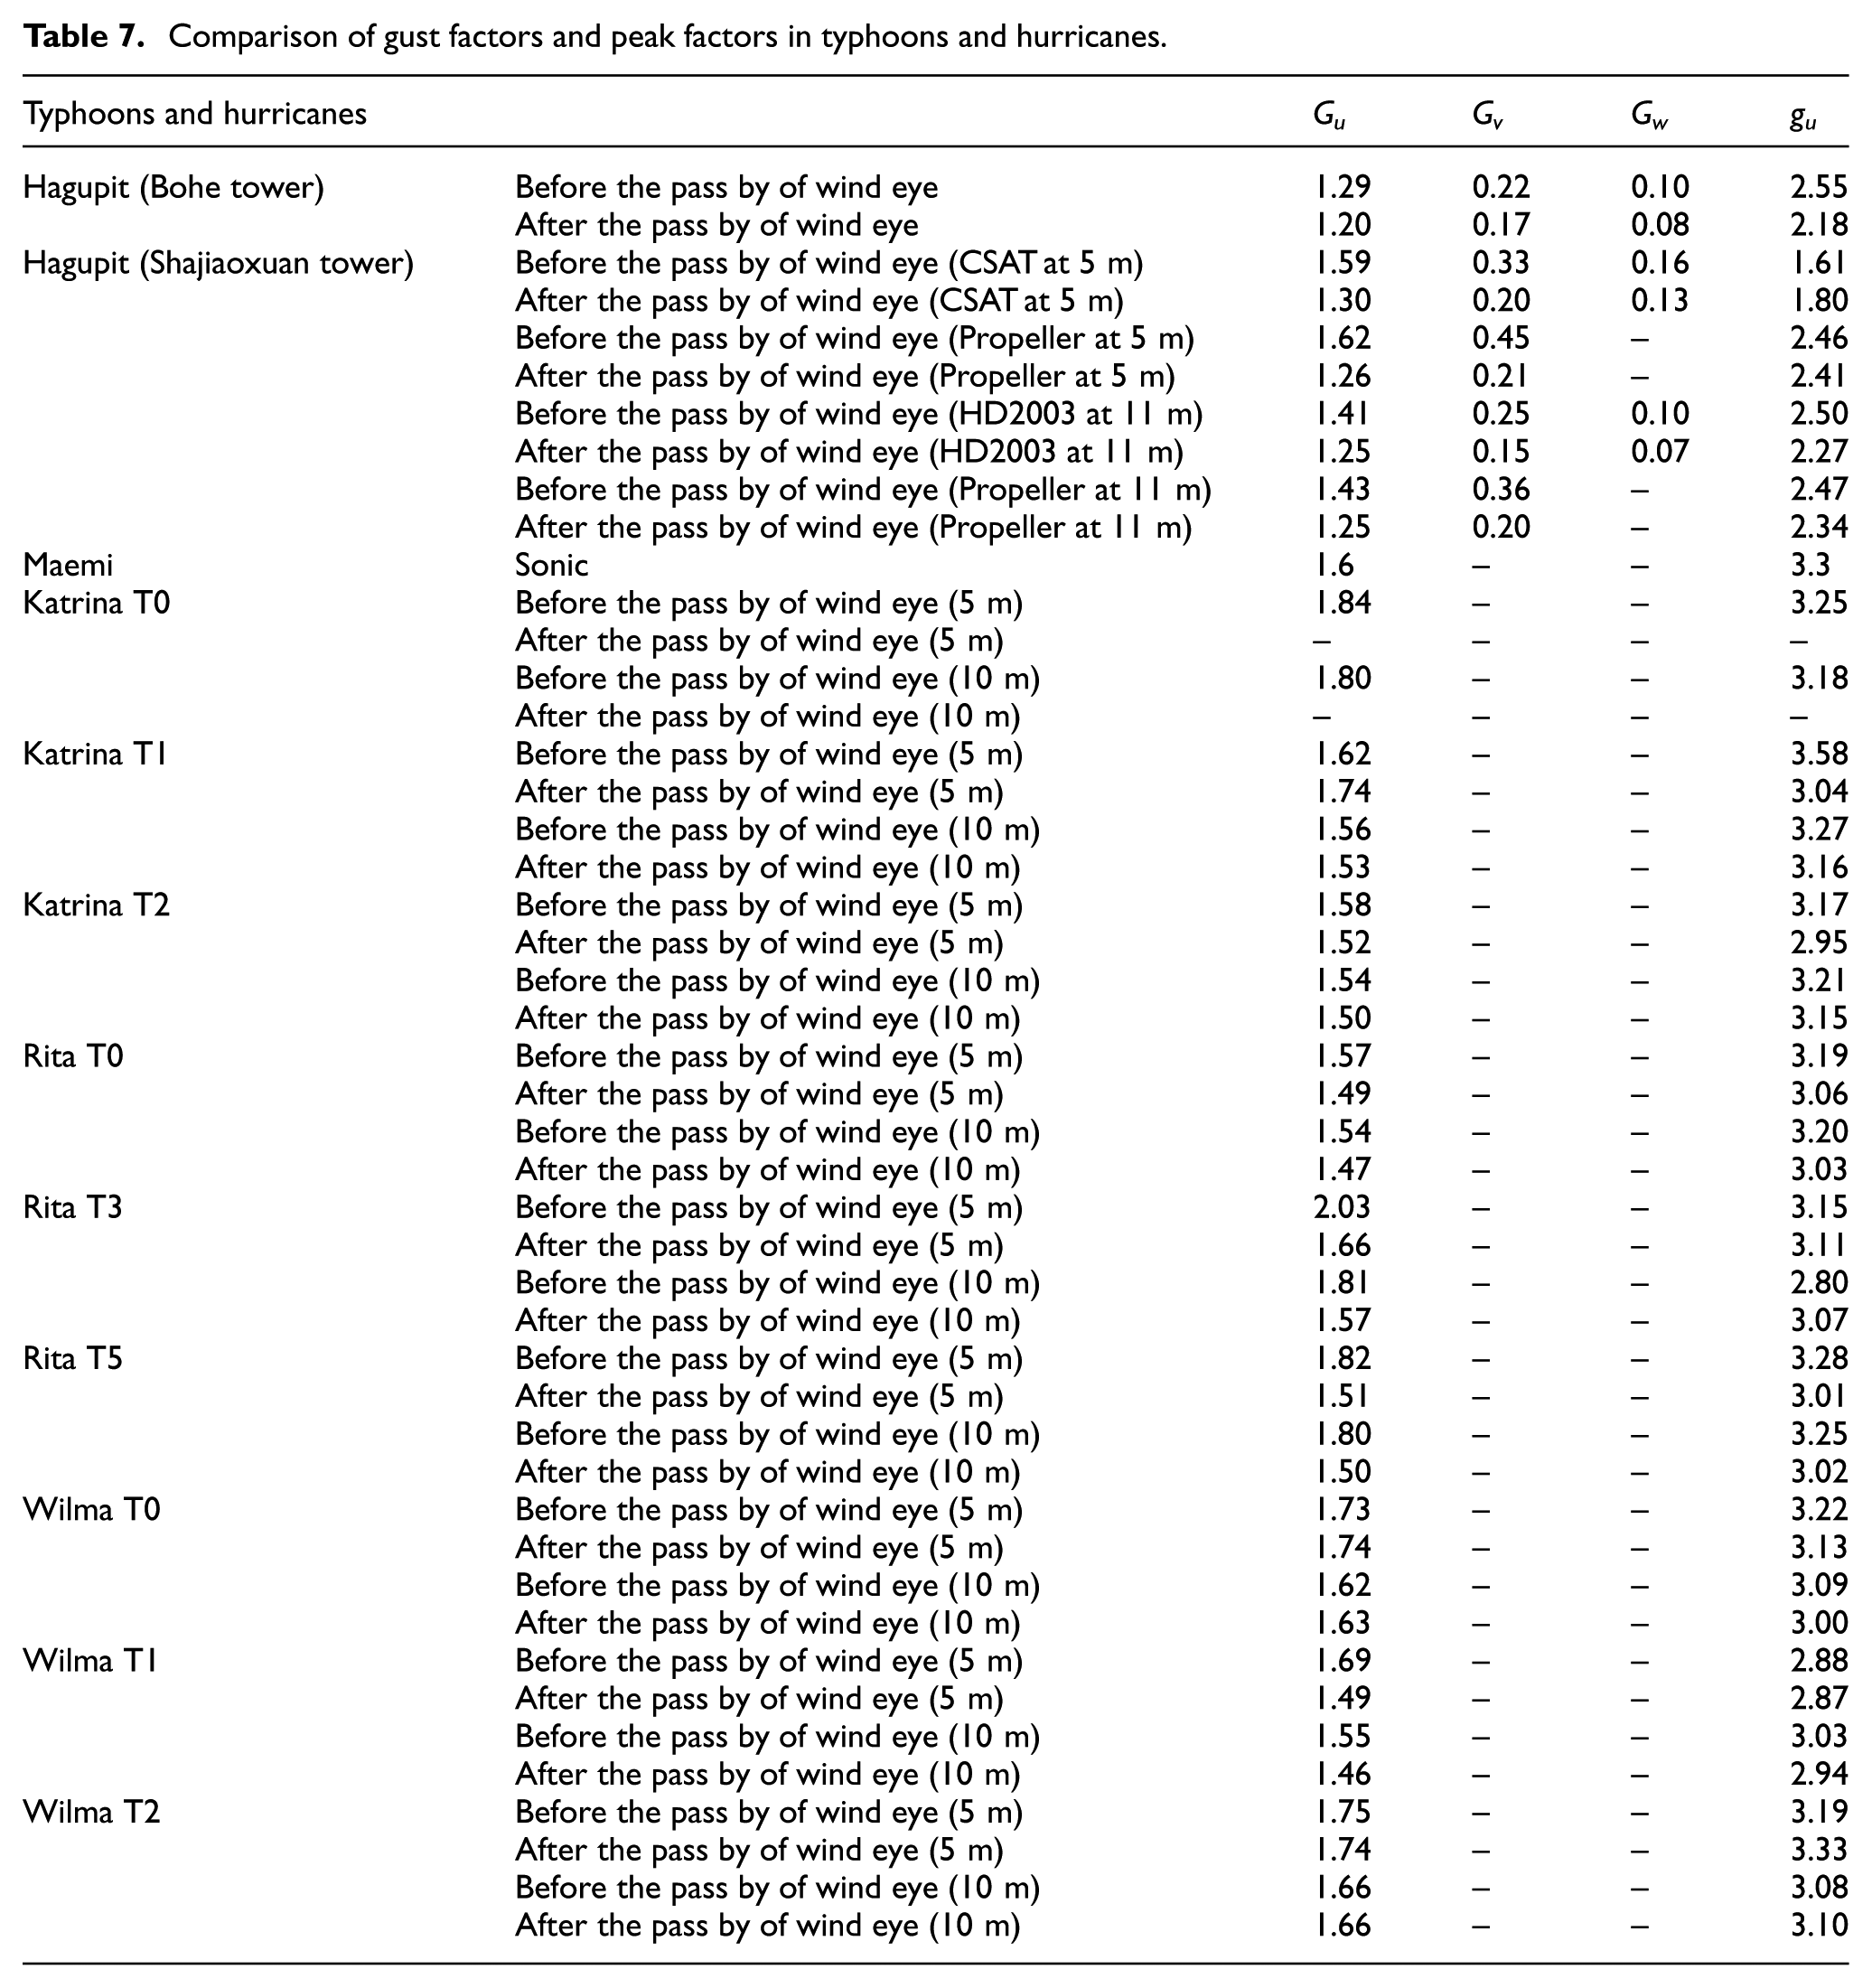
Figures 12(c) and 13(b) show the dependence of the gust factors on turbulence intensities, with the empirical expressions of Ishizaki and Choi shown together. At the two towers, Ishizaki’s formula overestimates the gust factors and the Choi’s formula underestimates the gust factors. The relationship between gust factors and turbulence intensities based on field measurements normally lies into the interval between Ishizaki’s and Choi’s equation. Table 8 shows the three parameters

Parameters for gust factors and turbulence intensities.

Figures 14(a) and 15(a) show the variation of the peak factors with mean wind speeds at ZT and ST, respectively. Peak factors keep almost constant with mean wind speeds. The mean values of the peak factors are listed in Table 7. Figures 14(b) and 15(b) show the relationship between peak factors and turbulence intensities, together with equation (16). It is noted that equation (16) has a good estimation of peak factor.

Peak factor at Zhizai tower in typhoon Hagupit: (a) variation of peak factors with mean wind speeds and (b) relationship between peak factors and turbulence intensities.
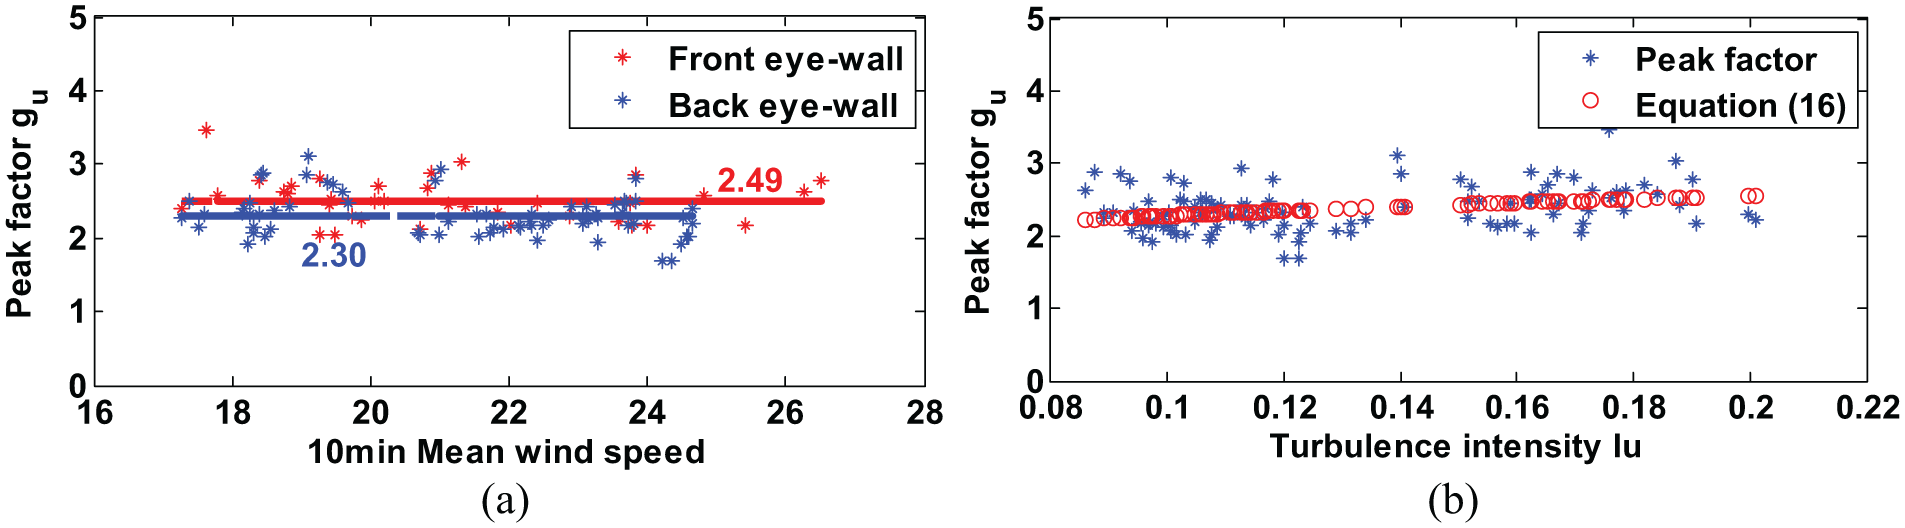
Peak factor at 11 m height at Shajiaoxuan tower in typhoon Hagupit: (a) variation of peak factors with mean wind speeds and (b) relationship between peak factors and turbulence intensities.
A 3-s gust wind can be expressed as

If the probability distribution of the fluctuate winds follows normal distribution, the exceedance probability of tg gust wind is

Then peak factor will be

Considering
The average values of peak factors are 2.37 and 2.40 for ZT and ST at 11 m height, respectively. The peak factor in typhoon Maemi is 3.3, which is larger than the value in typhoon Hagupit. For the three hurricanes, the 3-s peak factors at 10 m height are 3.13 for those datasets with roughness length between 1 and 3 cm, and 3.10 for those datasets with roughness length between 9 and 18.99 cm, both are higher than the value estimated from equation (18).
Concluding remarks
Based on the field measured wind data in typhoon Hagupit, and typhoon Maemi and three hurricanes (Katrina, Rita, and Wilma) in literatures, a comparative investigation on wind characteristics was conducted and the following results were concluded:
Wind attack angles are about −1∼7° in typhoon Hagupit over sea surface, and they are in the front-side eyewall region greater than that in back-side eyewall region.
The average values of the turbulence ratios in typhoon Hagupit are 3.15, 2.42, and 1.24 for u, v, and w, respectively; they are 2.50, 2.10, and 1.40 in typhoon Maemi, and 3.09, 2.36, and 1.29 in the three hurricanes for u, v, and w, respectively.
The drag coefficients decrease with mean wind speed gradually with the wind speeds greater than 22.45 m/s in typhoon Hagupit over sea surface, which is 33 m/s in hurricanes.
Turbulence intensities in front-side eyewall region are greater than those in back-side eyewall region over same underlying surface both in typhoons and hurricanes. Turbulence intensities vary slightly at high wind speeds.
The mean ratio of the longitudinal integral scale and lateral integral scale
The gust factor is 1.25 at ZT over sea surface. At Shajiaoxuan station, the gust factor is 1.42 in offshore winds and 1.25 in onshore winds at 11 m height. In typhoon Maemi, the gust factor is 1.60. For the three hurricanes, the average value of gust factors is 1.52 for those datasets with roughness length between 1 and 3 cm, and 1.70 for those datasets with roughness length between 9 and 18.99 cm.
The average values of the 3-s peak factors are 2.37 at ZT at 60 m height and 2.40 at ST at 11 m height, respectively. The peak factor in typhoon Maemi is 3.3. For the three hurricanes, the 3-s peak factor is 3.12 at 10 m height.
Footnotes
Handling Editor: Hongyan Ma
Declaration of conflicting interests
The author(s) declared no potential conflicts of interest with respect to the research, authorship, and/or publication of this article.
Funding
The author(s) disclosed receipt of the following financial support for the research, authorship, and/or publication of this article: The work described in this paper was supported in part by a grant from the National Natural Science Foundation of China (Project No. 51778373), the Natural Science Foundation of Guangdong Province (Grant No. 2017A030313286), Shenzhen Knowledge Innovation Plan Project (Grant Nos. JCYJ20170302143625006 and JCYJ20170818102511790), and New Teacher Research Start-Up Project of Shenzhen University (Grant No. 2016066).