
Abstract
An extensive experimental and numerical research was undertaken to study the vibration serviceability of a long-span fanshaped prestressed concrete floor system to be used in the lounge of a major airport. Specifically heel-drop and jumping impact tests were conducted to obtain the natural frequencies and modal damping ratios of the floor system, followed by the discussion on the distribution of peak accelerations. Running tests and simulation were also performed to capture the acceleration responses. Moreover, the finite element method was used to evaluate the dynamic characteristics. The floor system is found to have a low fundamental frequency (≈6.00 Hz) and the corresponding modal damping ratio (average ≈2.20%). The comparison of the experimental results with the published American institute of steel construction (AISC) design guide indicates that the prestressed concrete floor system exhibits satisfactory vibration perceptibility overall. The study results also show that the intensity and the location of impact excitation have a significant influence on the rate of acceleration decay. A crest factor βrp is proposed based on the test results to calculate the maximum root mean square acceleration for running for convenience.
Keywords
Introduction
In recent years, light-weight and long-span floor system, such as the prestressed concrete (PC) floor,1,2 prestressed cable reinforced concrete (RC) truss floor, 3 multifunctional slab system,4,5 composite floor system using cellular beams, 6 hybrid composite floor, 7 cross-laminated-timber floors, 8 and cable supported beam structure-concrete slab composite floor, 9 is a basic component of the infrastructure. In recent years, large-span floors have been widely applied in airports, which have played an important role as a kind of transportation structures. Due to lower vertical frequency, lighter mass, and smaller damping, the floor system is susceptible to the human activities 10 (such as walking, running, and jumping), and vibration serviceability problem may arise if an excessive vibration is beyond a certain limit, resulting in discomfort and even psychological fear to occupants. 11 Consequently, the cost aiming to prevent the functionality of the floor system to be compromised by potential vibrations and maintaining the floor system would be high. 1 An overall research on capturing vibration performance of the long-span floor system is therefore aided for the aforementioned phenomenon.
Predicting vibrations caused by human activities on various floor systems has been concerned by researchers through a mix of experimental,12–15 analytical,16–18 and numerical techniques.19–23 To the end, various vibration acceptability criteria have been developed by referring a good amount of related research work, such as Hivoss guideline, 24 American institute of steel construction (AISC) Design Guide #11, 25 ISO 10137, 26 GB 50010-2010, 27 and JGJ 3-2010. 28 In reviewing these design specifications, they propose limit value of fundamental frequency, damping ratio, and acceleration to check the vibration serviceability of the floor system.
This article discusses the vibration serviceability of a long-span fanshaped PC floor slab intended to be used in an airport lounge in Chongqing, China, based on the field test and numerical simulation. Specifically, the impact tests of heel-drop and jumping were conducted to capture the PC floor’s natural frequencies and damping ratios, followed by the discussion of the distribution of peak accelerations. Running tests were also performed to capture the vertical acceleration responses, and parameter analysis (damping ratio and running rate) was carried out. The objectives of this research are summarized as follows:
Analyze the acceleration–time relationship under heel-drop, jumping, and running impacts and evaluate the vibration serviceability of the fanshaped PC floor;
Compare the important vibration parameters of the peak acceleration, the fundamental frequency, damping ratio, and the mode shapes with that of the published AISC design guide;
Use the finite element (FE) method to evaluate the dynamic characteristics;
Propose the crest factor βrp to calculate the maximum root mean square (RMS) acceleration for running.
Description of the fanshaped PC floor and experimental design
The recently built fanshaped PC floor is located at T3 terminal building of Chongqing Jiangbei Airport, intending to be an airport lounge. The structure arrangement of the fanshaped PC floor and detailed cross-sections of supporting beams and columns are indicated in Figure 1. The thickness of concrete slab is 120 mm, and the elastic modulus E of the concrete is 3.25 × 10⁴ MPa determined by concrete test block (size: 150 mm × 150 mm × 150 mm). The floor was completed prior to the installation of any nonstructural component such as ceiling, vent pipe, mechanical equipment, and partition, since the nonstructural component will increase the damping ratio and decrease the natural frequency and acceleration amplitude.

Outline of the fanshaped PC floor (all dimensions in mm): (a) overall floor layout and measuring points, (b) beam cross-sections, (c) Column 1 (C1), (d) Column 2 (C2), (e) Column 3 (C3), and (f) Column 4 (C4).
The measurement system consists of seven accelerometers DH610V with the acceleration capability of ±5 g (g being the gravitational acceleration) and a data acquisition system DH5922N. The data acquisition system was used to sample all the results collected from these accelerometers at frequencies as high as 1000 Hz. Figure 1(a) indicates the schematic locations of these accelerometers Ai (i = 1–7) along with the coordinate system used subsequently to facilitate the characterization of the measurements.
To better understand the importance of various system parameters, experimental tests and numerical simulation considering two kinds of transient impacts, and running tests were conducted.
Impact test
To determine the vibration performance of the fanshaped PC floor caused by the transient excitation, heel-drop and jumping tests were conducted. The impact tests were carried out by a person weighted at 70 kg (Nm1, height 173 cm) and at the successive locations of A3 to A7 (Figure 1). The volunteer performed three impact tests at each location to minimize the test randomness.
The heel-drop impact is composed of a series of human movements as suggested by the AISC Design Guide #11. In performing a heel-drop test, the person lifted his heels approximately 80 mm off the floor, forcefully impacted the slab with his own weight with both heels, while carefully avoided multiple strikes, bouncing, or rocking, as shown in Figure 2.
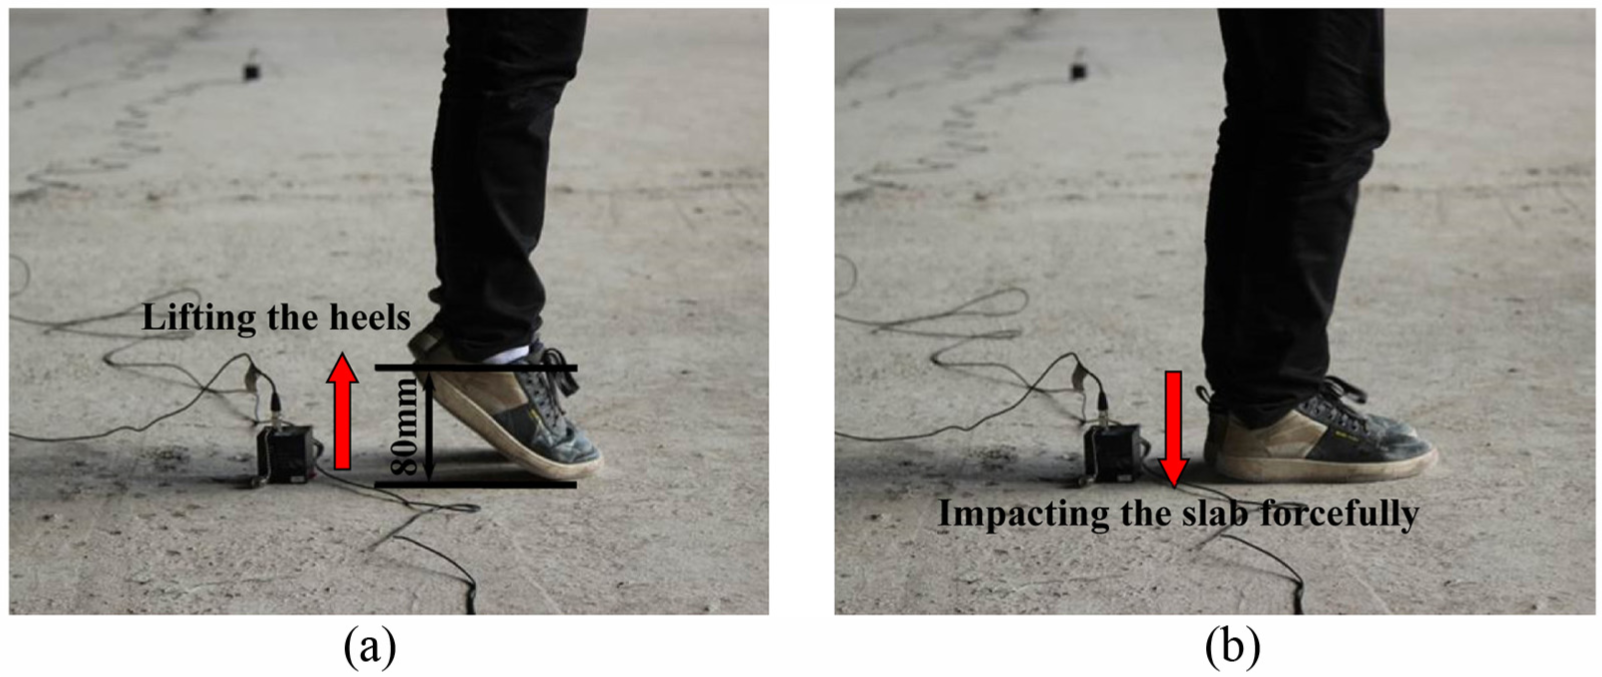
Heel-drop impact test: (a) lifting the heels approximately 80 mm and (b) forcefully impacting the slab with both heels.
The jumping test was conducted by a person in such way: bend both knees, push against the ground with both feet, jump quickly into the air, and drop down to the floor, as illustrated in Figure 3.

Jumping impact test: (a) moving quickly upward into the air and (b) dropping onto the floor.
Acceleration response
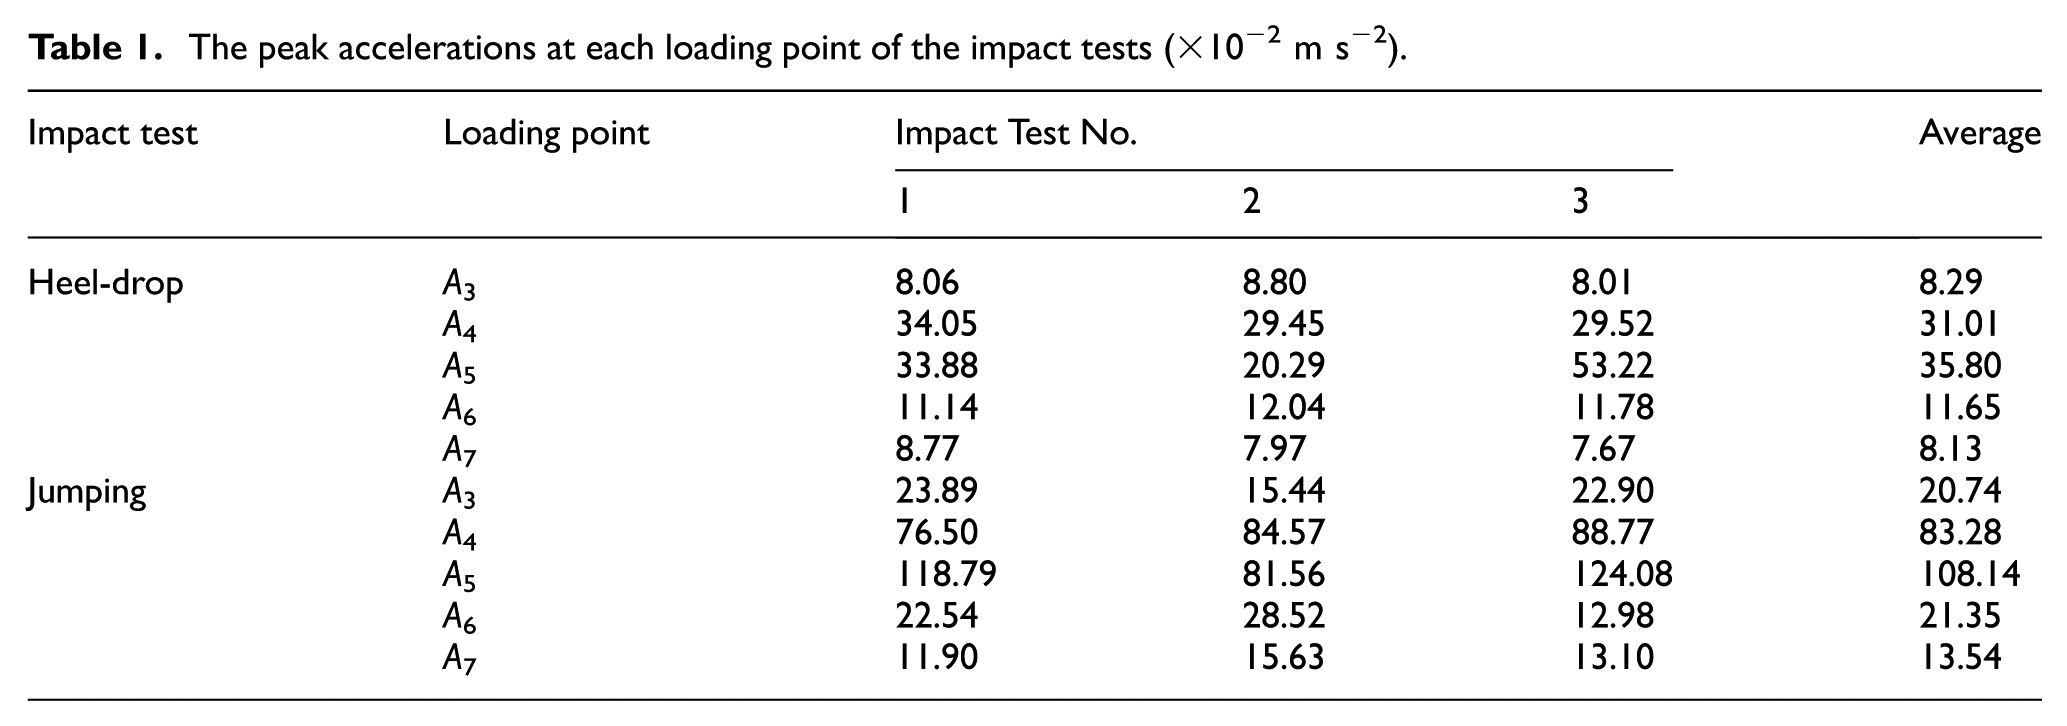
The accelerations at each measuring point were measured from the impact tests. The typical acceleration–time responses are shown in Figure 4. The peak accelerations at each loading point are listed in Table 1. As indicated in Table 1, the average peak acceleration at A4 or A5 (Figure 1) is apparently larger than that at other loading points. So, incentive points A4 and A5 are unfavorable incentive points for the PC floor vibration. The absolute maximum average peak acceleration is 35.80 × 10⁻² m s−2 (=3.65%g) for the heel-drop tests and 108.14 × 10⁻² m s−2 (=11.03%g) for the jumping tests, both occurring at A5.

Typical acceleration–time responses: (a) heel-drop and (b) jumping.
The peak accelerations at each loading point of the impact tests (×10−2 m s−2).
The ratio αhj of the average peak acceleration at each loading point induced by jumping and heel-drop is listed in Table 2. Meanwhile, the ratio αhj for other PC floor in the previous research papers1,14,18,29 is shown in Figure 5. It demonstrates that the ratio αhj is a physical quantity related to the fundamental frequency f1 of the PC floor.
Values of the ratio αhj.

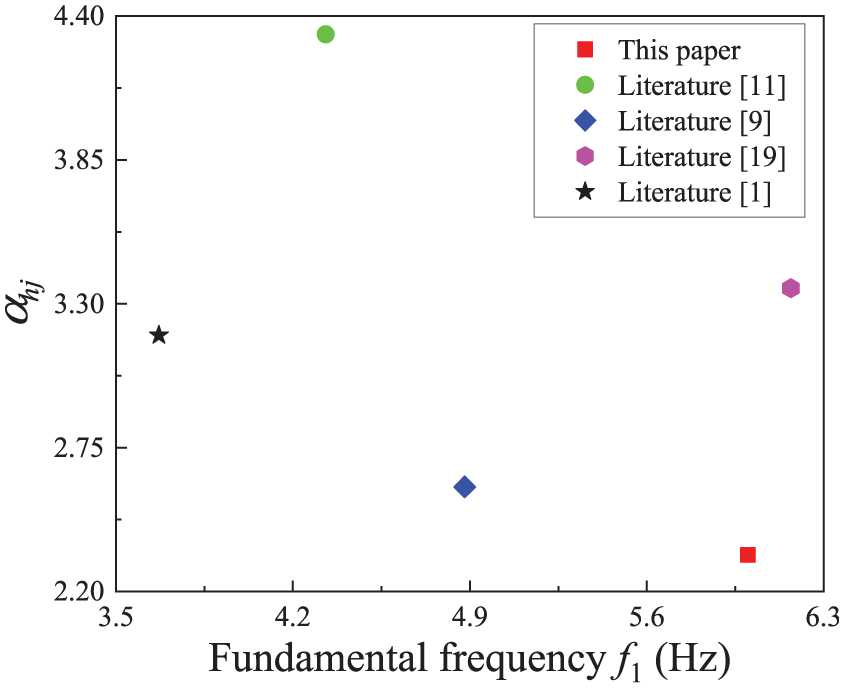
The ratio αhj for different fundamental frequency f1 of PC floor.
The distribution of peak accelerations shown in Figure 6 is used to study the vibration behavior of the whole floor, where the ordinate represents the ratio of aPi / aIj (aPi and aIj being, respectively, the peak accelerations at the measuring locations Ai (i = 1–7) and loading points Aj (j = 3–7)). As shown, the ratio ranges from 0 and 1 with the maximum value occurring at the loading points Ai (i = 3–7). Figure 6 also demonstrates that the intensity and the location of impact excitation have a significant influence on the rate of acceleration decay. For instance, for the heel-drop impact tests, the peak acceleration ratio is 62.79% at measuring point A4 when the loading is applied at A3 (aI3 = 8.29 × 10⁻² m s−2) and 18.23% at measuring point A3 when the loading is exercised at A4 (aI4 = 31.01 × 10⁻² m s−2). The ratio at measuring point A5 corresponding to loading point A3 is 17.68% for the heel-drop test (aI4=31.01×10⁻² m s−2) and 8.70% for the jumping test (aI4=83.28×10⁻² m s−2).

The distribution of peak accelerations: (a) heel-drop and (b) jumping.
Natural frequencies
The power spectrum characterizes how the energy is passed to the floor from the impact excitation. Since resonance occurs when the frequency of excitation coincides with the natural frequency of a floor, the maximum amount of power in the frequency domain will occur at a natural frequency of the floor. Therefore, the acceleration–time responses were converted to the frequency ones using the fast Fourier transform (FFT) technique. The peaks of the acceleration–frequency plots can then be used to identify the natural frequencies of the PC floor. The power spectra are shown in Figure 7, which indicate that the first peak acceleration occurs at the fundamental natural frequency f1 of 6.00 Hz. This f1 value implies that the PC floor is relatively flexible compared to others in which f1 of 10 Hz is usually recommended for practical use. 30

Power spectra corresponding to the acceleration–response of loading point A6: (a) heel-drop and (b) jumping.
Damping ratio
Damping is an important design consideration. It is indicative of energy dissipation. Based on the collected acceleration data from the impact tests, the damping ratio ξ for a lightly damped system can be determined by 31
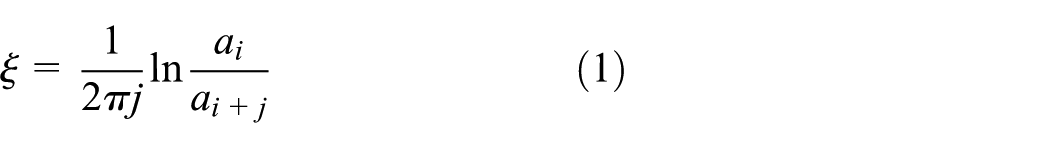
where ai and ai+j are the ith and i + jth measured peak accelerations, respectively.
The damping ratios corresponding to the first vibration mode ξ1 are listed in Table 3, which were collected from the vibration signals at each loading point Ai (i = 3–7). Average ξ1 ratios range from 1.78% to 2.40% for the heel-drop tests and from 2.02% to 2.54% for the jumping impact tests. And it shows that the damping ratio of the floor is not a constant. The respective overall average ξ1 values are 2.06% [=(1.89+1.90+2.40+1.78+2.34)/5] and 2.30% [=(2.28+2.31+2.37+2.02+2.37)/5]. ξ1 ratios obtained from the jumping impact tests are about 11.65% higher than those from the heel-drop impact tests. 14
ξ1 ratios determined from the impact tests (%).

Running test
Human response to floor vibration is a very complex matter, involving the magnitude of motion, the surrounding environment, and the human perception. A rhythm excitation could be more annoying than the infrequent or transient motion. Therefore, running tests (Figure 8) were performed to obtain the floor’s vertical acceleration response, by two persons with the representative weights of 70 kg (Nm1, height 173 cm) and 63 kg (Nm2, height 160 cm). The actual frequencies of daily running were adopted. To obtain the pace frequency, the progress of experimental tests is recorded using a video device. Based on the video data recorded from Nm1 and Nm2, the pace frequency is found to be approximately 2.90 and 2.80 Hz, respectively.

Running tests (Nm1).
Starting from location A1 (Figure 1(a)), the volunteer ran along the following route repeatedly for a duration of 5 min: A1 → A2 → … → A7 →A6 → …→ A1 → …. Figure 9 shows the typical measured accelerations and the RMS accelerations.
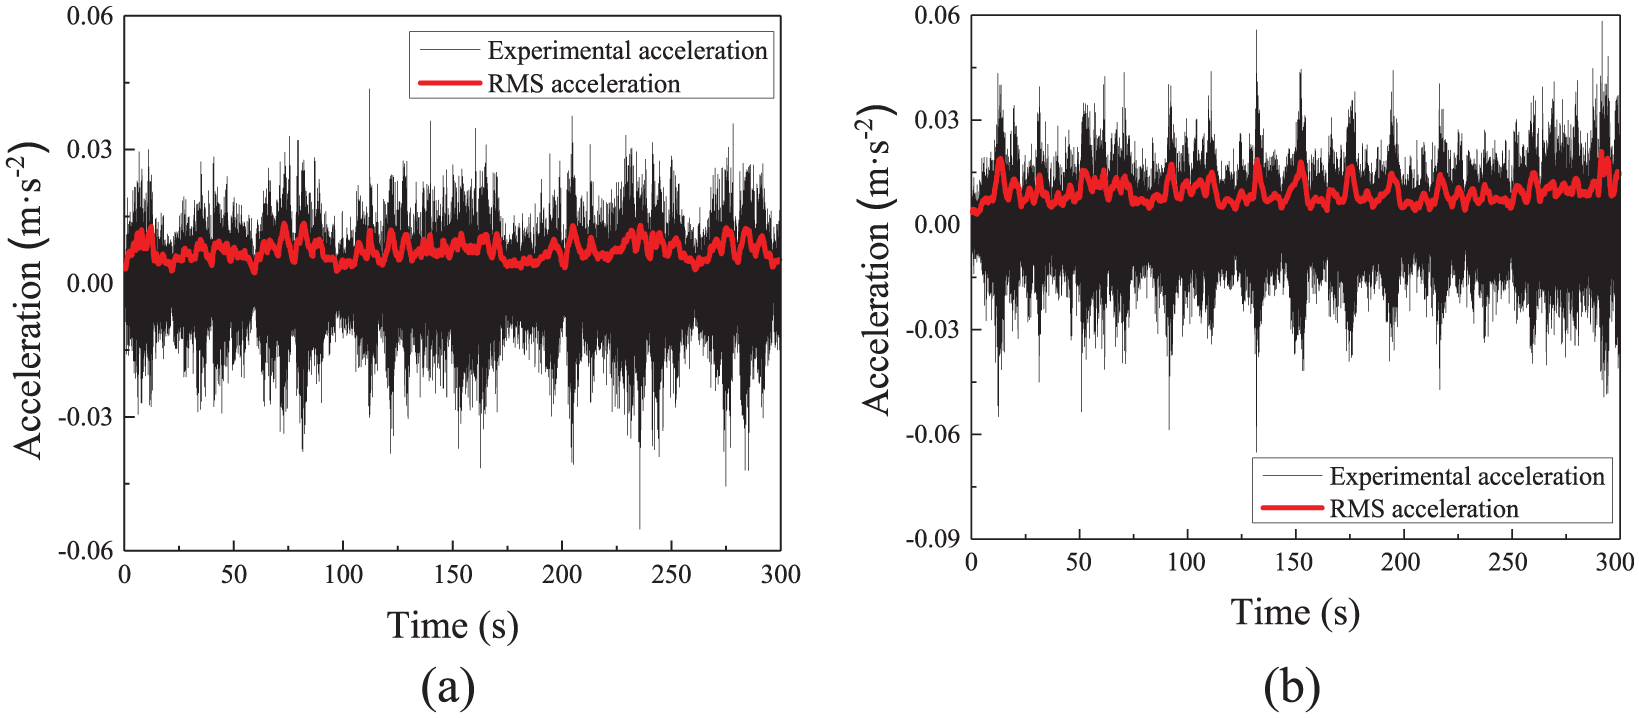
Typical acceleration responses and RMS accelerations: (a) Nm1 and (b) Nm2.
Acceleration response
The acceleration responses of the floor were evaluated in terms of RMS accelerations (equation (2)) as they give a better indication of vibration variations 31

where arms(t) is the rolling RMS acceleration at time t, N is the number of acceleration data points from (t – 1 / 2) to (t + 1 / 2) s, and ai(t) is the ith acceleration data point.
The peak and maximum RMS accelerations of the PC floor at the various measuring points due to running are listed in Table 4, which indicates the maximum RMS acceleration values of 3.27 × 10⁻² m s−2 (=0.33%g) under Nm1 and 1.81 × 10⁻² m s−2 (=0.18%g) under Nm2.
The peak and maximum RMS accelerations at each measuring points (×10−2 m s−2).
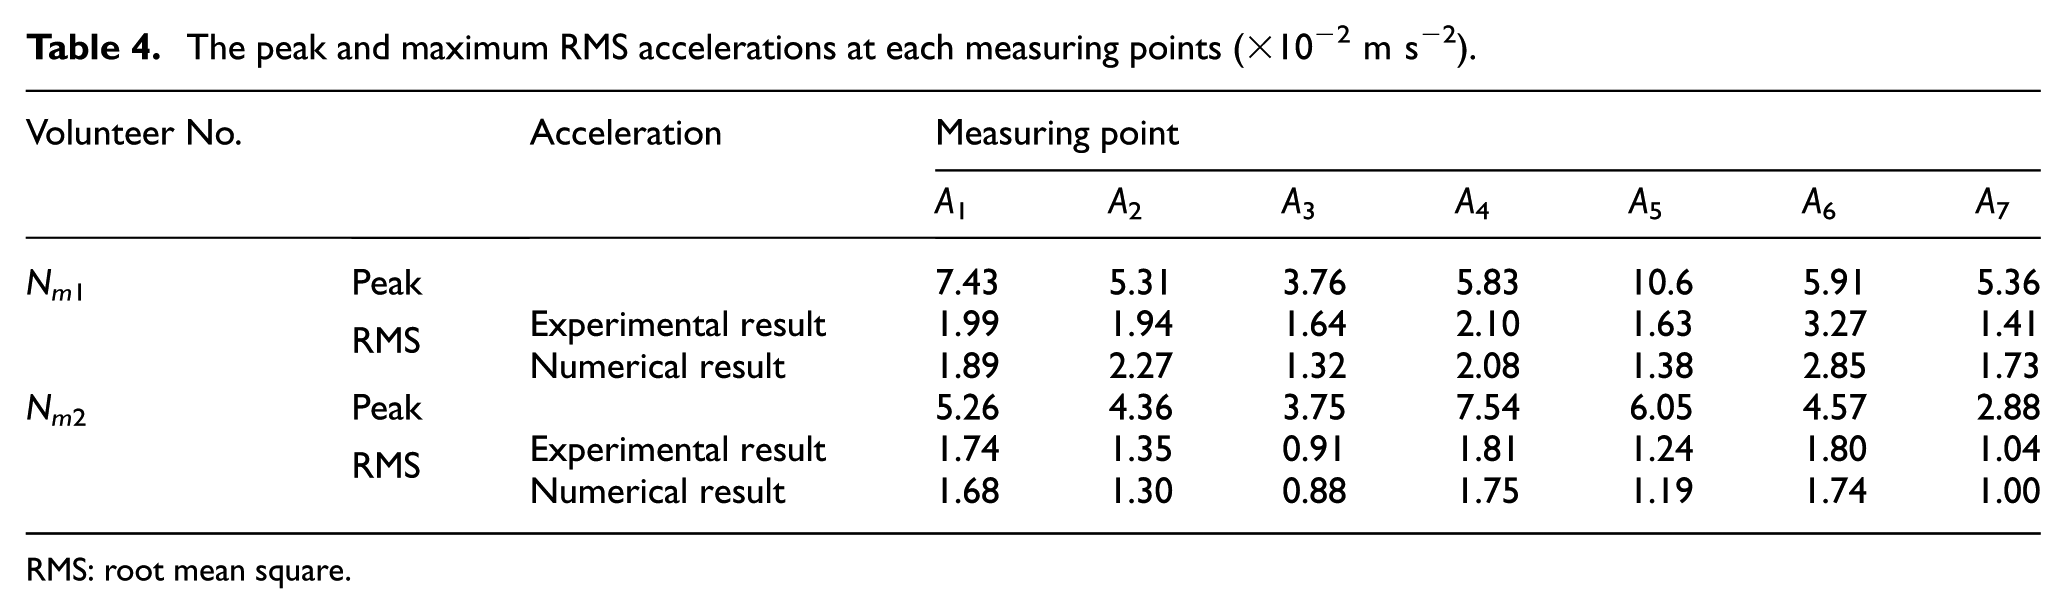
RMS: root mean square.
Crest factor βrp
RMS acceleration is usually selected as the criteria to assess the vibration serviceability. 25 The determination of RMS acceleration involves a tedious calculation process and thus inconvenient to engineers. This study proposes a crest factor βrp describing in equation (3), which can be used to calculate the RMS acceleration conveniently

Based on Grubbs’ criterion GB/T 4883-2008, 32 the average crest factor βrp under a detection level, αlev, of 0.05 can be obtained, as summarized in Table 5. The ratio for the average crest factor βrp between Nm1 and Nm2 is 0.88, very close to the ratio of the person’s weights of 0.90 (Nm2:Nm1 = 63:70). The overall average crest factor βrp coefficient is 3.14 (=(2.94 + 3.33) / 2). Despite this limited study, this concluded that βrp coefficient for running is consistent with the reported previously. 3
Crest factor βrp corresponding to the running on the PC floor system.
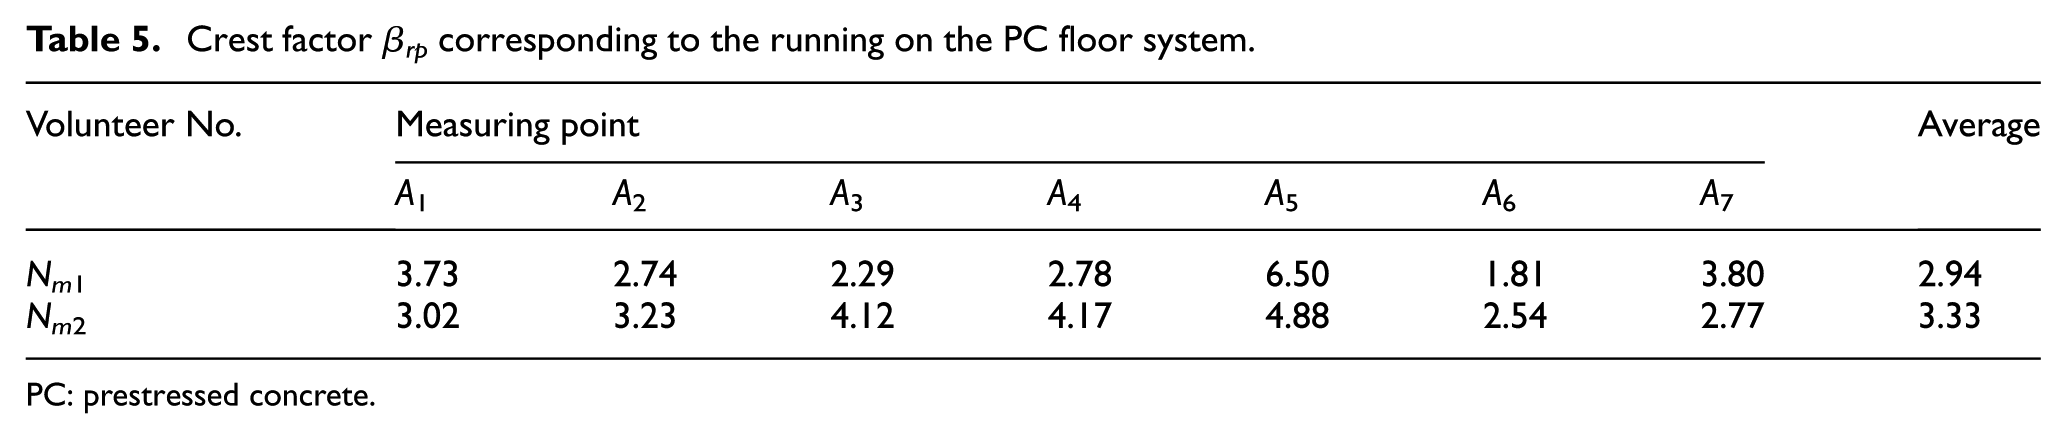
PC: prestressed concrete.
Numerical simulation
For complex structures, the dynamic characteristics can be evaluated using the FE method. Through the numerical simulations, the entire three-dimensional (3D) structural system was modeled (as shown in Figure 10), in which C3D10I (10-node general purpose tetrahedron elements with improved surface stress formulation) was adopted to analyze the dynamic performance. It should be noted that the effect of prestress was not considered in this investigation, 33 and Rayleigh damping was adopted to consider damping. The fundamental frequency differs by 2.50% between the experimental and numerical results, and thereby showing the FE mode is valid.
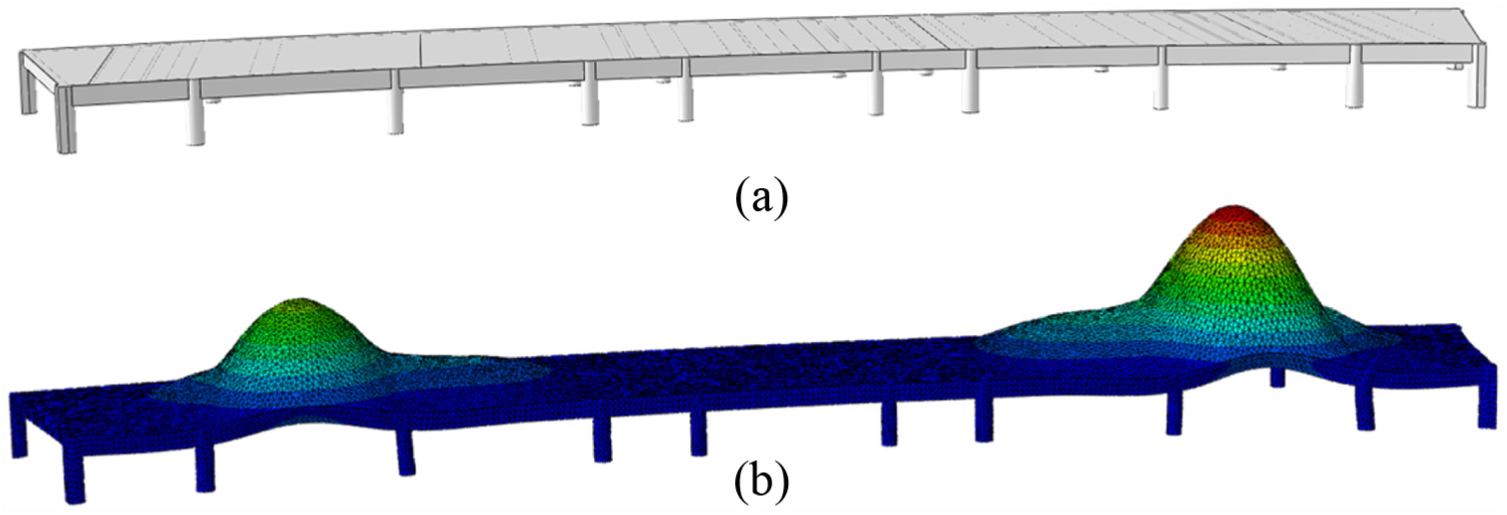
Numerical simulation using ABAQUS (C3D10I element): (a) 3D model of the fanshaped PC floor and (b) the first modal shape (f1 = 6.15 Hz).
Running function model
For discussing more parameters on the vibration serviceability of the fanshaped PC floor system, the FE simulation model in Figure 10 was using to simulate the running excitation. To conduct a numerical simulation on the floor dynamic response due to running excitation, the following function (Figure 11(a)) was used to define the running force FR(t) 34

where KR is impact factor (i.e. FRmax / G) determined by Figure 11(b) (FRmax = the peak dynamic load and G = the weight of the runner), tR is the contact duration, and TR is the period of running load.

Running forcing model: (a) running load function and (b) relationship between KR and tR / TR.
Numerical results
In this section, sensitivity studies (including damping ratios and running rates) using the FE model were conducted, as described and discussed in the following. The relationships between RMS acceleration and damping ratios and running rates are shown in Figure 12(a) and (b), respectively. It should be noted that the following RMS is calculated by equation (3), the weight G of the runner is 700 N, and the impact factor KR is 3.4.

Parameter analysis for the curves of RMS acceleration: (a) damping ratio (running rate 2 Hz) and (b) running rate (damping ratio 2.00%).
Figure 12(a) shows that the RMS accelerations at locations Ai (i = 1–7) decrease with an increasing damping ratio as expected. Figure 12(b) shows that the RMS accelerations at locations Ai (i = 1–7) are proportional to the running rates.
Comparison of vibration criteria
AISC Design Guide #11 25 summarized in Table 6 has been commonly used to evaluate the floor vibration serviceability due to human activities. Although the AISC criterion is intended to walking excitation, it is adopted in this study to assess the vibration serviceability of the PC floor system for each considered excitation for simplicity and direct comparison. The ξ1 ratios of 2.06% (heel-drop impact tests) and 2.30% (jumping impact tests) concluded from this study satisfy the AISC’s suggested value of 2.00%. The comparison of the measured response (Table 4) and numerical results due to running with the AISC Design Guide #11 reveals that all the floor’s responses are lower than the threshold values (1.5%g) for shopping malls and indoor footbridges.
Recommended damping ratios and acceleration limits based on the AISC Design Guide #11.

0.02 for floors with few nonstructural components (ceiling, ducts, partitions, etc.) as in open work area and churches; 0.03 for floors with nonstructural components and furnishings, but with only small demountable partitions, typical of many modular office areas; and 0.05 for full height partitions between floors.
Conclusion
An extensive experimental and numerical simulation research was undertaken to study the vibration serviceability of a long-span PC floor system intended to be used in the lounge of a major airport in Chongqing, a megacity in China. Heel-drop, jumping, and running tests and simulation were carried out to capture the dynamic properties of the PC floor system. Based on the study results, the following key findings are offered:
The fundamental natural frequency of the PC floor system is 6.00 Hz, indicating a relatively flexible system compared to others where the usual value of 10 Hz is recommended for practical purposes. The average modal damping ratios for the first vibration mode, ξ1, are 2.06% and 2.30% for heel-drop and jumping impacts, respectively, both satisfying the AISC Design Guide #11 suggested value of 2.00%. The damping ratios obtained from the jumping impact tests are approximately 11.65% higher than those from the heel-drop impact tests.
Locations A4 and A5 (Figure 1(a)) are deemed as the unfavorable spots in terms of the floor vibration. The maximum average peak accelerations are 35.80 × 10⁻² m s−2 (=3.65%g) from the heel-drop tests and 108.14 × 10⁻² m s−2 (=11.03%g) from the jumping tests. The intensity and the location of impact excitation have a significant influence on the rate of acceleration decay.
All obtained RMS accelerations due to running appear satisfying the Design Guide #11 criteria. The average crest factor βrp, which can be used to calculate RMS acceleration conveniently, is 3.14 for running, which is in line with that of person’s weights considered in the tests.
The RMS accelerations are inverse proportion to damping ratio and proportional to running rates.
Footnotes
Handling Editor: Lalit Borana
Declaration of conflicting interests
The author(s) declared no potential conflicts of interest with respect to the research, authorship, and/or publication of this article.
Funding
The author(s) disclosed receipt of the following financial support for the research, authorship, and/or publication of this article: The financial support is provided by the National Natural Science Foundation of China (Grant Nos 51708058, 51438001, and 51622802), Chongqing Basic and Frontier Research Project (Grant No. cstc2014jcyjys30001), and Fundamental Research Funds for the Central Universities (Grant Nos 106112014CDJZR200001 and 106112015CDJ XZ208804).