
Abstract
Dynamic response of road embankment under strong earthquake was explored by site investigation, shaking table tests, and discrete element method simulations, which shows that the distribution of responded accelerations strongly depends on the amplitude of input ground motion and the height of road embankment. When the peak ground acceleration of ground motion is small, peak ground acceleration amplification factors will linearly increase from the toe to the top of the slope; then, it will step into non-linear amplification; when the peak ground acceleration of ground motion is large enough, it will transform from amplification to attenuation. There is a logarithmic relationship between the magnitude of acceleration and the slope amplification factor, and the critical acceleration making the peak ground acceleration transform from amplification to attenuation increases with the raise of embankment height and connects with spectral characteristics of ground motion. There is a logarithmic relationship between the input ground acceleration and the amplification ratio of slope top to toe, and the critical acceleration making the peak ground acceleration transform from amplification to attenuation increases with the raise of embankment height and connects with spectral characteristics of ground motion. The results found should be useful for aseismic of road embankment as well as railway subgrade.
Keywords
Introduction
Although the strong seismic area is not suitable for construction, more and more infrastructure such as highways and railways will be or being constructed in seismic area, especially in western China with the development of society and economy. Major earthquakes (magnitude ≥ 7.0) will cause the epicenter intensity to reach IX degrees or more (peak ground acceleration (PGA) ≥ 0.4 g). Strong ground motion loads will exceed the ultimate bearing capacity of many engineering structures and cause them to fail. Studies of the damage mechanism of the subgrade engineering in the meizoseismal area will help solve the seismic damage problem of the road embankment engineering. At the same time, the road embankment is one of the major forms of roads in mountainous areas and an important part of the lifeline of transportation. Overcoming the damage of road embankment engineering will help improve the safety and reliability of the lifeline of transportation.
Performance of geotechnical structure under strong earthquake is the basis for seismic design, which has interested researchers for a long time,1–4 while the knowledge of damage mechanism of road embankment in meizoseismal area is still insufficient.
Site investigation is the most direct and effective method to obtain the seismic performance of subgrade engineering, but it will be limited by many factors, and it usually needs to be combined with laboratory tests to study its physical and mechanical mechanism.
Besides field investigation, shaking table tests have been widely used to investigate the dynamic behavior of geotechnical structure quantitatively.5–8 Previous studies show that response acceleration at the crest of the soil slope or geosynthetic-reinforced slopes will be amplified or attenuated.9,10 Lately, a logarithmic trend was plotted to depict the overall relationships between input ground acceleration ag and acceleration amplification factor Am of geosynthetic-reinforced soil structures filled by poorly graded sand, 11 which found that the crossover point between amplification and attenuation occurs at an ag of about 0.40 g. However, the proposed ag and Am relationships have not been examined extensively by other types of soil and earthquake.
This article presents a study on seismic damage of road embankment along Dujiangyan to Yingxiu highway in Wenchuan seismic area. First, field investigation was performed to find the characters of seismic damage of road embankment near epicenter. Later, large-scale shaking table tests were conducted to find the character of acceleration response and amplification under different seismic waves. Finally, damage mechanisms of embankment were analyzed by discrete element method (DEM) simulation in microscopic view.
Site investigations
Location of the road embankment investigated
After 2 days of the Wenchuan earthquake (Ms 8.0), which occurred at 12 May 2008, seismic damage of road embankment from Dujiangyan city to Yingxiu town had been investigated. This part of road was heavily compacted by granular soil when constructed, and it crossed seismic intensity area from IX to XI degree in Wenchuan earthquake, according to the Chinese seismic intensity scale (CSIS). Without being seismically designed, most of the road embankments suffered from deformation of centimeter or decimeter level, and several embankments were destroyed or even collapsed. To find damaged embankments is very important for damage analysis, especially those in a critical condition. The embankment to be analyzed locates in seismic zone of XI degree, which is the only one seriously damaged, but standing still during strong earthquake in the road. As is shown in Figure 1, it is 10.7 km from the embankment site to the epicenter, and the perpendicular distance is only 460 m to the seismogenic fault (i.e. Yingxiu to Beichuan fault), with the PGA probably more than 1.0 g during Wenchuan earthquake.

Site location of the road embankment.
Damage character of different parts of the embankment
As is shown in Figure 2, this embankment is with a height of 14 m (upper part is 8.0 m and lower part is 4.0 m), a width of 7.5 m on the top, and slopes of 1:1.5(upper part) and 1:1.75(lower part). Six layers of geogrid were embedded to the lower part of the embankment with an interval of 1 m, which functioned as reinforcement. Besides, the surface of the slope is covered with concrete panel to resist the scour of Mingjiang River below the road. The geogrid can effectively inhibit the lateral displacement of the soil around it, thereby increasing the seismic performance of the reinforced soil mass. When constructing the embankment in a strong seismic area, a certain length of geogrid can be laid horizontally near the slope surface of the embankment to suppress deformation and cracking of the slope surface. If the geogrid is laid horizontally on the base of the road embankment, the overall stability of the road embankment will be enhanced. The seismic performance analysis and optimization design method for geogrid reinforced subgrade are detailed in the literature. 12
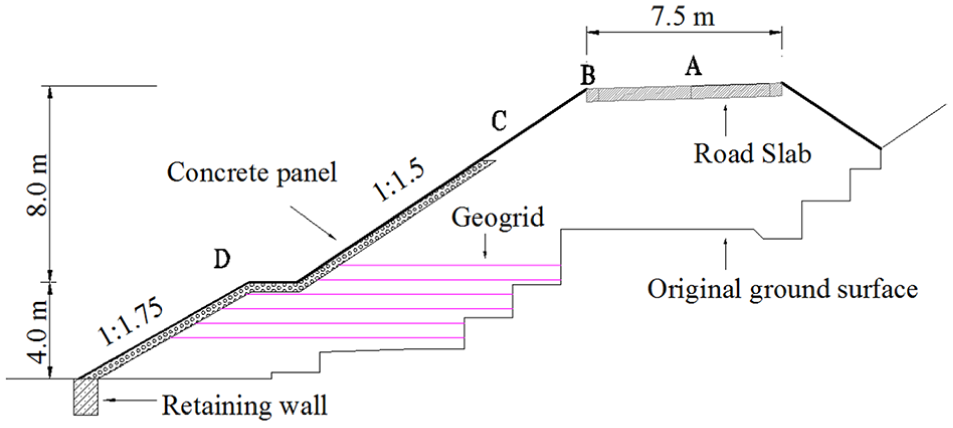
Cross section of embankment with scour design.
A large tensile crack with the maximum width of 33 cm and length of 30 m emerged on the surface of road, which tore the road slab and the road embankment below, as shown in Figure 3. Although excavating the road was not allowed, it can infer that the maximum depth of the tensile crack would be 1.0 or 1.5 m. For according to the trench exploratory of loose deposits torn by earthquake, the maximum depth of a tensile crack with a width of 20 cm is about 1.0 m. 13

Tensile crack on the road surface (corresponding to Site A of Figure 2).
Horizontal tensile cracks with the maximum width of 10 cm have also been seen on the upper part of the embankment slope covered with concrete panel, which were nearly parallel to the strike of the road (Figure 4).
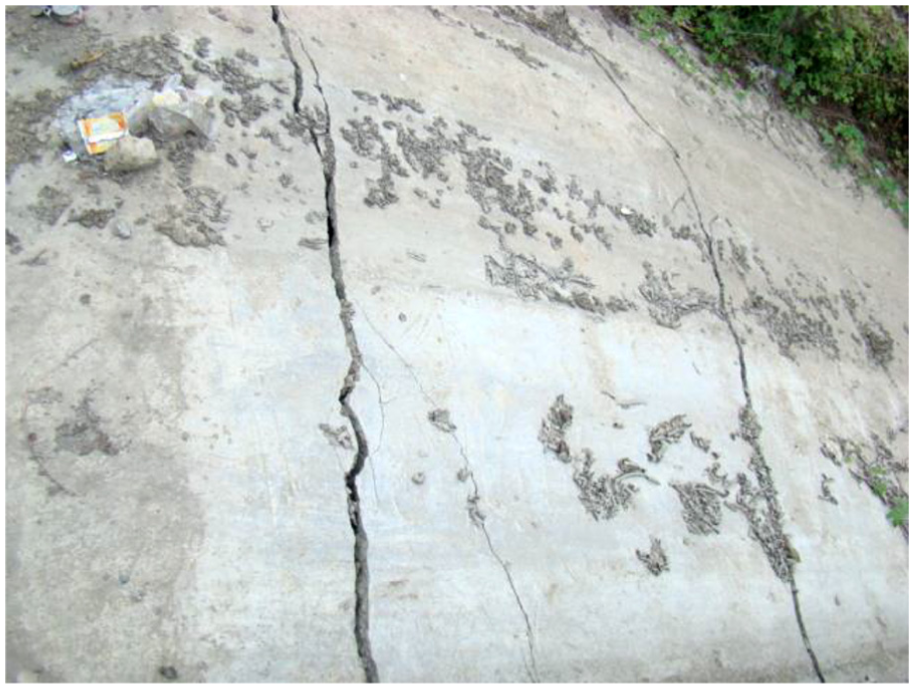
Horizontal tensile cracks on the slope (corresponding to Site C of Figure 2).
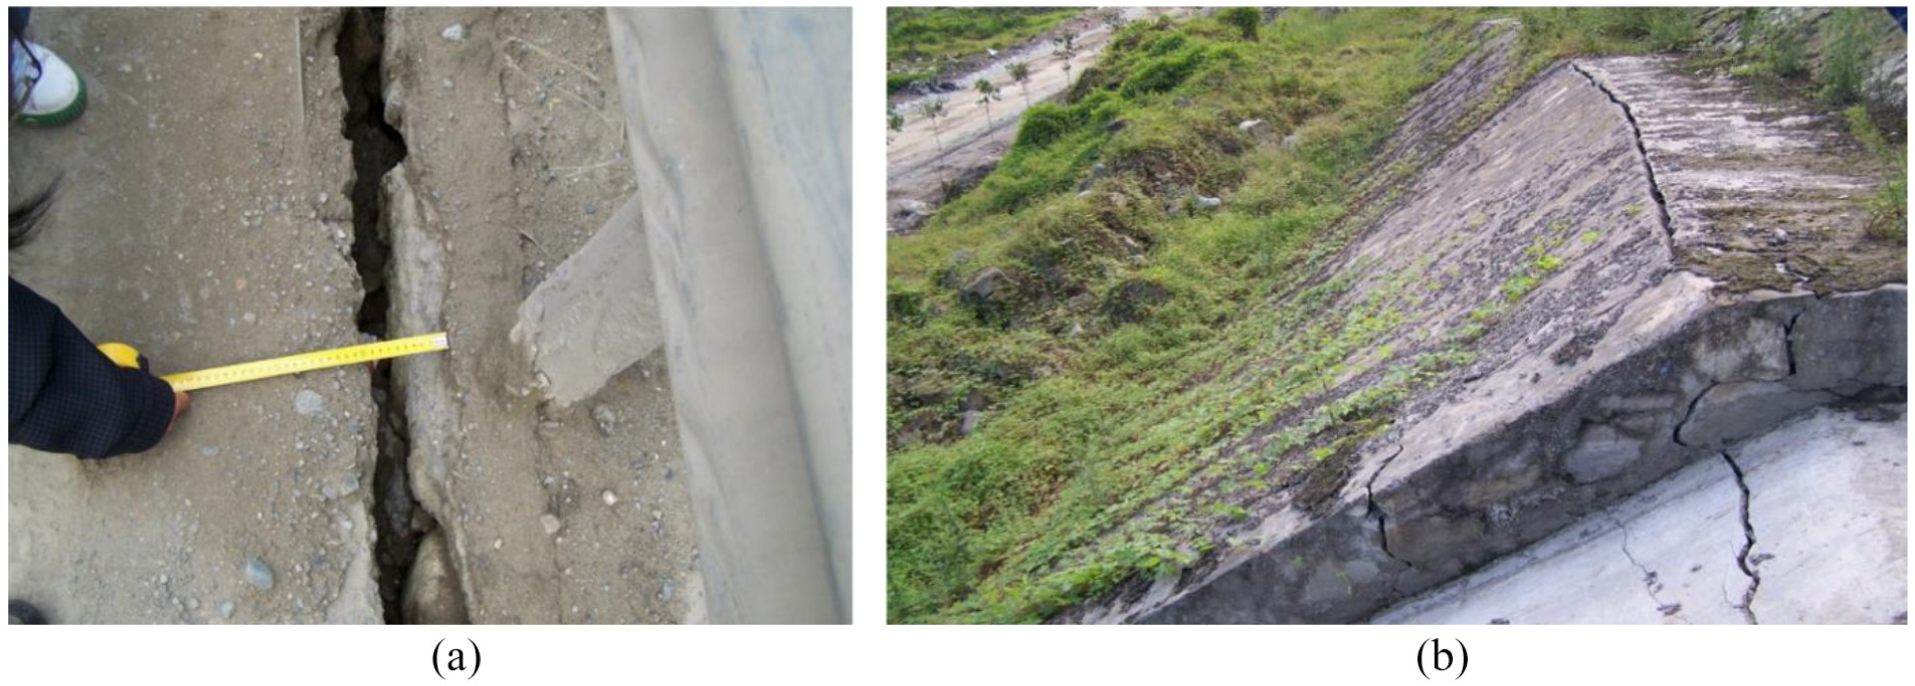
Moreover, a separation of 10 cm between the road slab and the kerbstone emerged, as shown in Figure 5(a). The lower part of the embankment was characterized by bulge deformation, which would be the results of compressing and shearing action, as shown in Figure 5(b).
Shaking table tests
Model design and material properties
For the lower part being reinforced and retained, the road embankment investigated can be simplified and generalized as a symmetrical model for shaking table tests. As shown in Figure 6(a), the layered shear deformation model box was used as the test model box, and a layer of 3-mm-thick rubber film was added on the inner wall of the model box to minimize the influence of the boundary effect of the model box. This model is 75 cm in width on the top and 80 cm in height, whose dimension is one-tenth of the prototype embankment, as shown in Figure 6(b). Soil sample was taken from the roadside investigated, which had the non-uniform coefficient as 40.9, curvature coefficient as 1.2 and could be classified as well-graded gravel (GW). After reaching the optimum moisture content of 4.0%, the soil specimen was filled by layer till the overall compactness of 0.94 being reached. The unit weight of compacted model is about 19.4 KN/m3, the friction angle of soil sample is 42.3°, and its cohesion is nearly zero. The low-frequency AC-response accelerometers AC-23 were used with the input acceleration range ±1.0 g and frequency range from 0.1 to 50 Hz, which are suitable for measuring dynamic response of geotechnical structure exited by earthquake. Six accelerometers labeled as A1 to A6 were embedded at different sites inside the model slope, with an equal vertical interval of 20 cm from A1 to A5 and A6 lies in the center of upper surface. The shaking direction is perpendicular to the strike of road embankment, which is the conventional way of 2D simulation.

(a) Shaking table facility and (b) road embankment model.
To simulate the prototype embankment in the model test, the law of similitude is applied. Iai 14 derived a similitude relation for shaking table tests on soil-structure-fluid model in 1 g gravitational field, which was applicable to the model tests mainly concerning deformation and widely used thereafter. Iai’s similitude law prescribes three independent scaling factors, that is, the geometric and density scaling factors, and the strain scaling factor derived from shear wave velocity tests in both the model and prototype soil. Although Iai’s method is based on the assumption of small strain levels (no more than 10%) and is only suitable for the status before the failure, it can also make some application to liquefaction problems involving medium to dense sands.
Based on Mohr–Coulomb failure criterion, hyperbolic model of soils and the assumption of keeping the same strain ratio (i.e. strain normalized by the reference strains), similitude for large-scale shaking table tests on soil slope model were proposed by Jiang et al. 15 Four independent factors are included in Jiang’s law, that is, the geometric (C l ) and density (Cρ) scaling factors, the lateral pressure coefficient scaling factor (Ck), and the ultimate strength scaling factor (C(τ)) derived from Coulomb’s strength law. Jiang’s law considers the similarity of dynamic behavior and the damage pattern between the prototype and model, so it can make some application to seismic damage problems including sands and clays.
The basic equations of Jiang’s law involve the constitutive law of soil and the failure criterion as follows.
First, the hyperbolic model was used to represent the stress–strain behavior of soils under earthquake. The hyperbolic equation for the backbone curve of this model can be written as follows

in which γr = τmax/Gmax is a reference strain, 16 Gmax is the low strain shear modulus and τmax is the maximum shear strength. Therefore, the corresponding modulus degradation curve is only a function of the strain ratio γ/γr.
According to the theory of nonlinear shaking, equation (1) can be expanded as three orders Maclaurin series

The low strain shear modulus is usually approximated as follows

where K is the modulus coefficient, Pa is the engineering atmospheric pressure, σ0 is the mean effective stress, and n is the modulus exponent achieved by the dynamic triaxial tests.
Then, Coulomb’s strength law is used for an isotropically consolidated soil subjected to a pure shear loading

where σv is normal compressive stress and k is the lateral pressure coefficient.
Finally, the scaling relations for the variables contributing to the dynamic response of soil slope can be deduced as shown in Table 1.
Similarity law of shaking table tests.
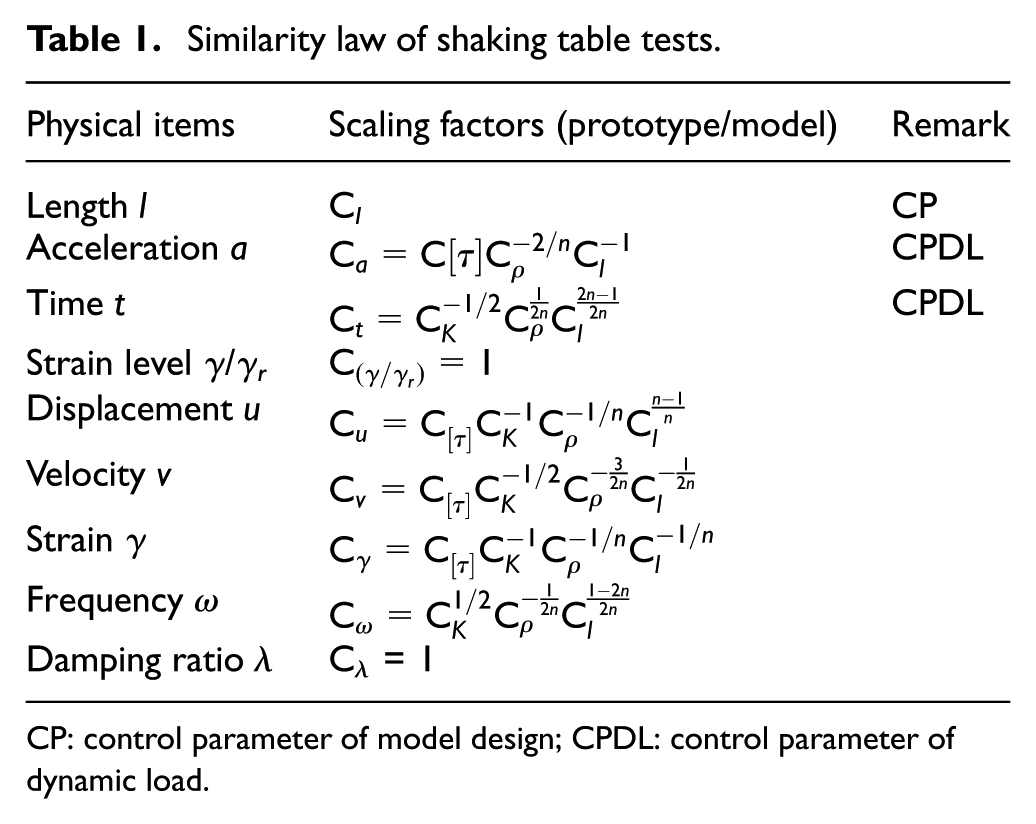
CP: control parameter of model design; CPDL: control parameter of dynamic load.
When the sandy soil nearly without cohesion adopted from field site is used directly in the model, as it is being done in most situations of geotechnical large-scale tests, the similitude developed by Jiang et al. becomes the same as Iai’s similitude with the strain scaling factor of λ1/2, as is shown in Table 2. With the Cauchy condition being met, Iai’s strain scaling factor can be calculated equal to one together with other scaling relations simplified, which has a small strain scaling factor and is used by Meymand 17 and Lin and Wang. 8
Comparison of different similarity laws.

In terms of road embankment model used in this article, Jiang’s law is employed. The prototypes are 8.0 and 4.0 m high separately corresponding to the geometric scaling factors of 10 and 5.
Wave input and load series
Three types of seismic waves, that is, the artificial wave (YL), 12 the El Centro wave (EL), and the Kobe Wave (KB), were input at the base of the model as ground motion. The shapes and Fourier amplitudes of input waves are shown in Figures 7 and 8 separately. There are different spectral characteristics of these three waves. The artificial wave has a larger dominant frequency, a wider frequency band, a larger total energy, and a more uniform distributed energy than the El Centro wave with the same PGA and duration, which is also true for El Centro wave compared with Kobe wave.

Wave forms of input accelerations.

Fourier amplitude of input accelerations.
PGAs of each wave are 0.085, 0.312, 0.616, and 0.8 g separately, and the time is compressed by 5.62 and 3.34 according to the similarity coefficients shown in Table 3. The intensity and duration of input acceleration increase gradually until the damage of embankment model, see loading sequence in Table 4.
Primary similitude coefficients of model tests.

PGA: peak ground acceleration.
Loading sequence of shaking table test.

PGA: peak ground acceleration.
Test results
Damage phenomena of model tests
The damage phenomena between the prototype and the model have some similarity. A tensile crack in the center of the top surface is found (see Figure 9(a) and (b)), which is similar to that of site investigation (see Figure 3). Horizontal cracks paralleling to the strike of the model are found together with shallow slide on the slope surface, which is also found during seismic damage investigation, as shown in Figure 9(c) and Figure 4. It can also be seen that the deformation is almost symmetrical compared with the crack and slide on both sides of the model. Test results are consistent with findings of field investigation, which should be the evidence of damage similarity between the prototype and the model being satisfied.

Destroyed model after model test: (a) top view, (b) tensile crack on the top surface, and (c) tensile crack and collapse on the slope surface.
Character of response acceleration
Figure 10 shows the comparison of Fourier spectrum between input acceleration and response acceleration at A5 of Figure 6. It is shown that higher frequency parts (above 10 Hz) of response acceleration are obviously amplified, while the lower frequency parts (below 5 Hz) almost keep the same.
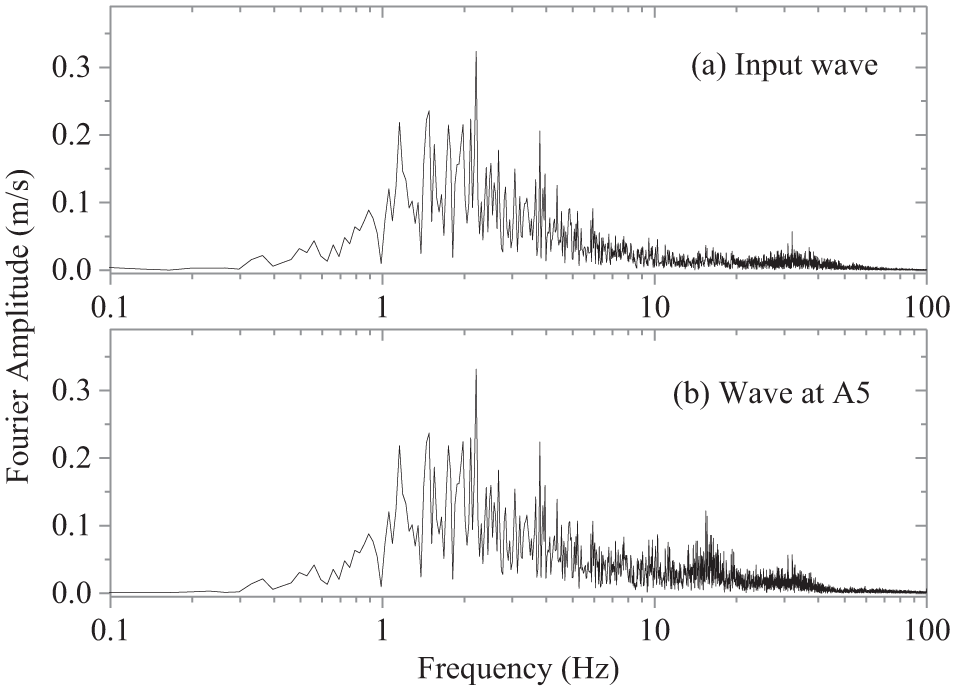
Fourier spectrum of input and response El Centro wave.
Figure 11(a) shows that with the increasing of input acceleration amplitude, the first mode tends to be vague, which shows that plastic shaking has emerged. White noise was input before and after each load, which shows that the first natural frequency of the model is becoming smaller with the increase in input PGA (see Figure 11(b)).

Fourier amplitude amplification factor (A5 to input wave): (a) of acceleration and (b) white noise signal.
Acceleration amplitude ration of top to toe on the slope
The PGA ratios of lateral slope from A1 to A5 of models with the height of 0.8 and 8 m are shown in Figures 12 and 13 separately. Although slight difference could be seen as to each type of wave on the same condition, the variation tendency of those three waves is almost the same. It shows that acceleration amplification ratio will increase with the raise of total embankment height under the equivalent seismic wave, which is in accordance with the dynamic response of elastic structure or the structure dominated by elastic deformation. It also shows that PGA amplification factor will decrease and attenuate eventually with the increase in PGA amplitude, which means that with the increase in PGA, plastic-based deformation occurs in the subgrade and will further evolve into cracking or destruction. Also, it should be noticed that there is a deviation between the measured values and the target values because of the nonlinearity of the hydraulic control system of the shaking table.

PGA (max-min) ratio of slope from A1 to A5 in 0.8 m model.

PGA (max-min) ratio of slope from A1 to A5 in 8 m model.
In addition, it is also found that for the same structure, seismic responses are similar under different seismic waves. Their difference lies mainly in the degree of response. This shows that the conclusions obtained in this experiment are generalizable.
Amplification of acceleration on the embankment top surface
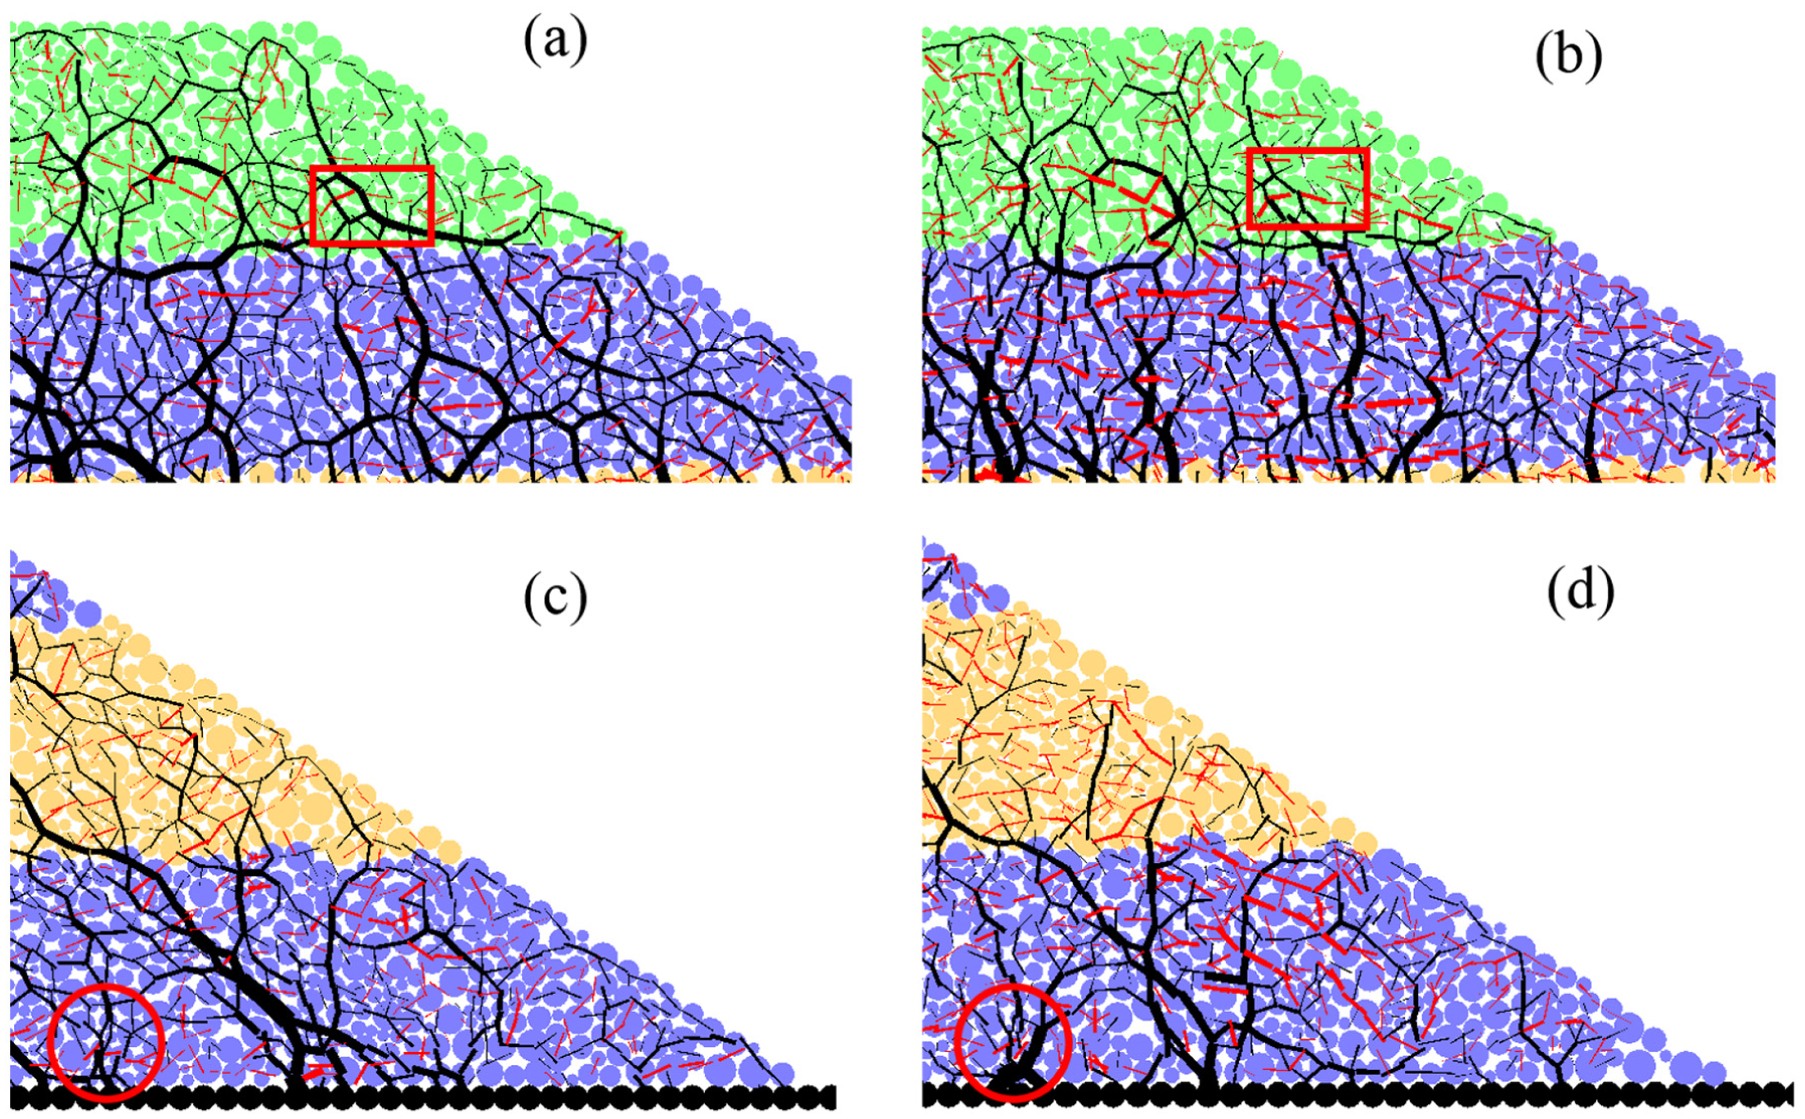
The relationship between the input ground acceleration and the amplification ratio of slope top to toe (i.e. A5 to A1) with the prototype of 0.8 m can be depicted as a logarithmic trend line, as shown in Figure 14. Furthermore, relationships between input acceleration (x) and PGA amplification (y) of different prototypes under different earthquake waves can also be summarized as a general formula as follows

where a and b are the regressed coefficients through test data, which are listed in Table 5. The MATLAB curve fitting tool was used to finish the fitting, and a value of R2 closer to 1 indicates a better fit.

PGA amplification ratio of A5 to A1 with 0.8 m height under artificial wave.
Summary of test results.
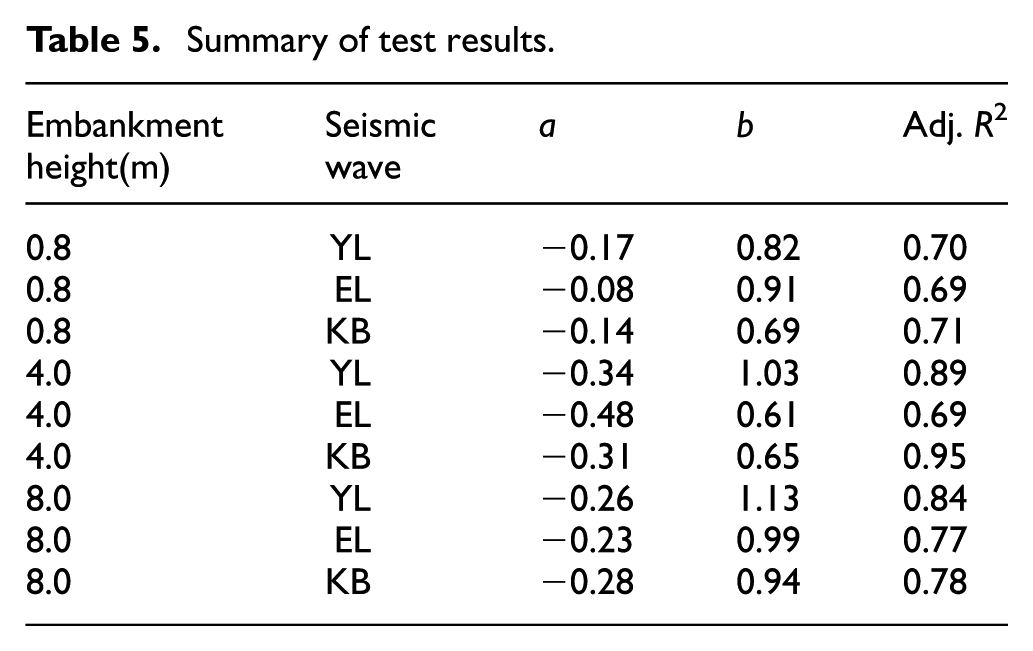
Figure 14 also shows that there is a critical acceleration that makes the PGA transform from amplification to attenuation for the prototype under seismic wave, and the relationship between embankment height and critical acceleration of each wave is shown in Figure 15. All of these three waves show the similar trends, such as the critical acceleration increases with the raise of embankment height, while some differences can be seen. As to the same prototype, the critical acceleration of YL artificial wave is obviously larger than that of El Centro wave and Kobe wave, which may relate to spectral characteristics as mentioned before. It seems that the YL artificial wave does not easily attenuate as the other two waves.

Relationship between embankment heights and critical accelerations.
Numerical simulation
Material used and geometry of the specimens
To seek the seismic damage mechanism in microscopic view, DEM simulation of the prototype with a scaling factor of 10 was conducted, as shown in Figure 16. The embankment analyzed is regular and can be simplified as a 2D plane strain problem. The DEM model contains 4275 particles, 8295 actual contacts, and 1745 virtual contacts. The specimen has a uniform particle size distribution bounded by Rmin and Rmax, with Rmax = 15 mm and Rmin = 5 mm.

A numerical model of DEM simulation.
The linear contact-stiffness constitutive model is used here, with the linear contact laws as prompted by Potyondy. 18 More realistic contact model for granular geomaterials can also be used.19,20 The corresponding granular parameters are gained by back analysis of granular triaxial tests, see Table 6.
Material parameters used in DEM analysis.

DEM: discrete element method.
Selection of input motion
Ground motion adopted for the DEM simulation was chosen as the Wolong (WL) record in the EW direction during the main shock, which was recorded on a bedrock site, 1.09 km north of fault rupture, as is shown in Figure 17. Since the DEM simulation cannot directly input the acceleration history, the corresponding peak acceleration history is converted into the velocity history input.

Input Wolong velocity wave and Fourier spectrum.
Results analyses and discussion
Character of responded velocity
As shown in Figure 18, when the input ground motion PGA is small, the response value of the ground motion at the top of the road embankment is larger than the input value (see Figure 18(a)), which shows an amplification effect. When the input ground motion PGA is large, the dynamic response at the top of the road embankment is smaller than the input value (see which shows an attenuation effect). This result is consistent with the conclusion of the shaking table test (see section “Test results”).

Input and responded velocity with different magnitude: (a) 0.1 g, (b) 0.6 g, (c) 1.0 g, and (d) 1.5 g.
Character of force chain
Different patterns of force chain under Wolong waves with PGA 0.1 and 1.5 g are shown in Figure 19. It can be seen that the force chain network changes from net-typed pattern under small ground motion with PGA 0.1 g (see Figure 19(a)) to root-typed pattern under strong ground motion with PGA 1.5 g (see Figure 19(b)), with the maximum force chain strength increase by about 50%.
Force chain shape of embankment under seismic wave: (a) force chain network (PGA 0.1 g) and (b) force chain networks (PGA 1.5 g).
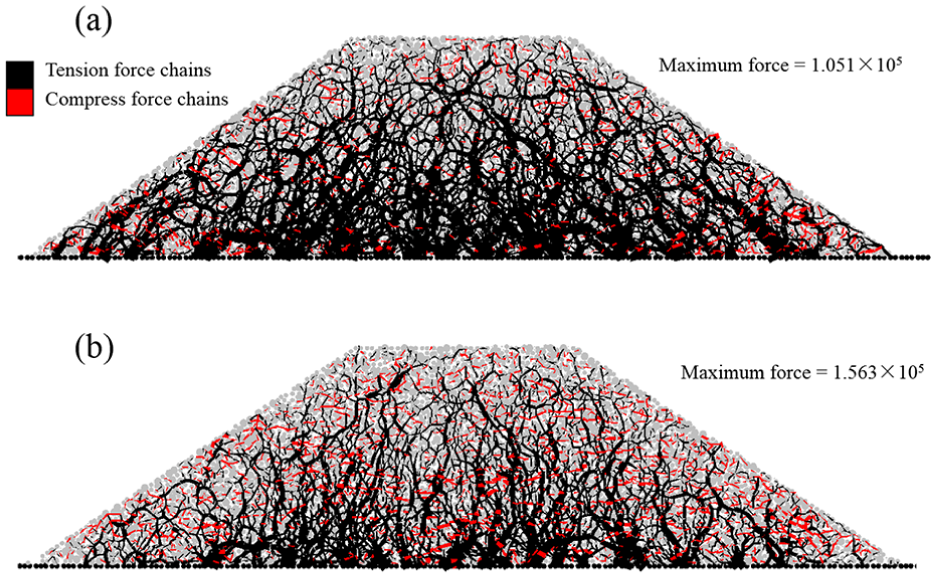
With the increase in ground motion, the evolution of force chain can be characterized as follows:
Horizontal or near horizontal compressed force chain tends to be weakened or even be broken off and near horizontal tensile force chain will be strengthened or emerge in the upper part of the embankment, comparing with Figure 20(a) and (b).
Vertical compressed force chain will be enhanced or stabilized in the lower part of the embankment, comparing with Figure 20(c) and (d).
Evolution of force chain under seismic wave: (a) right top (PGA = 0.1 g), (b) right top (PGA = 1.5 g), (c) right toe (PGA = 0.1 g), and (d) right toe (PGA = 1.5 g).
As is known, the tensile strength of soil is much less than the compressing or shearing strength, so the increase in the horizontal tensile force chain makes the particle assemblies more fragile and thus tensile cracks in the upper part of the road embankment emerge.
The strength of contact force chains steadily increases, rapidly increases, drops off, then sharply increases, and fluctuates around certain value with the increase in PGA. The fluctuation of force chain strength may reflect the large deformation or damage of embankment occurred (Figure 21).
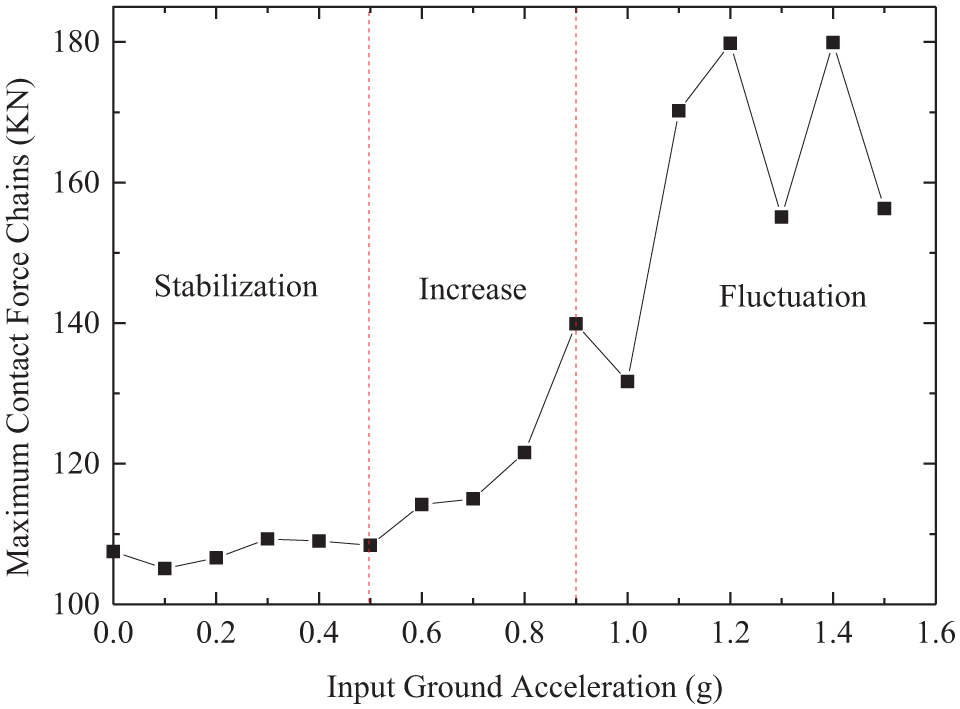
Strength of remained force chain after different seismic actions.
Conclusion
This article enquires the damage character and dynamic response of road embankment under earthquake by means of field investigation, shaking table tests, and numerical simulation. Conclusions from these analyses can be summarized as follows:
According to field investigation, the upper part of road embankment is characterized by tensile crack, while the lower part is deformed by compressing and shearing action.
Damage process of road embankment has been reproduced by shaking table test, which shows that the distribution of responded accelerations is strongly dependent on the amplitude of input ground motion and the height of road embankment.
There is a logarithmic relationship between the input ground acceleration and the amplification ratio of slope top to toe, and a critical acceleration makes the PGA transform from amplification to attenuation. The critical acceleration increases with the raise of embankment height and connects with spectral characteristics of ground motion.
DEM simulation shows that horizontal tensile force chains emerge or enhance in the upper part of the road embankment under strong ground motion, thus tensile crack comes into being; vertical compressed force chain is enhanced or stabilized in the lower part of the embankment, thus the bulge deformation forms.
Generally speaking, tensile cracks, compressing and shearing deformation, non-linear dynamic response of road embankment, and the amplification or attenuation of ground motions with different spectral characteristics make it complicated as well as inspiring. Deeping discovery and future works on it are necessary and expecting.
Footnotes
Handling Editor: Daniel Gutierrez-Reina
Declaration of conflicting interests
The author(s) declared no potential conflicts of interest with respect to the research, authorship, and/or publication of this article.
Funding
The author(s) disclosed receipt of the following financial support for the research, authorship, and/or publication of this article: This paper was financial supported by the National Natural Science Foundation of China under grant no. 51308474 and the Fundamental Research Funds for the Central Universities under grant no. 2682017CX005. Sichuan provincial science and technology support project under grant no.2016GZ0338 and 18MZGC.