
Abstract
Because of the irregular geometries, earthquake-induced adjacent curved bridge pounding may lead to more complex local damage or even collapse. The relevant research is mainly concentrated on the numerical analysis which lack experimental verification and discussion by changing of structural parameters. In this paper, a scaled three-dimensional numerical model of a curved bridge is established based on 3D contact friction theory for investigating the uneven distribution of pounding forces at the expansion joint of the bridge. Shaking table tests were carried out at first on a curved bridge to validate the numerical model. A series of parametric studies were then conducted to examine the impacts of the radius of curvature and longitudinal slope of the superstructure of the curved bridge on its seismic pounding response. The results show that the maximum pounding force first increases and then decreases as the radius of curvature increases, but that it decreases monotonically with the growth of the longitudinal slope. These results suggest that controlling the radius of curvature and the longitudinal slope of the superstructure of the bridge can reduce the localized high stress that is induced by seismic pounding. Also, the unevenly distributed pounding forces can significantly increase the relative radial displacement of the bridge’s deck corners, although the relative tangential displacement may decrease. It is thus necessary to adopt effective anti-pounding measures to prevent the superstructure of the bridge from being unseated.
Introduction
Seismic evaluation of bridge structures are necessary to provide capacity assessments of structures during strong earthquakes. Such assessments using existing evaluation approaches could complicated and unreliable. 1 Previous reconnaissance investigations of bridges under various strong earthquakes in the past few decades indicate that the structural pounding is one of the main reasons for severe damage to the bridges. While curved bridges have been favored by engineers and bridge designers, such bridges have also suffered severe impacts by earthquakes. 2 The geometric irregularity of curved bridges increases the deviation between the girder’s center of mass and their center of stiffness, which leads to the spatial coupling force of curved bridges especially under multi-dimensional earthquake excitation. Unfortunately, the curved bridges suffered severe damages or even collapsed during 2008 Wenchuan Earthquake. 3 In addition, the San Fernando Earthquake in 1971 has caused collapse of the diaphragm abutment to the South Connector Overcrossing – a nine-span reinforce concrete highway curved bridge – along SR14 Interchange in California. 4 A systematic investigation into the impact of the design parameters of bridges (e.g. the radius of curvature and the longitudinal slope) on their seismic pounding response is necessary. However, there have only a few studies on these kinds of parameters of curved bridges.
Malhotra et al. 5 used the CSMIP (California Strong Motion Instrumentation Program) to carry out a structural pounding study on a multi-span curved girder bridge located at the I-10/215 highway junction in Southern California. The results showed that the pounding mechanism at the bridge’s expansion joint, including friction pounding with a transverse motion, uneven pounding with a longitudinal motion, and pounding caused by the restraining effect of the limit device, is very complicated. Besides, the acceleration pulse generated by the pounding propagates to the far end of the joint as a wave. In a follow-up study, Malhotra established an analytical model to examine the coaxial impact of a straight bar. The duration of the impact can be taken as the basic period of the axial vibration of a shorter girder. 6 Jankowski et al. 7 discussed pounding between adjacent girders at the expansion joint of a two-span continuous girder bridge and found that the pounding would induce a most unfavorable response in the structure when the distance between the expansion joint was at a particular moderate value.
Ruangrasamee and Kawashima 8 demonstrated that the main factor that affects the pounding response of adjacent structures is the period ratio of the adjacent structures; when pounding occurs, the relative displacement between the adjacent structures will increase. Zhu et al. 9 proposed a three-dimensional contact friction pounding model and validated by two groups of shaking table tests. DesRoches and Muthukumar 10 analyzed the impacts of the adjacent stiffness ratio, the site’s characteristic period, the frame’s yield strength, and the restrainers on the pounding response of a four-span frame bridge, either considering pounding at one end of the bridge deck or pounding at both ends of the bridge deck using the recovery coefficient method. The results showed that the period ratio of adjacent frames and the characteristic period of the site were the main influencing factors in the pounding response. A more considerable difference between the characteristic periods of adjacent girders will result in the structure experiencing a greater degree of asynchronous vibration and hence the pounding response. When the adjacent girder’s period ratio is 0.7, the pounding response was small; this complies with the provisions in the Caltrans code SDC code V1.4.
Chouw and Hao 11 used the design response spectrum in the Earthquake resistant design codes in Japan and the empirical coherent loss function to simulate the spatial ground motion. They also studied the influence of the spatial variation of the ground motion and the Soil-Structure Interaction (SSI) effect on the pounding of adjacent bridge structures. Bi et al. 12 established a detailed three-dimensional structural model of a two-span simply supported girder bridge at a canyon site, and analyzed the damage caused by pounding including the effect of the spatial variation of the ground motion, local area, and the potential dislocation and unseating of the bridge’s structure. The results derived from the numerical model show that the lateral displacement of the superstructure at the bridge’s expansion joint was consistent with the actual observations after the earthquake. Such results are thus validated the established model for analyzing a bridge’s vulnerability to unseating during an earthquake.
Nazri et al. 13 explored the elastic behaviors of precast segmental box girder under static load condition through finite element simulation. A single span of precast segmental box girder bridge was modeled to examined the impacts of various transverse slopes on the elastic behaviors of the bridge. Wilson et al. 14 performed a comprehensive performance analysis on eight bridge configurations of various degrees of skew and curvature. And nonlinear time-history analysis is carried out on each bridge configuration using detailed finite element models. The results show the curved bridge models induced higher moment demand in the weak axis of the substructure and overall lower shear demand in comparison to the other configurations. Curvature also introduced higher moment demand on the interior pier-columns, which increased with lower radii. However, when the pounding effect is considered, these laws may not be applicable.
Huo and Zhang 15 carried out a three-dimensional numerical analysis of a typical three-span reinforced concrete skew bridge in California, considering the nonlinearity of the pier columns, setting of the expansion joint, and the gap elements at the end of the abutment into account, as well as the pile-soil interaction and the spatial variation of the ground motion. The results show that the coupling responses of skewed bridges can be more favorable compared to the uncoupling behavior of straight bridges without pounding. However, any pounding will result in more severe damage to the skewed bridges due to the high correlation between such damage and the skew angle of the bridge. The authors also proposed a vulnerability function to measure the probability of seismic damage to the studied bridge.
Amjadian and Agrawal 16 established a typical three degree of freedom non-linear curved bridge model for use in assessing the effect of pounding on the rigid body motion of a horizontally curved bridge during a strong earthquake. The results show that seismic pounding significantly impacts the radial and tangential displacement at the corners of a bridge’s deck its rotation. Li et al. 17 conducted a series of shaking table tests to investigate the impacts of seismic pounding and longitudinal slope on the seismic responses of a medium span curved bridge. The results show that the pounding frequency decreased as the gap size increased. Results also indicate that the pounding forces were larger at locations near a short pier than those near a tall pier due to the longitudinal slope. Such observations suggest that a significant vertical dynamic response exists in the girder.
The existing research indicates that the curved bridges produce more complex seismic responses, making the bridge more vulnerable than straight bridges. However, the seismic responses caused by pounding on curved bridges with a small radius of curvature and a sizeable longitudinal slope remain unknown to bridge engineers. Such an unknown prohibits bridge engineers from comprehensively diagnosing the bridges’ structural dynamic behaviors during earthquakes. In this study, a three-dimensional numerical model of a prototype curved bridge with a small radius of curvature has been established using ABAQUS and then validated by comparing it with the experimental data. By comparing the seismic responses of a bridge with and without pounding for different radii of curvature and longitudinal slope conditions, the effects of the radius of curvature and the longitudinal slope on the bridge’s seismic responses and the local damage of curved bridges have been fully investigated.
Numerical modeling and experimental calibration
The design of shaking table test model
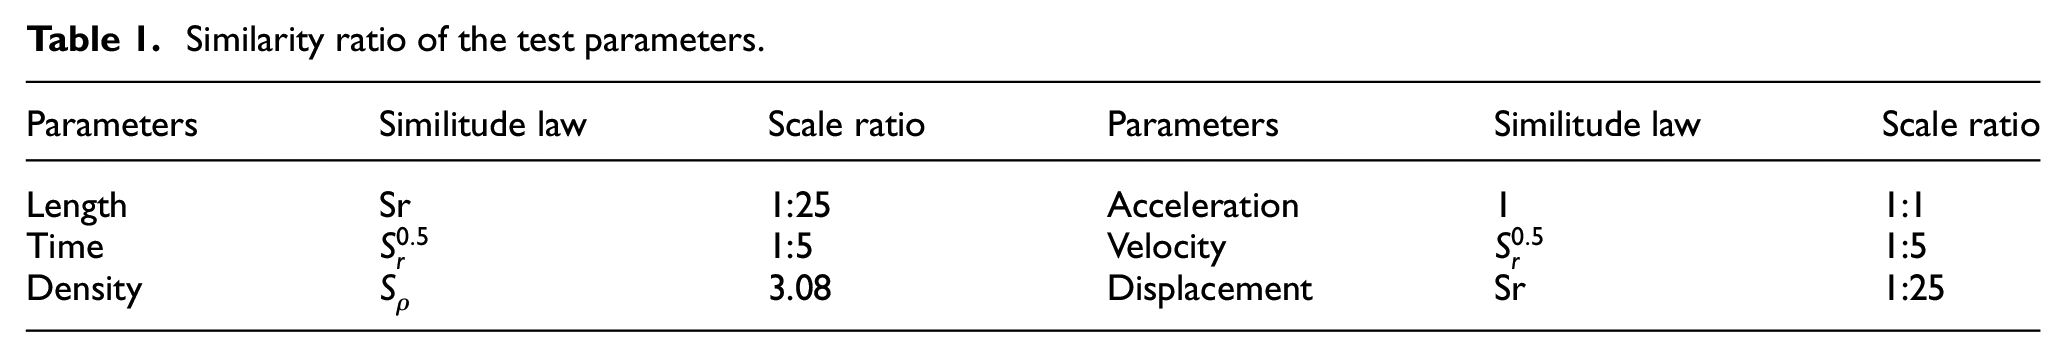
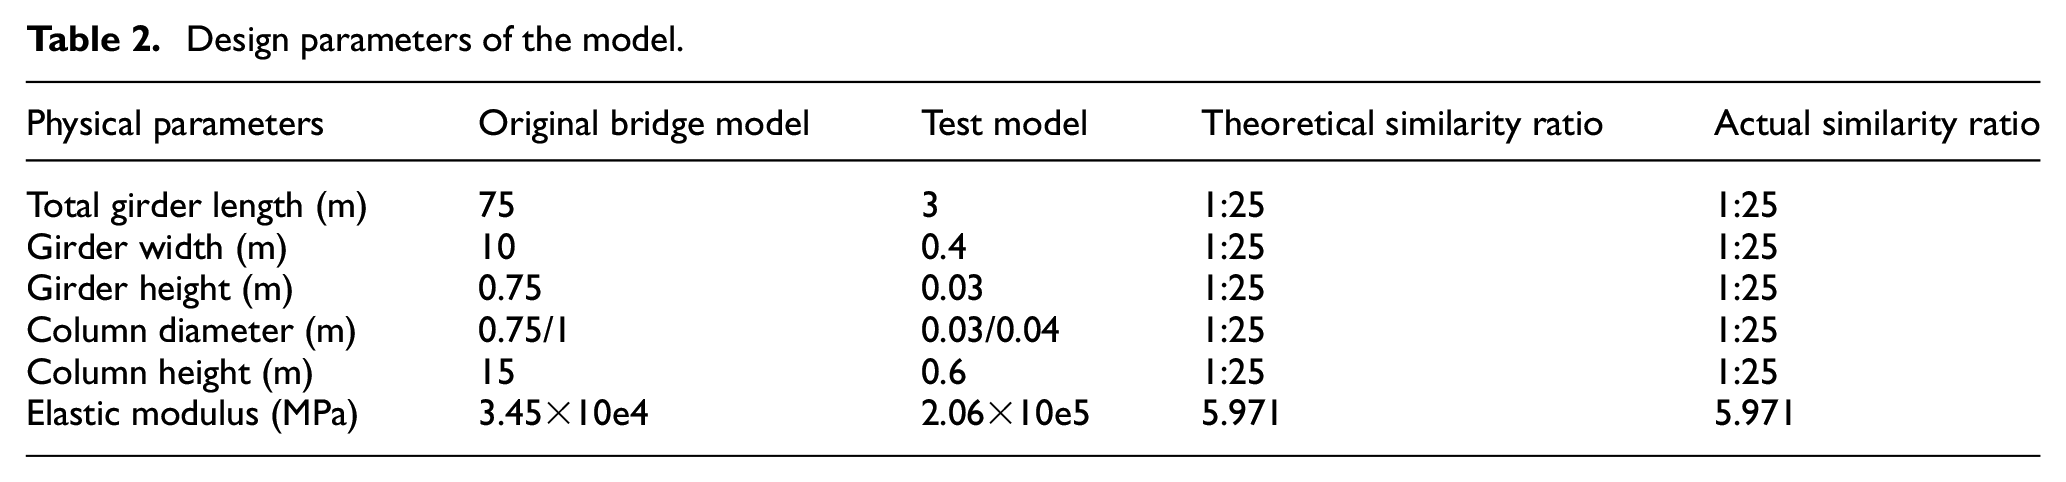
In this paper, a scaled model for a prototype curved bridge with dimensions of 25 m × 25 m × 2 m with a radius of curvature equal to 75 m was designed and tested by shaking table test. The geometric similarity ratio is set to be 1/25 due to the limitation of the dimensions of the shaking table. The similarity ratios for the other quantities were determined accordingly and summarized in Table 1. The main design parameters of the model were then derived from the proposed similarity ratios (shown in Table 2). Figure 1 shows the schematic of the scaled bridge model with a radius of curvature of 3 m (radii of curvature from inside and outside are 2.6 m and 3.4 m, respectively).
Similarity ratio of the test parameters.
Design parameters of the model.
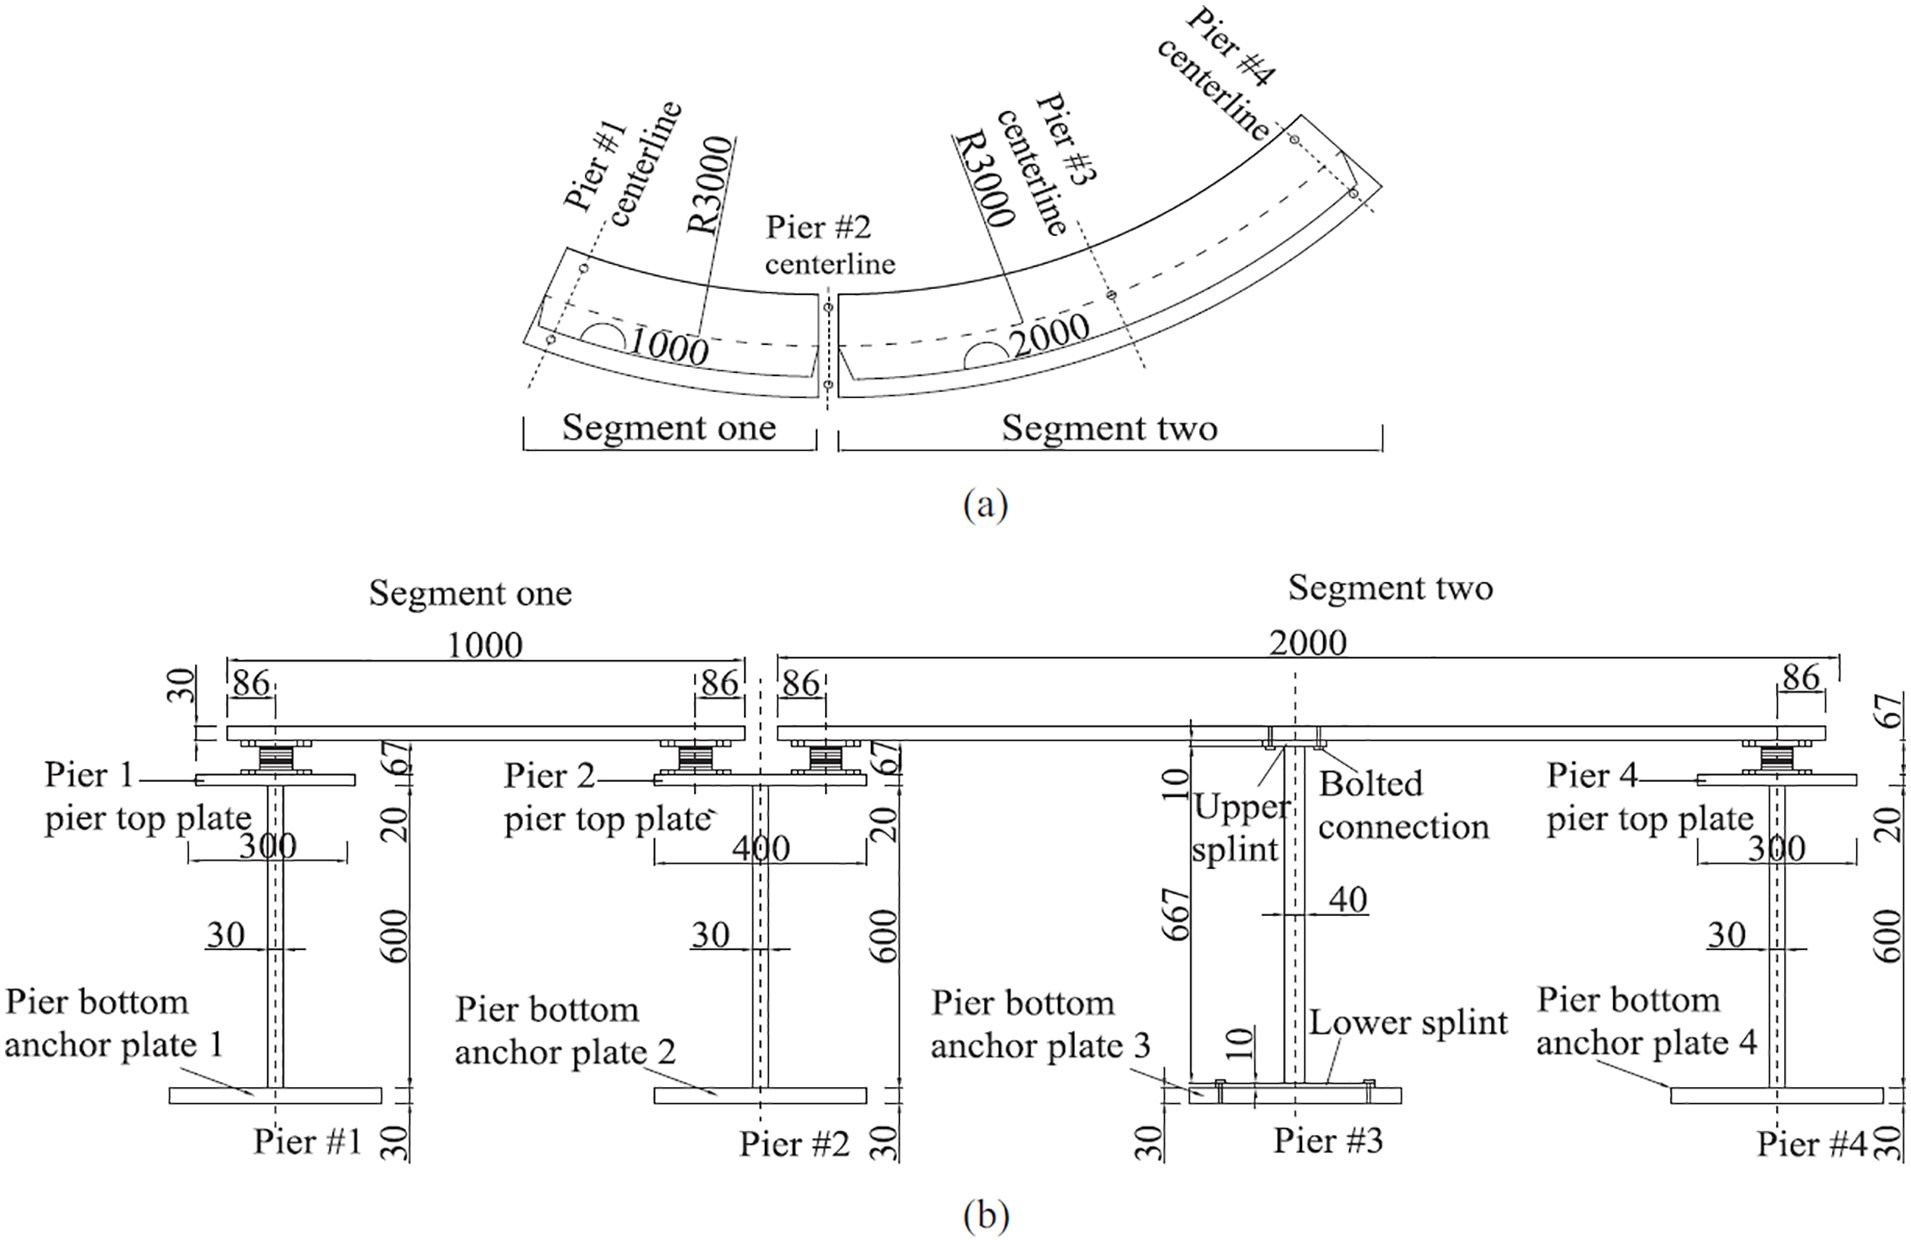
Schematic of the model: (a) plan view (Unit: mm); (b) elevation view (Unit: mm); (c) the section of Pier #1, #2, #4 (Unit: mm); and (d) the section of Pier #3 (Unit: mm).
The model consists of two segments, (1) segment one – a single-span (1 m) segment and (2) segment two – a two-span (1 m + 1 m) continuous segment with four piers. The cross-section of the girder is a solid web rectangular section with a width of 400 mm and a thickness of 30 mm. Piers #1, #2, and #4 were double-column bents while Pier #3 consisted of a single column.
The finite element model
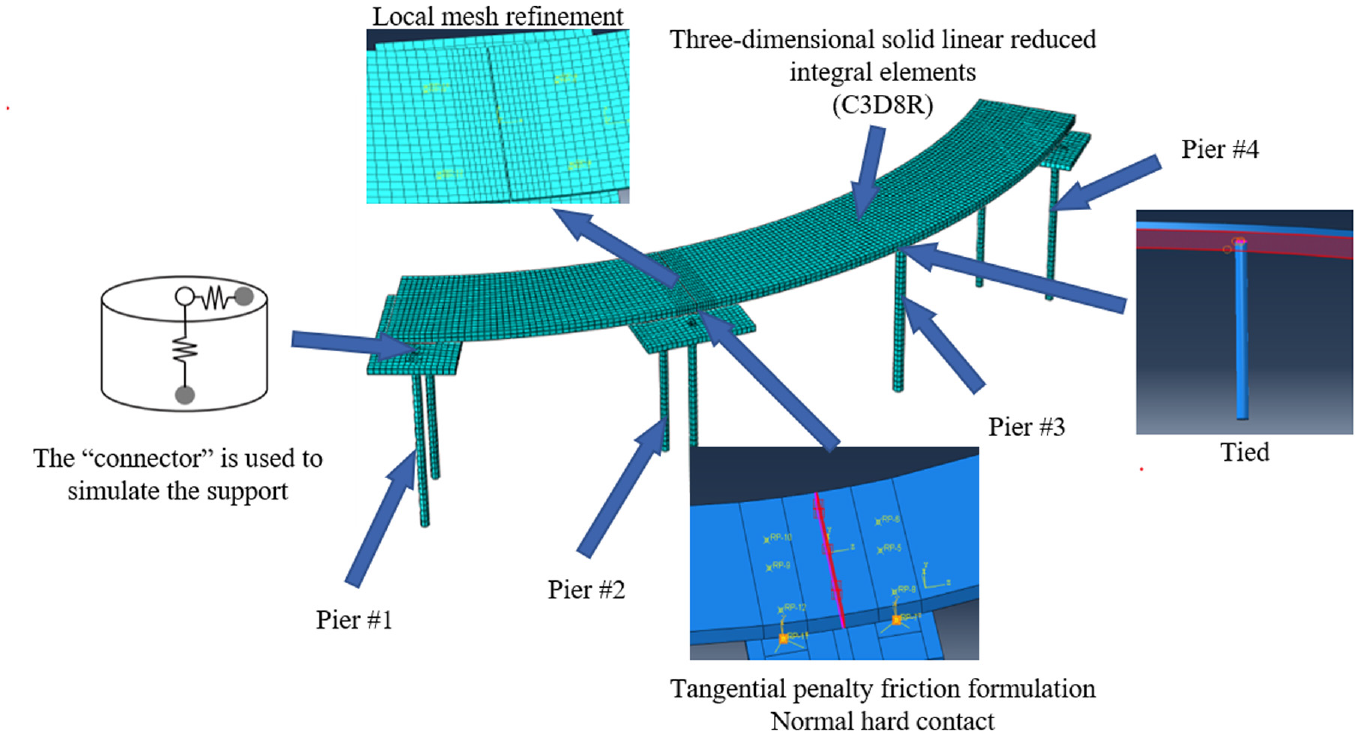
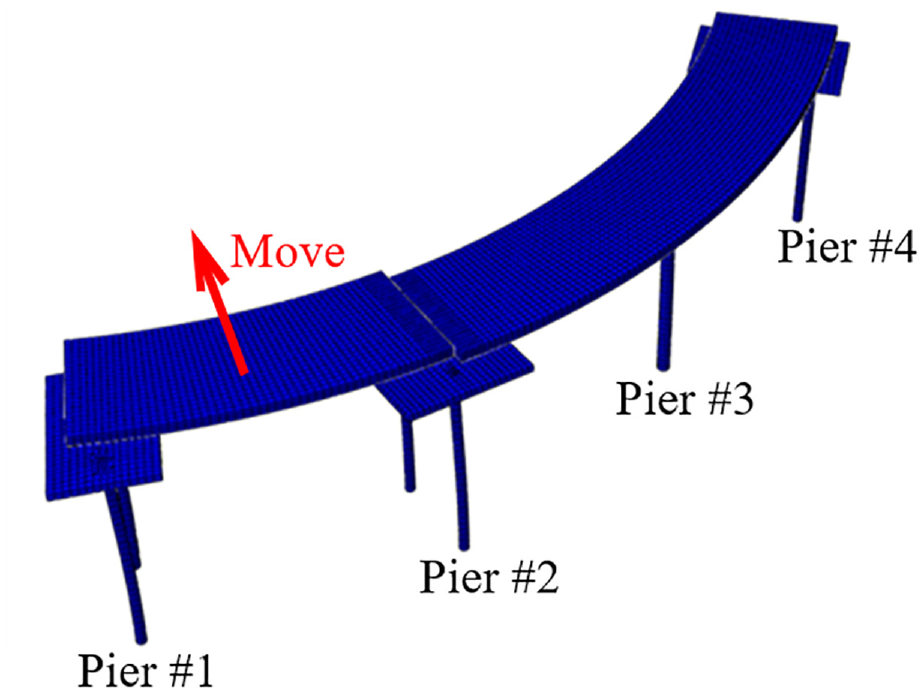
The authors also constructed a refined finite element model of the scaled model using ABAQUS (Figure 2). Three-dimensional solid linear reduced integral elements (C3D8R) were used to model both girders and piers to improve the reliability of the numerical analysis. The authors use the Q345 Steel (Steel (the yield strength is 345 MPa) to model the material properties of girders and piers. The authors only consider the horizontal and vertical constraints in the model due to the weak rotational constraint of the laminated rubber bearing imposed on the girder. The bearing connection attributes defined its three-dimensional stiffness through a Cartesian connection in the connection section. According to the shear test of the rubber bearing, the tangential rigidity was 70 kN/m, and its axial rigidity was 35,000 kN/m. In this paper, continuous distributed point-surface coupling was specified when modeling the support-deck connection. Relative displacement between the surface of the fixed pier and the bottom of the main girder was not considered. In addition, the binding constraint (TIED) treatment was adopted for both surfaces. Rayleigh’s damping assumption was also adopted for the nonlinear time history analysis.
The finite element model in ABAQUS.
The essence of seismic-induced pounding is a serious discontinuous nonlinear contact mechanical behavior, which can be modelled by imposing constraints or ignore the constraints in ABAQUS. The contact will be triggered by adding restrain between the two segments, when the relative distance between them becomes smaller than zero. The interaction of contact surface at the expansion joint is modelled by surface to surface contact. The contact in the normal direction is assumed to be rigid, while the tangential behavior adopted the penalty function formula to allow limited elastic sliding (see Figure 4). By referring to relevant data, the coefficient of dynamic friction between two steel surfaces without lubrication is 0.15 (it is input into the penalty function formula of ABAQUS). The behavior of normal direction adopted “Hard” contact of ABAQUS (when the contact pressure became zero, the separate segments will be separated and the restrain will be eliminated, as shown in the Figure 3). On the other hand, the global grid size of curve bridge model is 0.02 m. In order to better observe the local response of the expansion joint under impact, the mesh near the expansion joint is refined. The mesh size is 0.01 m, and the whole bridge is divided into 18,306 elements and 33,672 nodes, as illustrated in Figure 5.
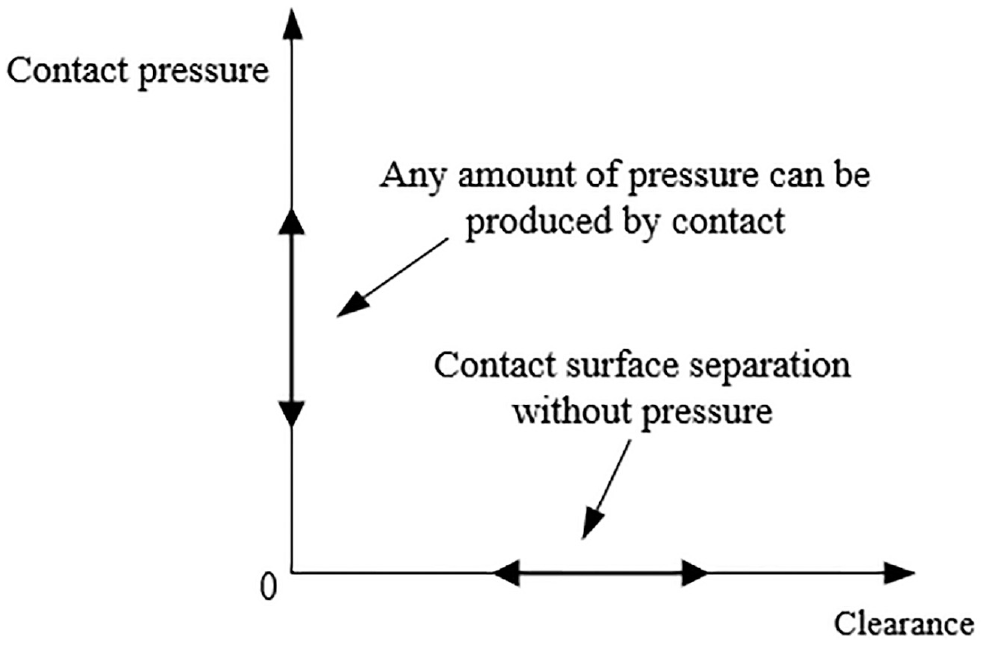
Contact pressure of rigid contact versus clearance.
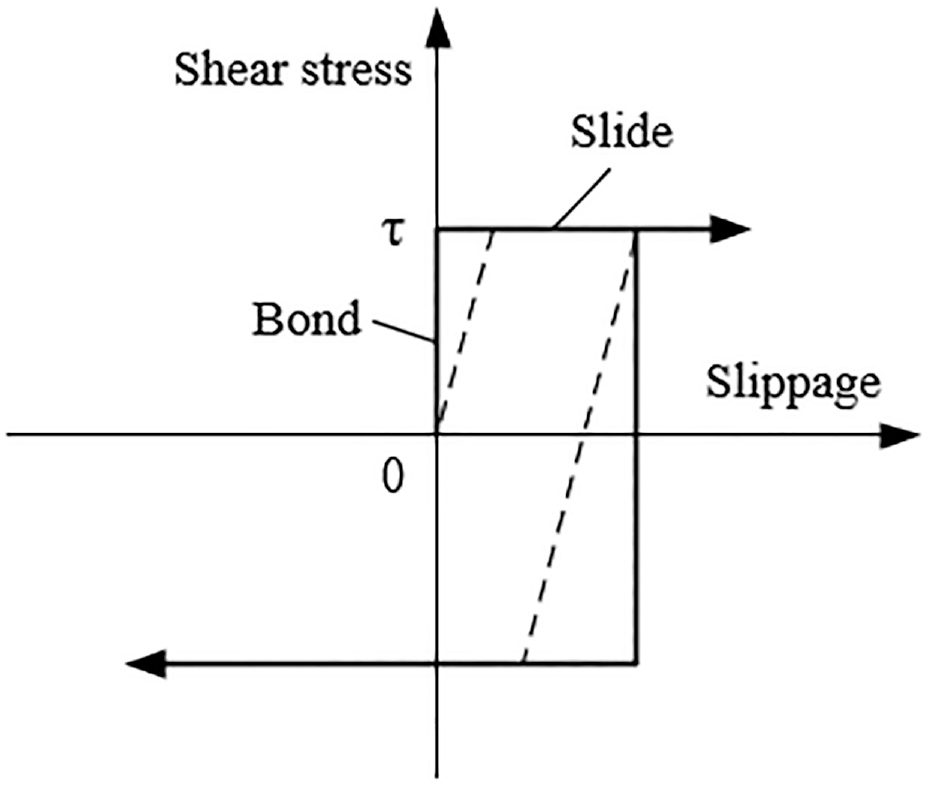
Behavior of penalty function.
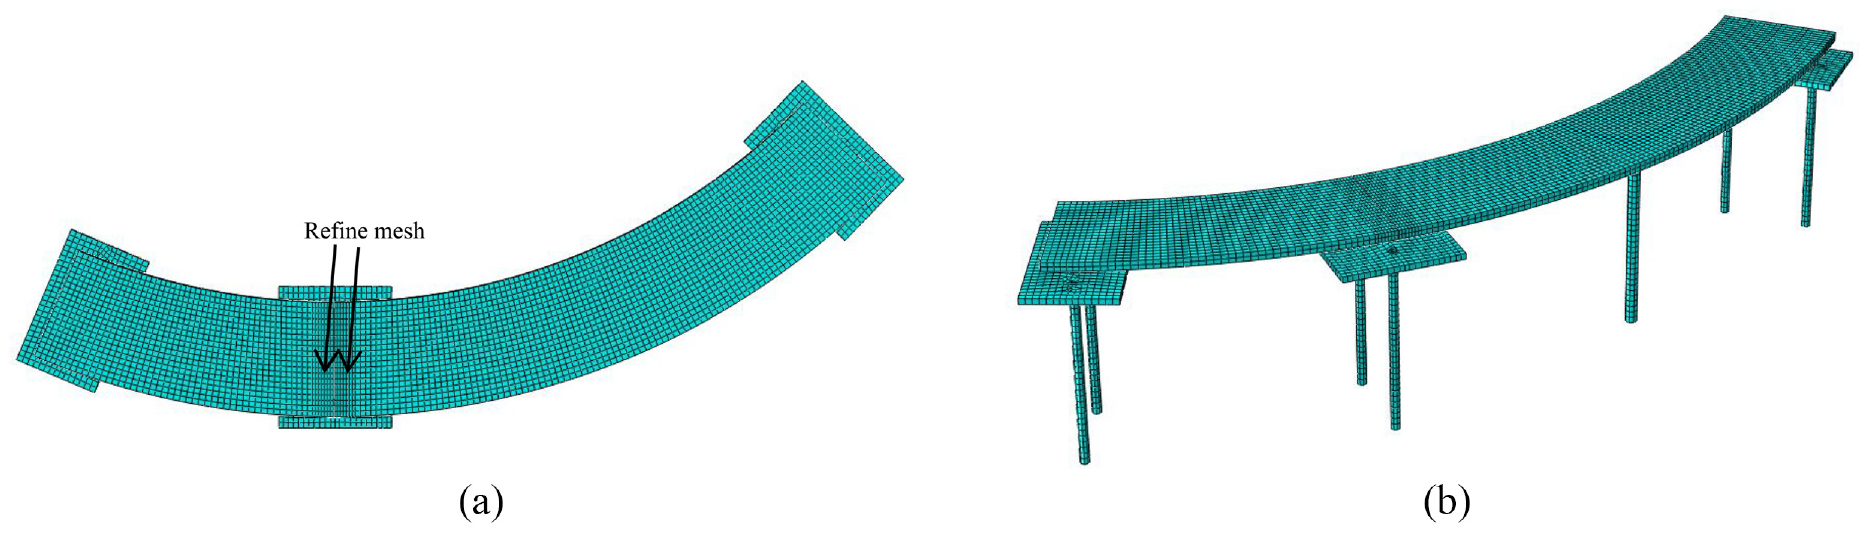
Detail of the mesh for the finite element model:
The shaking table test
The model was made of Q345 steel (the yield strength is 345 MPa). Figure 6 shows the layout of the model on the shaking table. According to the test requirements of acceleration, displacement and contact force at different measuring points, the main test equipment and parameters used in the test are as Figure 7. The location of instrumentation used in the experimental study is showed in Figure 8 (A is the acceleration sensor; D is the displacement sensor; F is the force sensor).
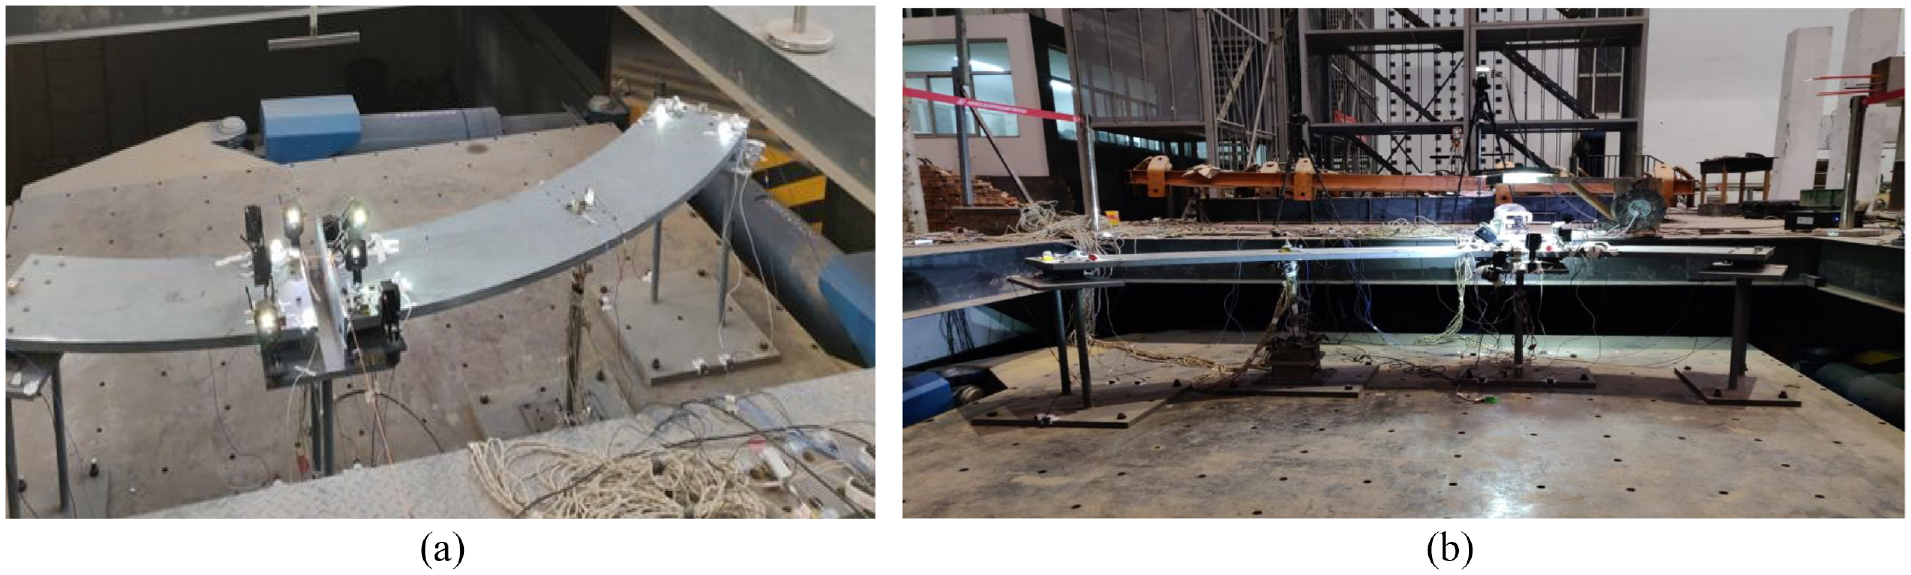
Layout of the shaking table test: (a) top view and (b) front view.
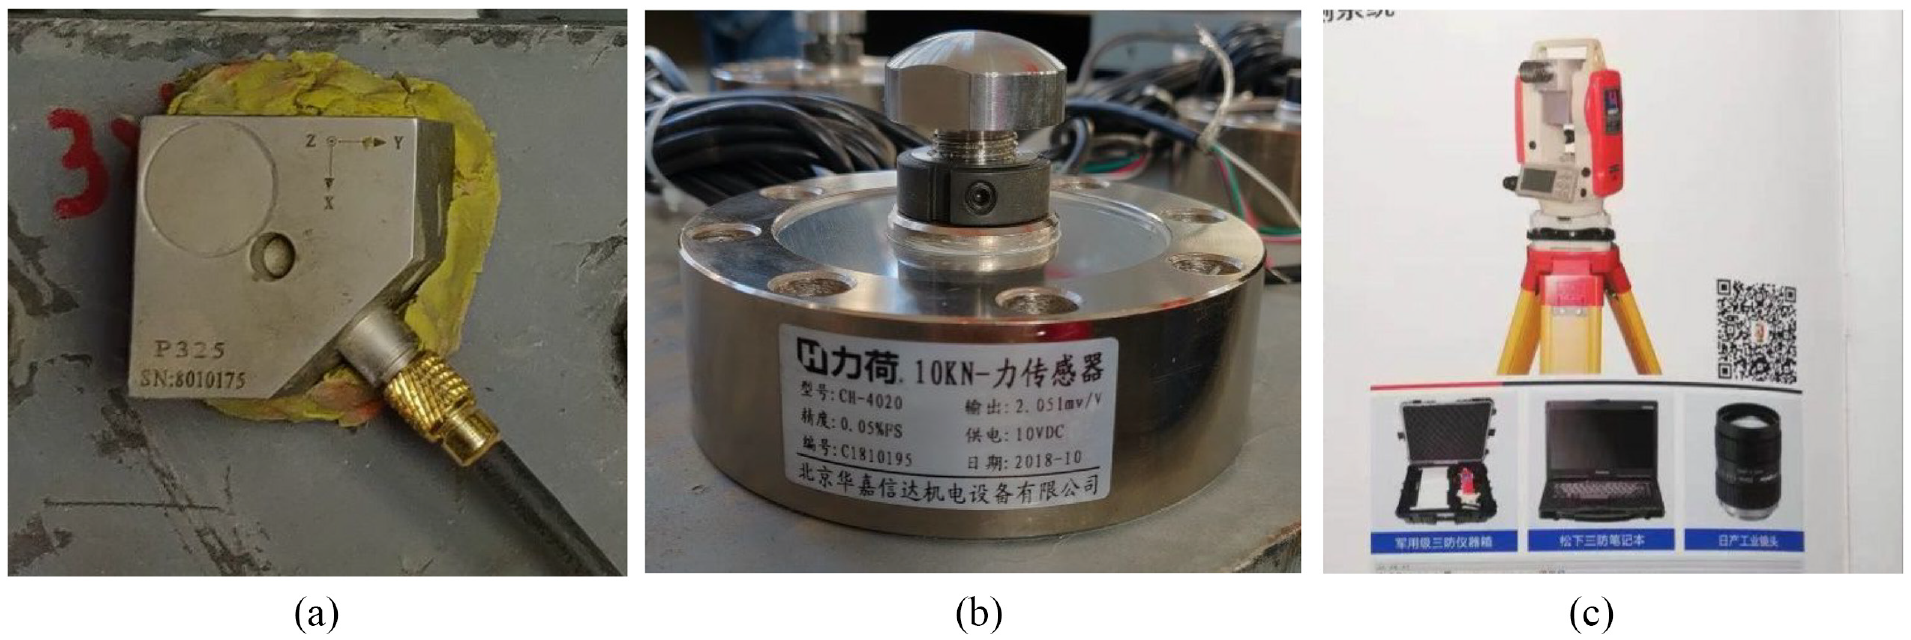
Testing equipment: (a) P325 three way acceleration sensor, (b) Ch-4020 force sensor, and (c) Multi point video dynamic and static displacement meter.
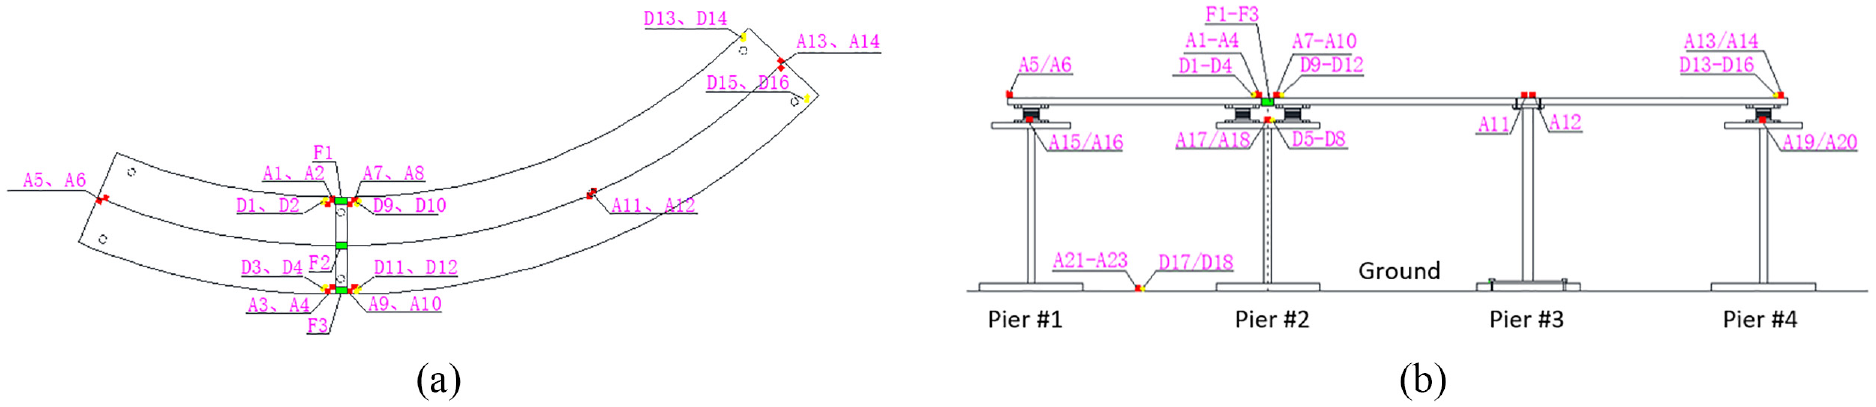
The location of instrumentation (a: plan view; b: elevation view).
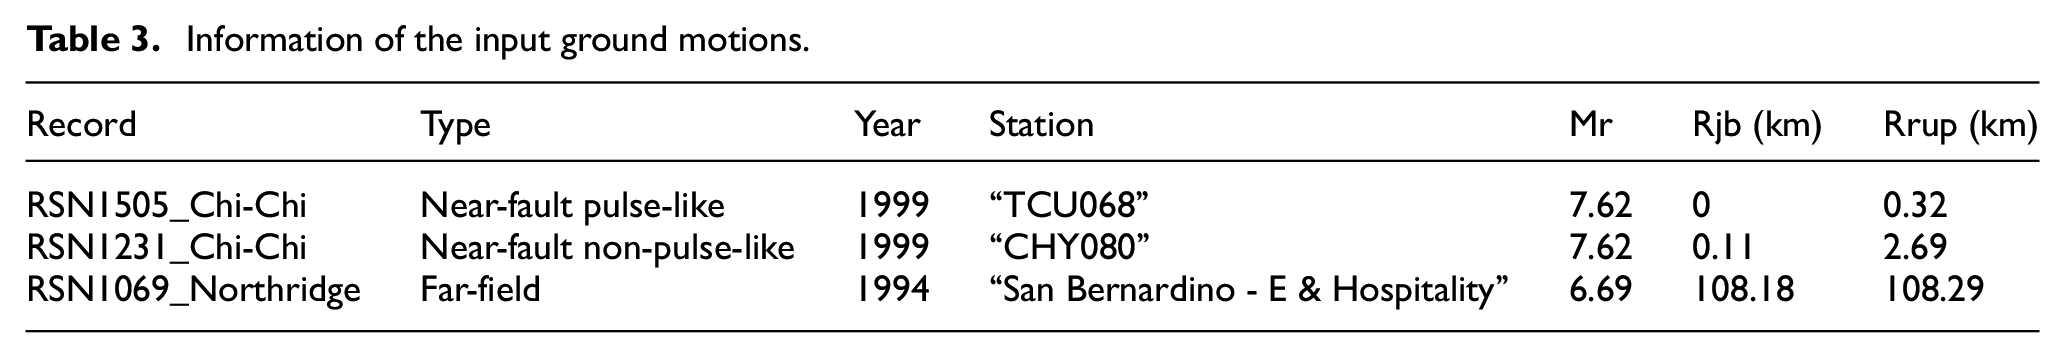
The prototype bridge is located at a Type III site with a seismic intensity of grade 8 and a peak ground acceleration of 0.2 g according to the Code for Seismic Design of Urban Bridges. 18 Therefore, three records from the Pacific Earthquake Engineering Research Center (PEER) strong motion database were selected (1) two near-field pulse-like and non-pulse-like motions from the 1999 Chi-Chi earthquake and (2) a far-field motion from the 1994 Northridge earthquake. The pulse-like record represents near-field earthquakes with strong directivity effects.19,20 Detailed information on the selected motions has been summarized in Table 3 (Mr refers to the earthquake magnitude; Rjb refers to the Joyner-Boore distance; and Rrup refers to the Rupture distance). These records were time-compressed by 1/5 to satisfy the similitude law for time. Besides, for the purpose of generating enough response of the structure, the peak acceleration of the selected motions was scaled to 0.4 g to excite seismic pounding between adjacent girders. Figure 9 shows the time histories of the selected input ground motions.
Information of the input ground motions.
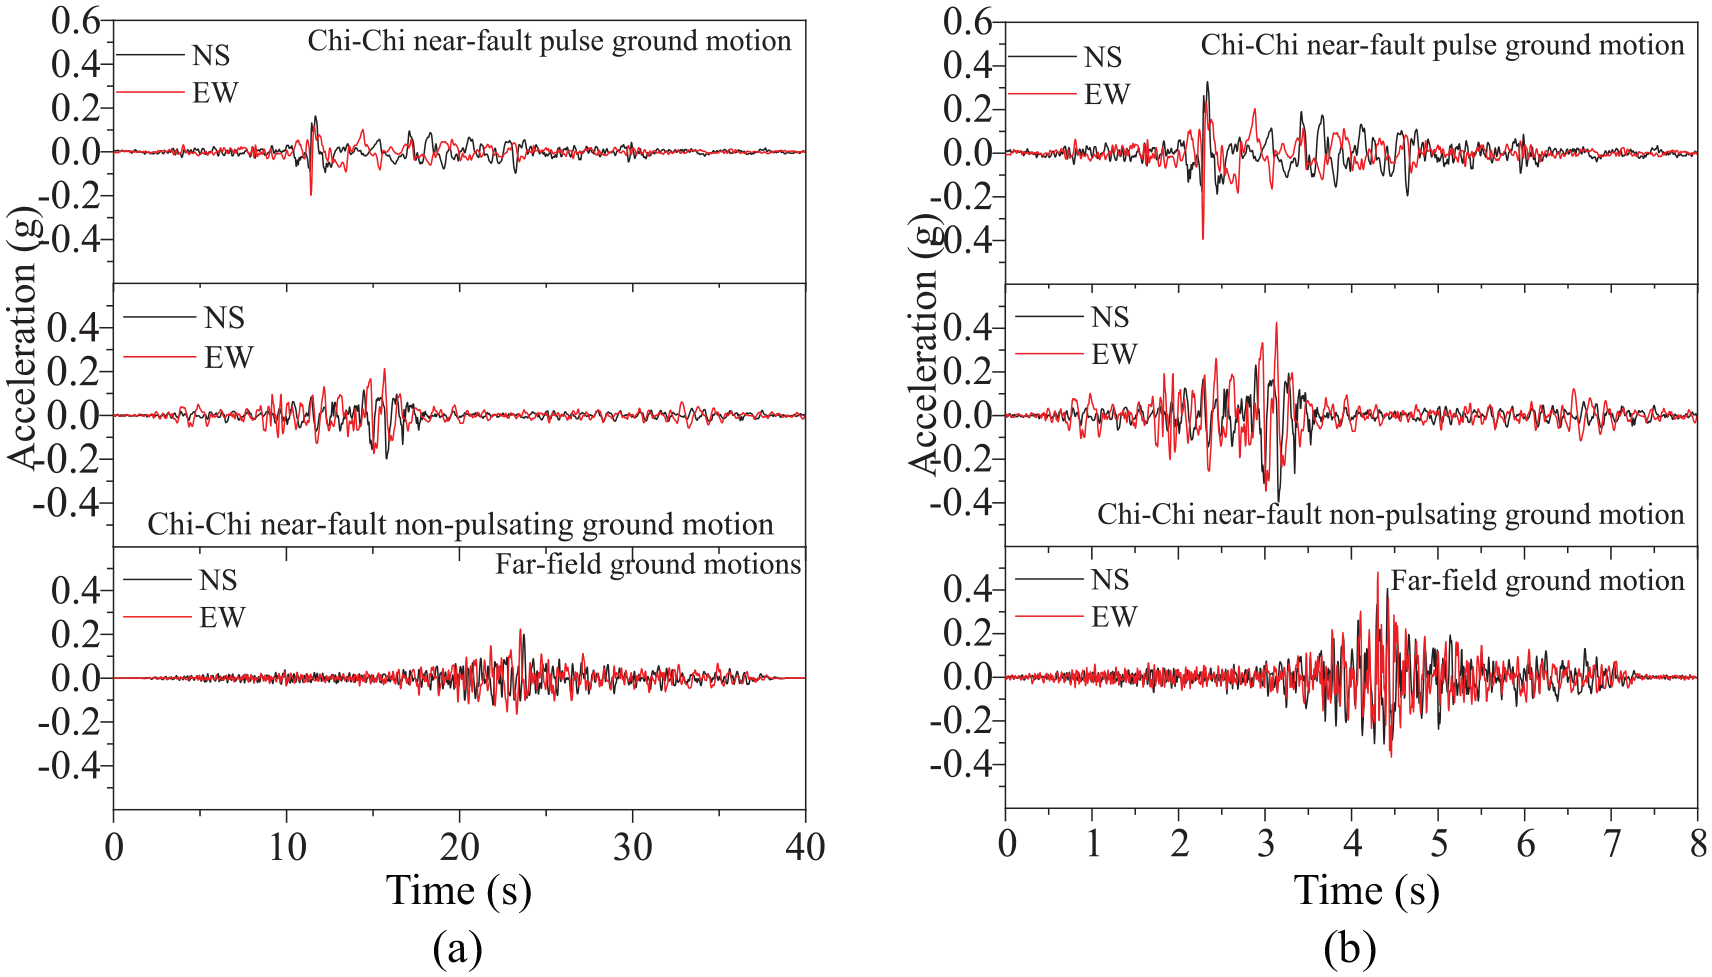
Time histories of the selected ground motions: (a) unscaled records and (b) scaled records.
Shaking table test could help to realize the impacts of different input directions for ground motions of the bridge model on its seismic behaviors. Controlling the shaking table allows the authors to examine such impacts testing with different input directions for ground motions. Determining the most unfavorable input direction for ground motions is of great importance since the seismic responses of curved bridges in different directions are highly coupled. In the preliminary testing of the model, the Chi-Chi TCU068 record was applied repeatedly to excite the model over a wide range of input angles. The largest deck acceleration and relative displacement at the corners of the deck were obtained when the input angle was 169°. Preliminary testing suggests that this input angle corresponded to the secant direction between the two adjacent piers of the single-span segment, as shown in Figure 10. As relatively large deck acceleration and relative displacement at the deck corners always indicate the potential for more significant seismic pounding, more severe damage could then have occurred. In other words, the input direction for ground motion that have applied to the finite element model was taken to be the most unfavorable input direction for the three selected ground motions. 21 Besides, the seismic responses of the prototype curved bridges for this angle were then studied experimentally
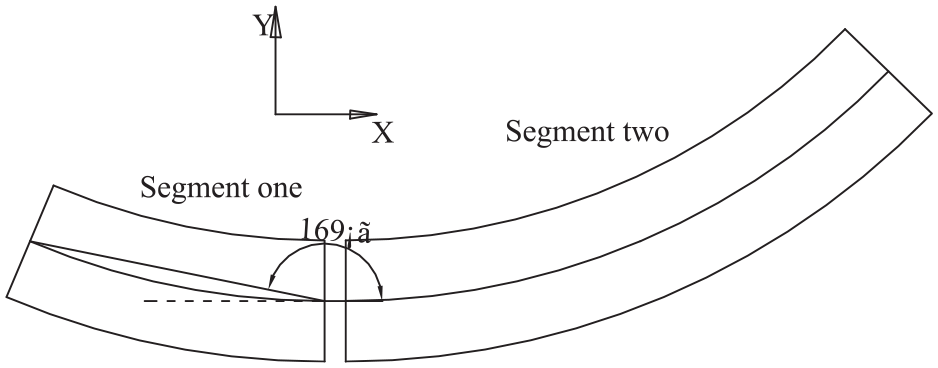
The most unfavorable input direction for the selected ground motions.
The results from the shaking table test indicate that: (1) the relative displacement between piers and girder (away from each other) and the torsion angle of girder will both increase when the pounding effect were considered. Such scenario could trigger the increase of the risk of lateral pounding and falling of girder; (2) with the increase of the distance between expansion joints, the peak value of pounding force and the number of pounding decrease; (3) structures are more likely to collide under near fault ground motions; (4) The location of pounding mostly occurs at the corner of main beam, and the number of pounding inside the curve is more.
Validation of the finite element model
Modal analysis is both an essential and efficient way to understand the fundamental vibration characteristics of structures and to verify a numerical model. In this paper, the authors used the Lanczos method to calculate the first 30 vibrational modes of the test model in ABAQUS. The first mode (transverse vibration of left girder and Pier #1 and Pier #2) has a natural frequency of 6.54 Hz (Figure 11). The natural frequency of the first mode of the model was determined to be 6.67 Hz, based on the experimental data for the white noise input. The results agreed well with the results generated from the numerical model.
The first mode shape of the model (transverse vibration of Segment one, Pier #1, Pier #2).
Figure 12 shows a comparison of the time history results from the test model and the numerical model for the far-field Northridge motion input (the input angle was the most unfavorable direction discussed in section 2.3). Figure 12(a) and (b) show well-matched results between the scaled acceleration time history of the Northridge motion and the actual input motion generated by the shaking table. Figure 12(c)–(f) shows a comparison of the acceleration responses between the two models.
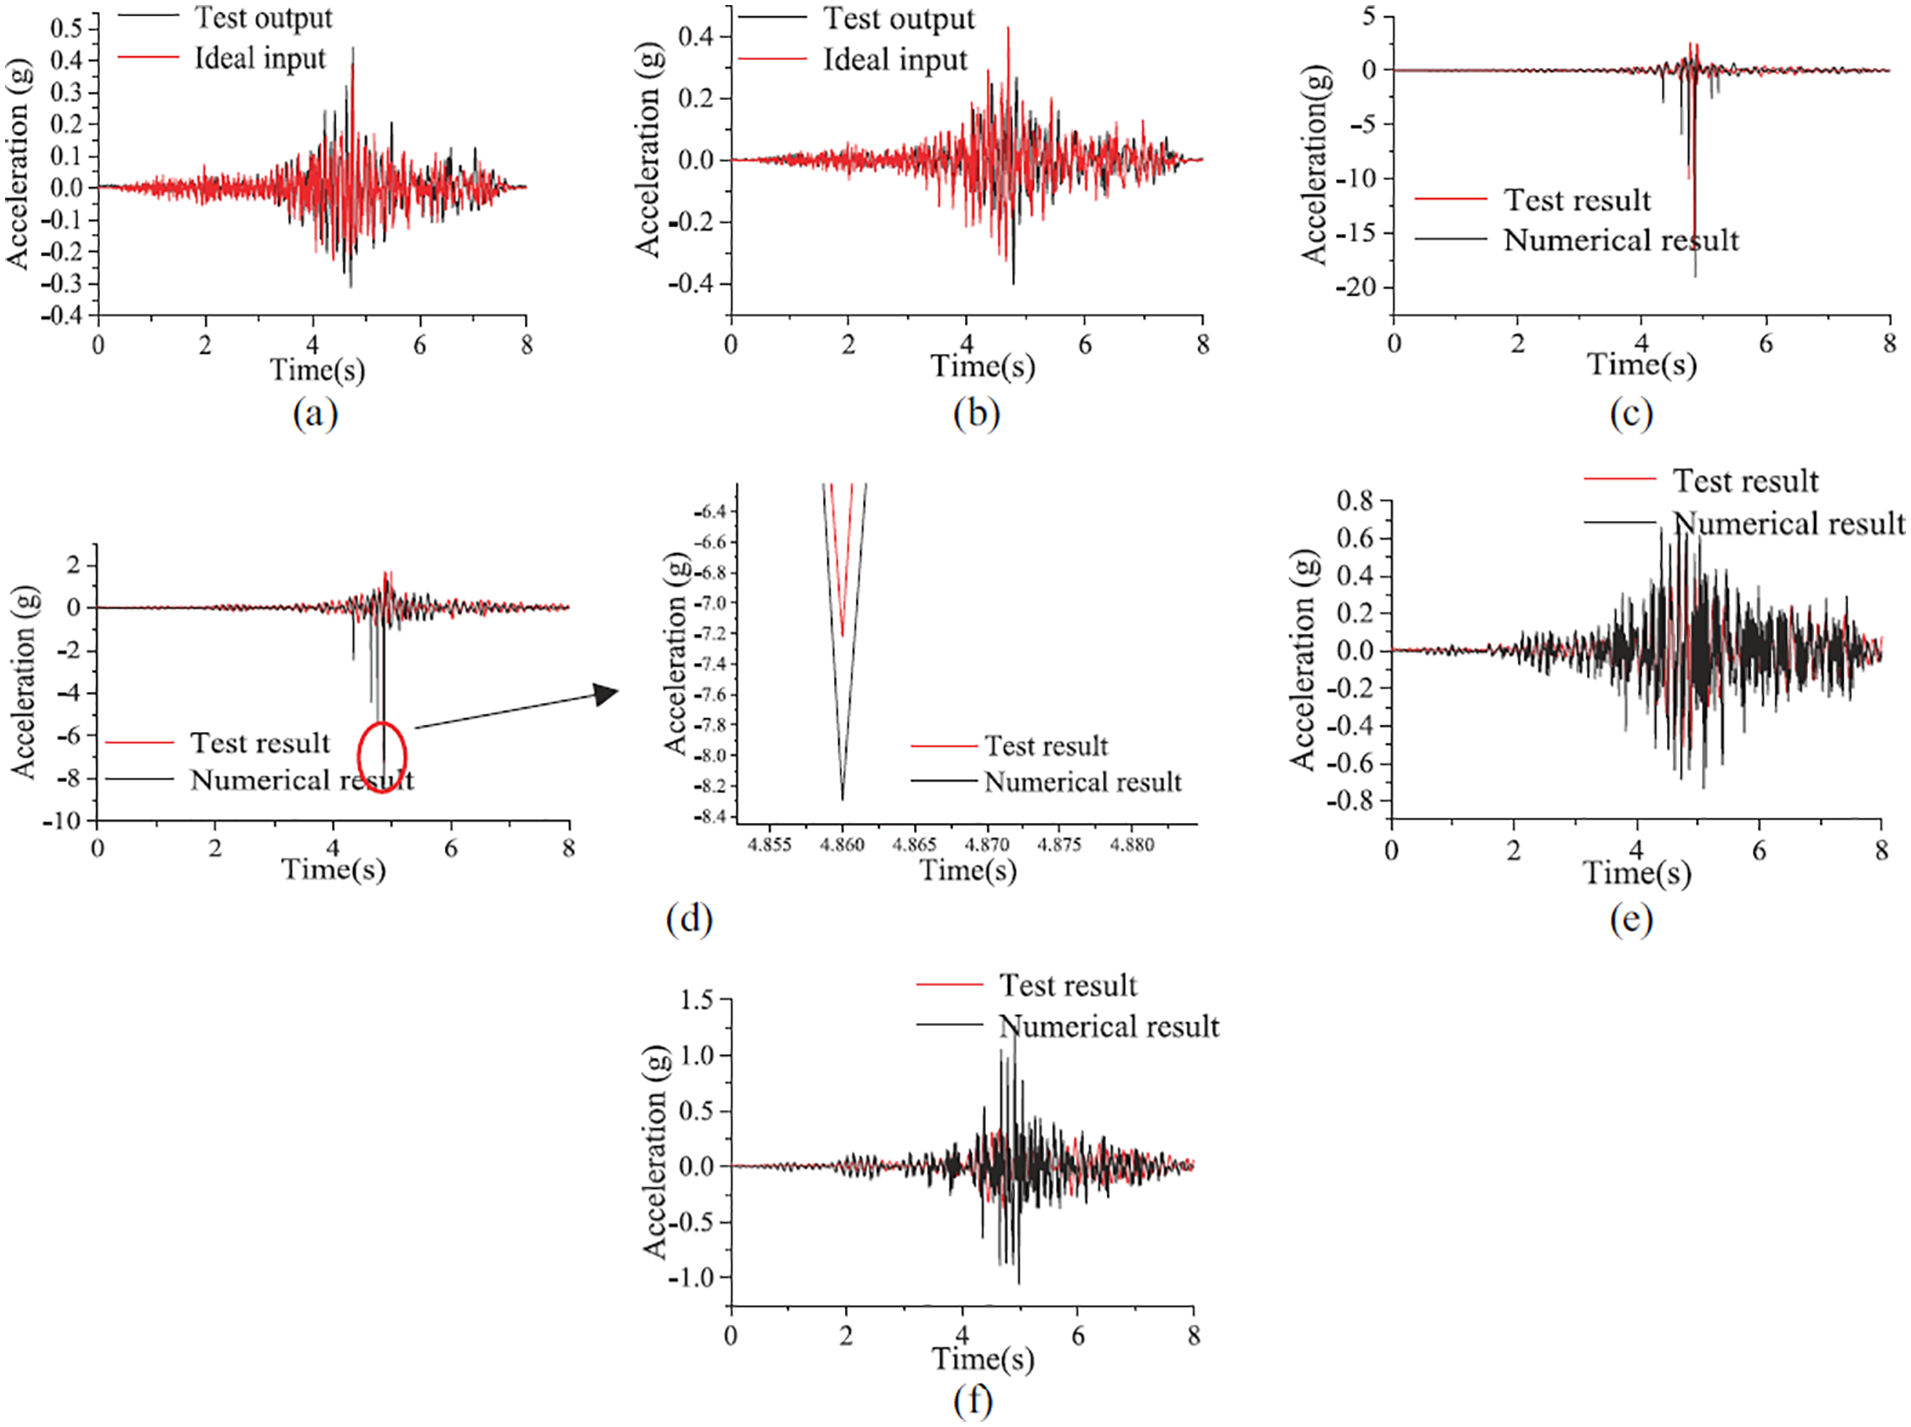
A comparison of time history results between the test model and the numerical model regarding the seismic pounding: (a) acceleration along the bridge, (b) acceleration across the bridge, (c) longitudinal acceleration of the deck outside Segment one pounding end, (d) lateral acceleration of the deck at the Segment one pounding end, (e) longitudinal acceleration at the top of Pier #2, and (f) transverse acceleration at the top of Pier #2.
The results show that: (1) the acceleration time history responses of both the bridge deck and pier top obtained from the numerical model were in good agreement with the test results; (2) the peak acceleration of the bridge deck from the numerical analysis was larger than that from the experimental results with errors no exceed 14.9% – this may have been due to different aspects of the tests. First, the rough contact surface increases the complexity and randomness of the pounding process. Second, the additional constraints could also increase the stiffness of the structure, which increases the contact forces. Third, the unavoidable manufacturing error may have changed the actual pounding stiffness in the test model. Fourth, there is no force sensor in the numerical simulation, there is a certain error in the lateral impact response. However, the peak value is in good agreement. In general, good agreement was obtained between the experimental data and the numerical analysis, and the established numerical model is therefore applicable in further parametric studies.
Parametric studies of structural responses including seismic pounding
The effect of seismic pounding between adjacent girders on the force demands of capacity protected members of bridges is not explicitly considered in the existing design codes and guidelines. For bridge columns, the common practice to determine the design moments and shear forces of capacity protected members is based on the probable flexural strength of the sections within the plastic hinge zone and while considering the potential plastic hinge locations. The likely flexural strength of the sections shall be calculated by considering the over-strength of the materials and is commonly expressed as being the nominal flexural strength multiplied by the over-strength coefficient ϕ0, which has a typical value of 1.2.18,22 However, such a design method may not be conservative, as the pounding between adjacent girders may increase the seismic demand on the columns of bridges. In this section, the authors examined the impacts of the radius of curvature and longitudinal slope on the relative displacement between adjacent girders and the force demand on the bottom section of the pier.
The shaking table tests indicate that the bridge would suffer the most severe damage from a near-fault pulse-like the Chi-Chi earthquake ground motion (utilized in the subsequent analysis). To better evaluate the effect of pounding on the seismic responses of curved bridges, the structural response change coefficient ψ has been defined as follows:

where,
The effect of the radius of curvature
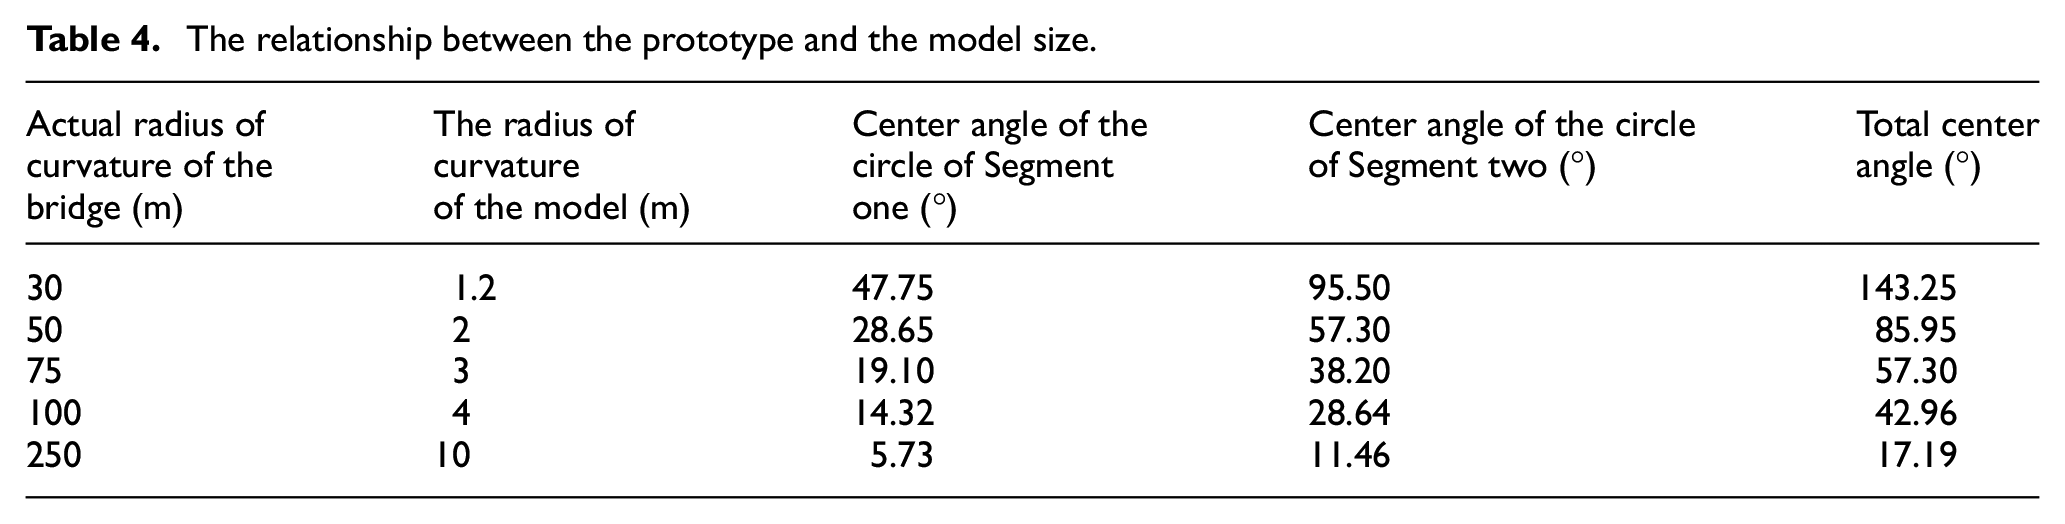
The authors have established numerical models with six different radii of curvature (Figure 13). Table 4 provides a summary of the dimensions of prototype bridges and the corresponding numerical models. The size of the expansion joint gap of the numerical model was set as 4 mm, and the ground motion was inputted from the most unfavorable direction (discussed in section 2.3).
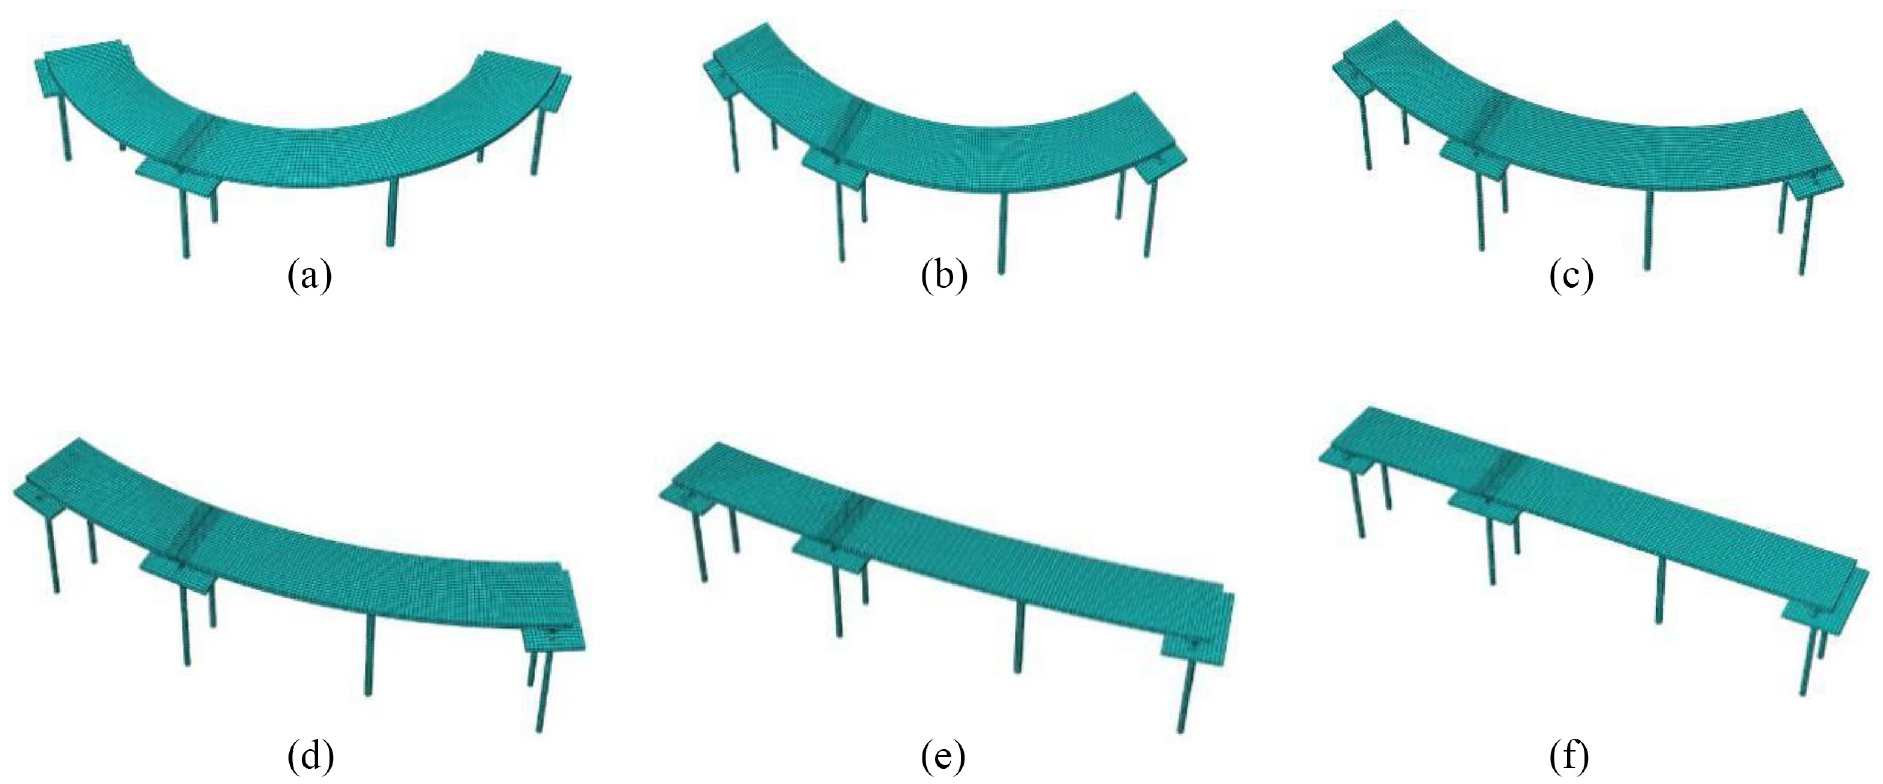
The bridge models with different radii of curvature: (a) radius of curvature = 1.2 m (subtended angle 143.25°), (b) radius of curvature = 2 m (subtended angle 85.95°), (c) radius of curvature = 3 m (subtended angle 57.3°), (d) radius of curvature = 4 m (subtended angle 42.96°), (e) radius of curvature = 10m (subtended angle 17.19°), and (f) radius of curvature = 0m (subtended angle 0°).
The relationship between the prototype and the model size.
The influence of the radius of curvature on the seismic response of the curved bridges
Figure 14 shows the relationship between the peak pounding force at the expansion joint and the curvature radius of the bridges. The observation shows that, when the curvature radius of the bridges was less than 100 m while the total subtended angle was larger than about 40°, the pounding force gradually decreases as the subtended angle increases. Besides, when the curvature radius was greater than 100 while the subtended angle was between 0° and 40°, the pounding force increases as the subtended angle increases. Figure 15 shows the stress contour plot of the contact stress at the expansion joint of the bridge.
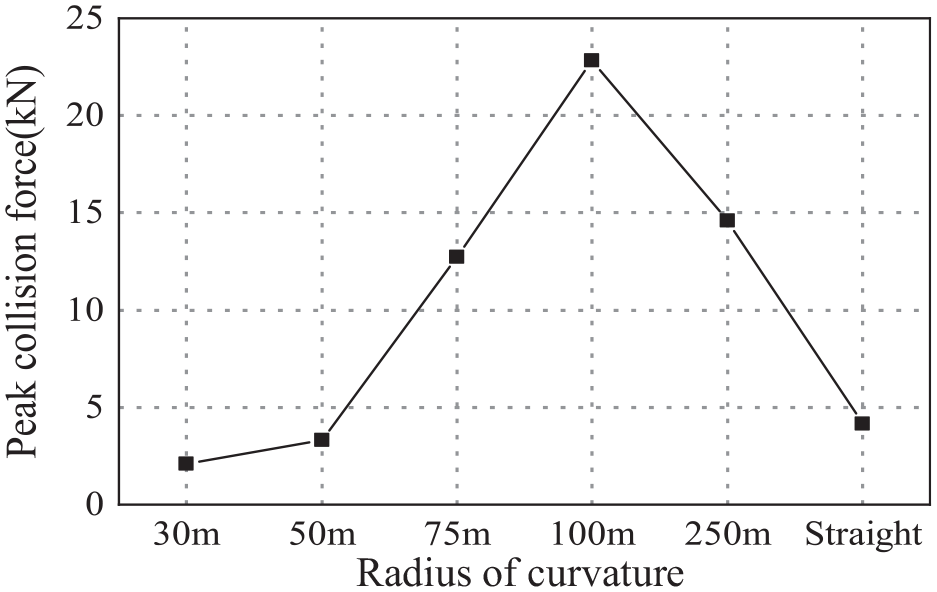
Peak pounding force versus the radius of curvature.
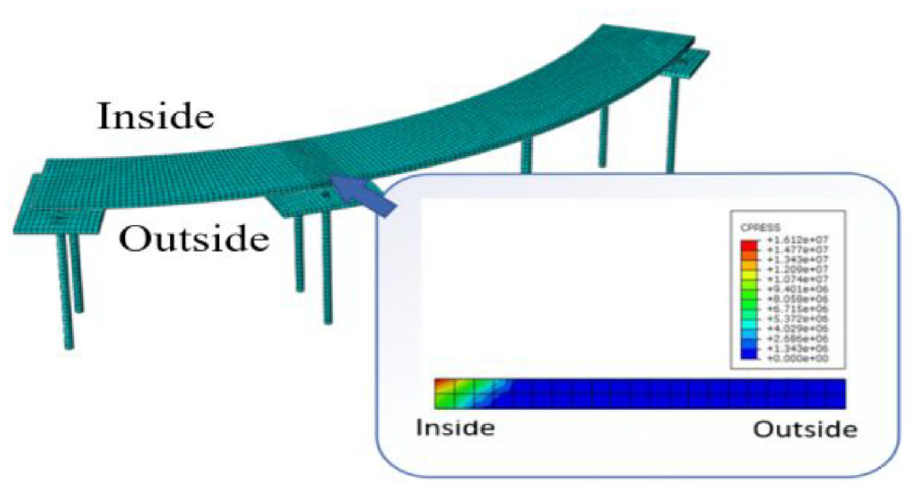
Stress contour plot of the peak contact stress of a curved bridge with a radius of curvature 75 m (t = 3.069 s).
Figure 16 shows the relationship between the radius of curvature and the displacement and force demands on the curved bridge. N1–N4 in Figure 16(a) and (b) denote the four corners of the bridge’s deck at the expansion joint, as shown in Figure 17. Figure 16(a) and (b) shows that the curvature radius of the bridge has a relatively small influence on the tangential displacement at the four corners. The induced difference was within 33%. In general, as the radius of curvature decreases, the tangential displacement at the corners slightly decreases, indicating that the pounding between adjacent girders has a constraining effect on the tangential movement of the bridges’ deck. Such an effect always increases as the radius of curvature decreases. Compared with the tangential displacement, the curvature radius has more impacts on the radial displacement. Results show that the radial displacement changed abruptly when the radius of curvature was larger than 100 m. When the radius of curvature is 100 m, the maximum radial displacement at the corners has reached approximately 4.5 times that of the straight bridge. As shown in Figure 16(c) and (d), the torsional response of the main girder changed significantly with the radius of curvature. Compared with the straight one, the horizontal and vertical rotation of the model with the radius of curvature of 30 m are up 22.4 times and 18.3 times, respectively. Overall, as the radius of curvature decreases, the horizontal and vertical torsional responses significantly increases, which could be detrimental to the structure.
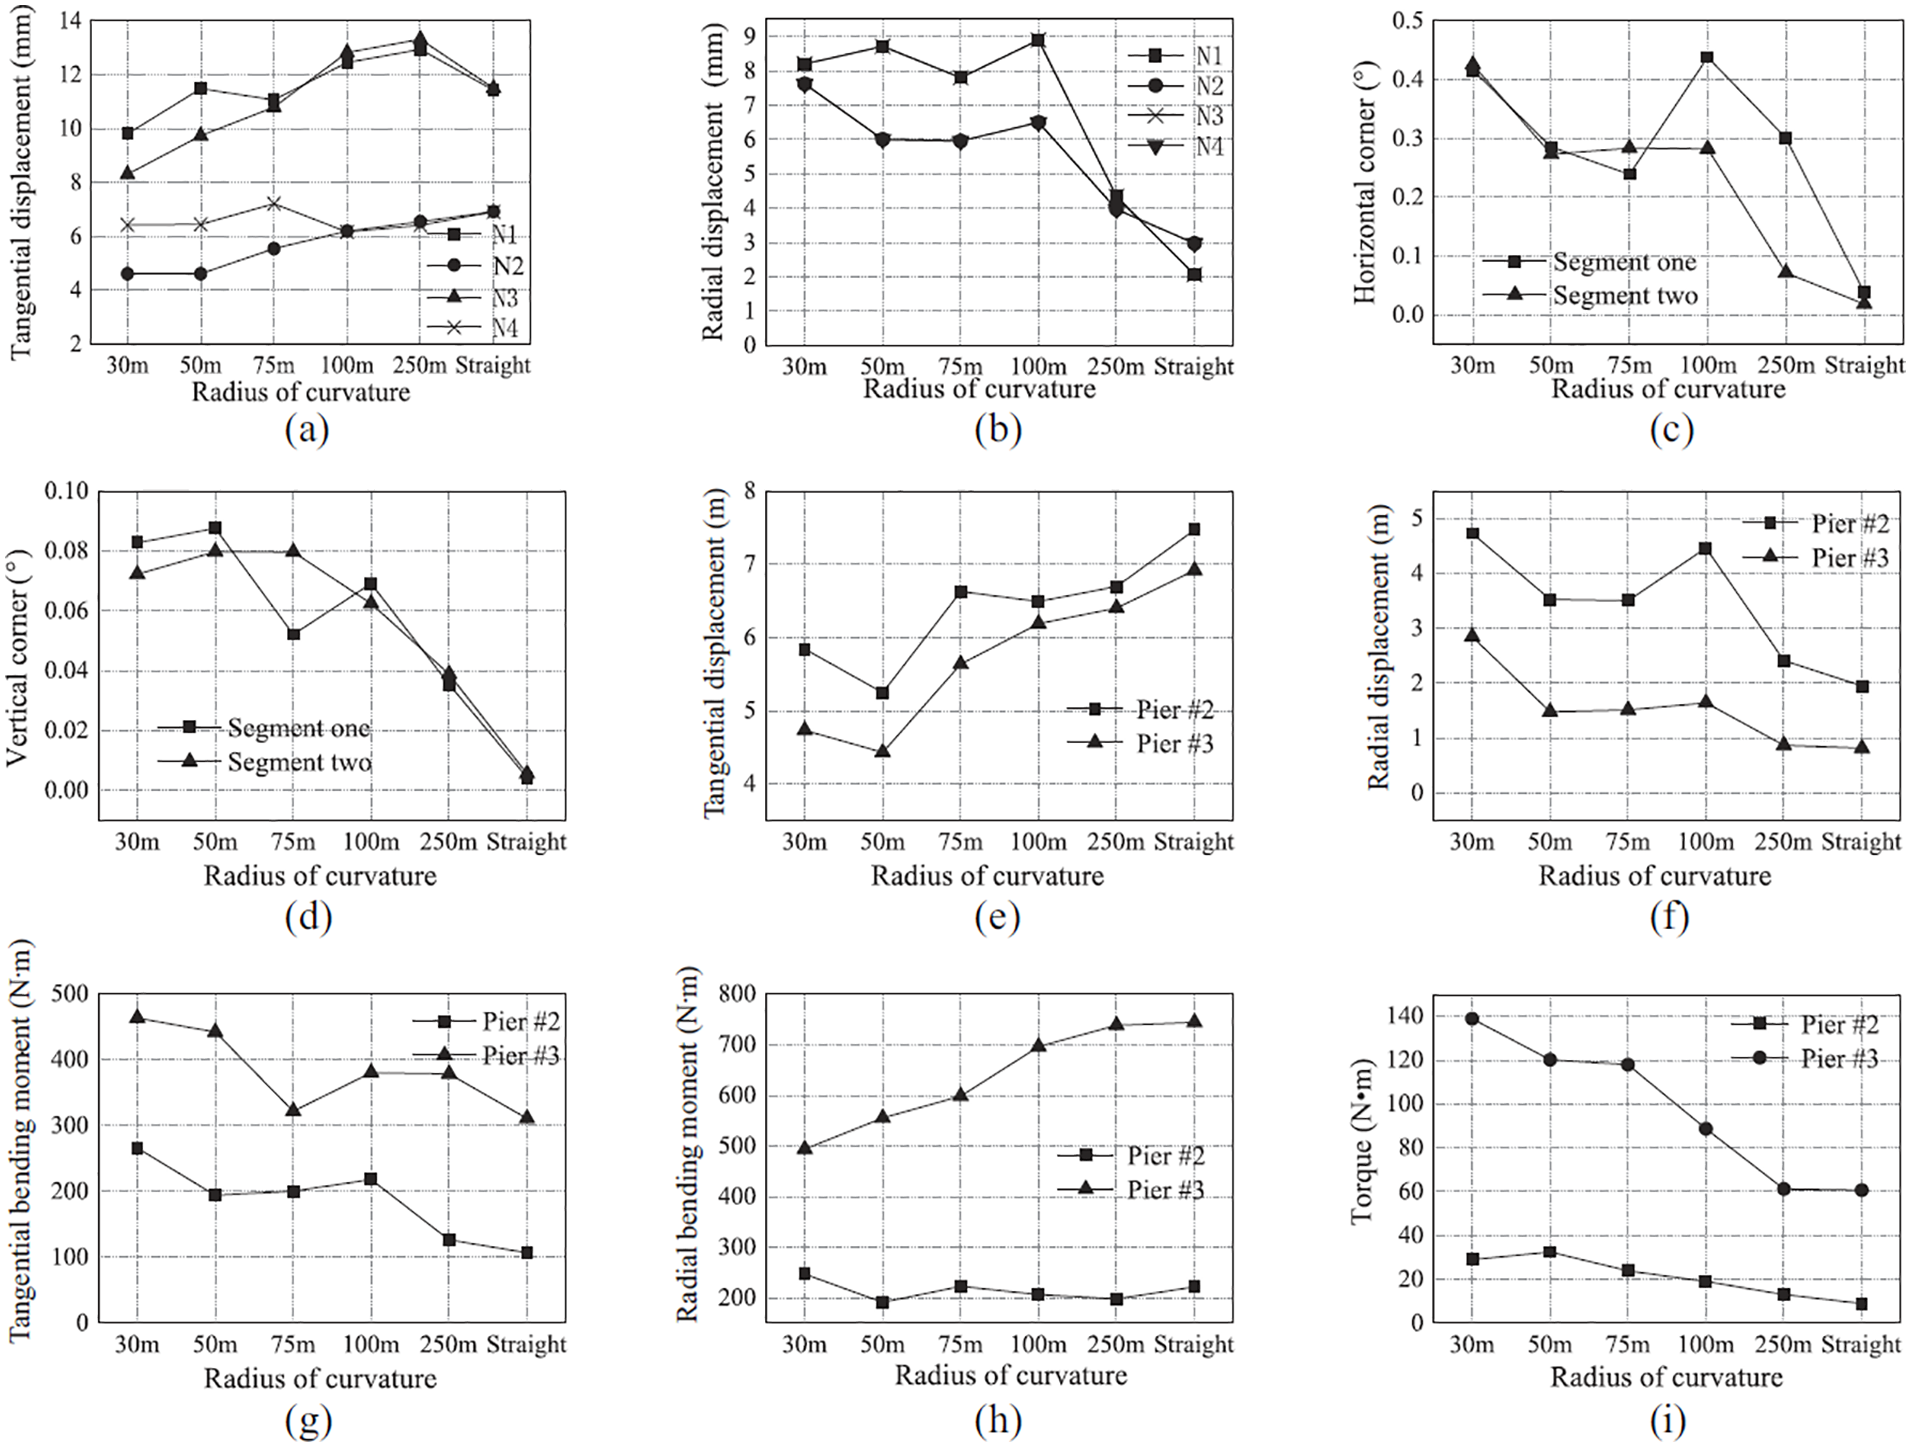
The responses of the curved bridge under different radii of curvature: (a) maximum tangential displacement at the pounding end of the girder, (b) maximum radial displacement at the pounding end of the girder, (c) horizontal rotation of the girder, (d) vertical rotation of the girder, (e) tangential displacement on top of the pier, (f) radial displacement on top of the pier, (g) the tangential bending moment around the bottom of the pier, (h) the radial bending moment around the bottom of the pier, and (i) torque at the bottom of the pier.
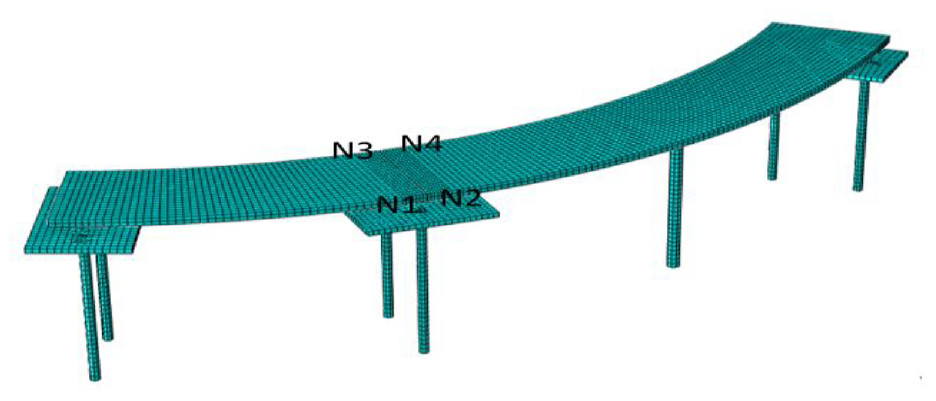
The four corners of the bridge’s deck at the expansion joint.
Figure 16(e)–(i) shows the responses of the piers under different radii of curvature. The results show that the tangential displacement of the top of the piers increases as the radius of curvature increases. In contrast, the radial displacement of the top of the piers decreased as the radius of curvature increased. It can be concluded the decrease of the curvature radius will increase the irregularity of the bridge, which means the unidirectional excitation will cause the bidirectional response. Besides, as Pier #3 was integrated into the bridge’s deck, the tangential displacement and radial displacement at the top of Pier #3 were smaller than that of Pier #2. The tangential moment demand at the bottom section of Pier #2 and Pier #3 decreased as the radius of curvature increased. In addition, the radial moment demand at the bottom of Pier #3 increased as the radius of curvature increased, and the radial moment demand at the bottom section of Pier #2 was not affected by the change of the radius of curvature. The torque at the bottom of Pier #2 and Pier #3 decreased as the radius of curvature increased, which proved that a decrease in the radius of curvature will significantly increase the torsional response of the structure. In addition, compared with Pier #2, the force demands on Pier #3 were larger; therefore, it should be carefully designed.
The effect of the longitudinal slopes on the structural response
Figure 18 shows the established numerical models with different longitudinal slopes (i.e. 0.3%, 1%, 2.5%, 5%, and 7%). The curvature radius of the superstructure was 50 m, and the near-fault non-pulse-like Chi-Chi earthquake record was used for the analysis. The difference in the structural response caused by the pounding was measured using the change coefficient of structural response from equation (1).
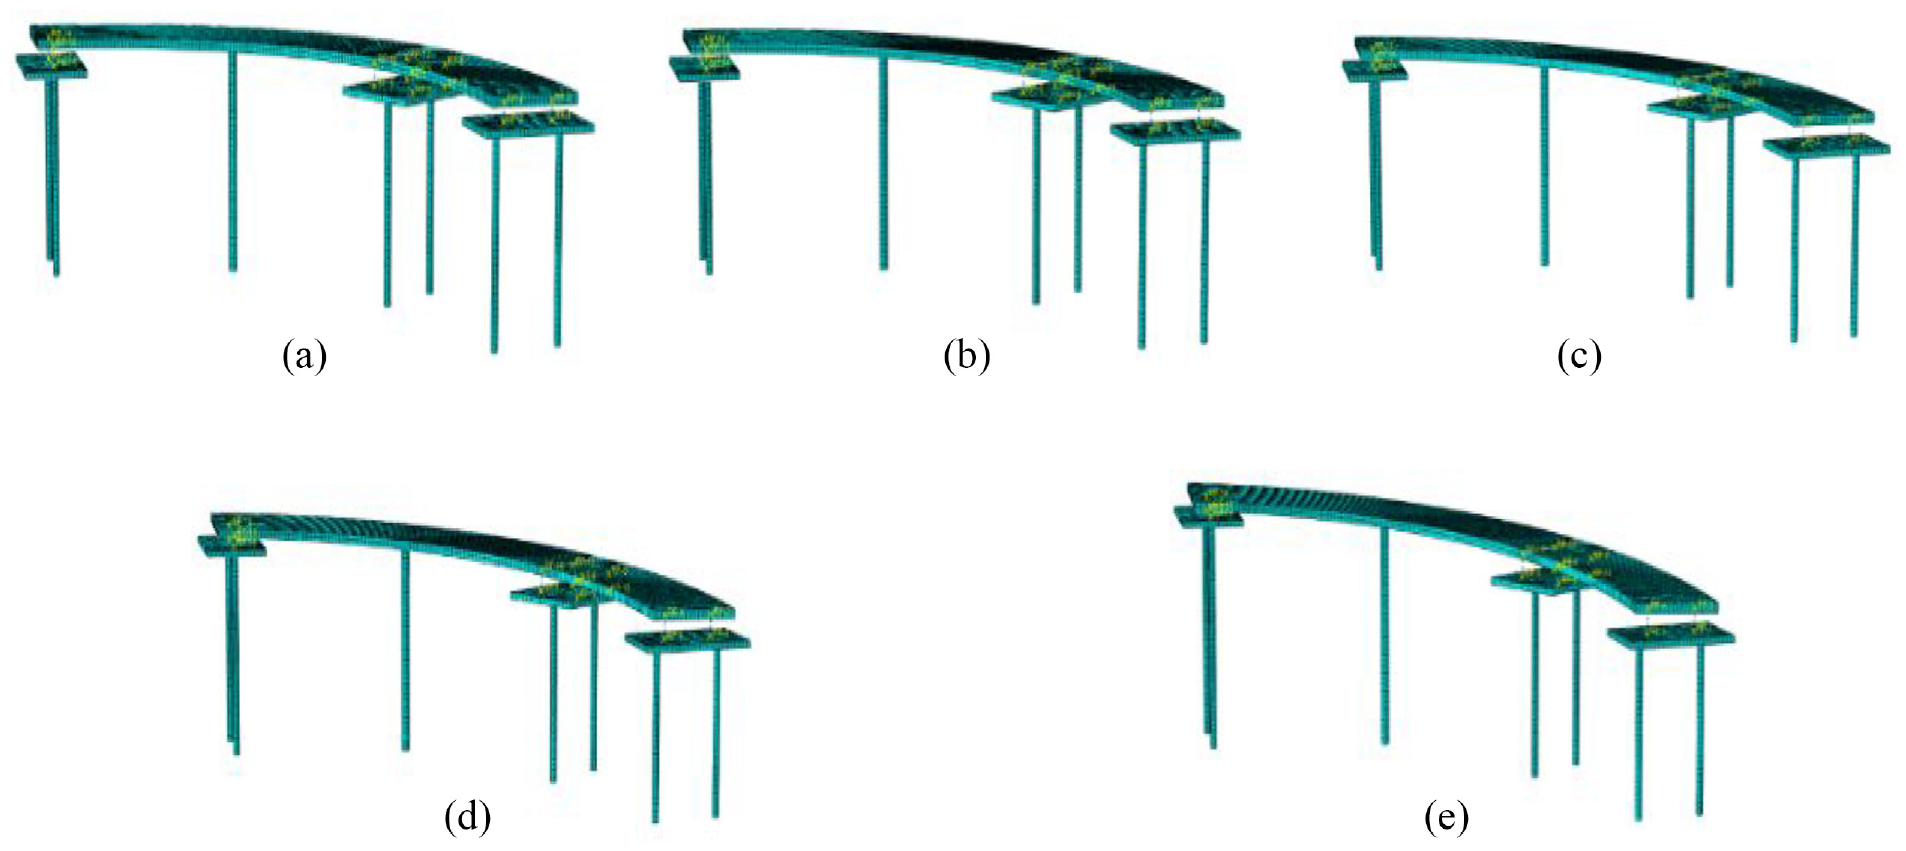
Finite element models: (a) longitudinal slope of 0.3%, (b) longitudinal slope of 1%, (c) longitudinal slope of 2.5%, (d) longitudinal slope of 5%, and (e) longitudinal slope of 7%.
Impact of different longitudinal slopes on the seismic response of the bridge
As shown in Figure 19, as the longitudinal slope of the bridge deck increased, the peak impact force at the expansion joint of the superstructure gradually decreased. Figure 20 shows the stress contour plot at the expansion joint of the bridge.
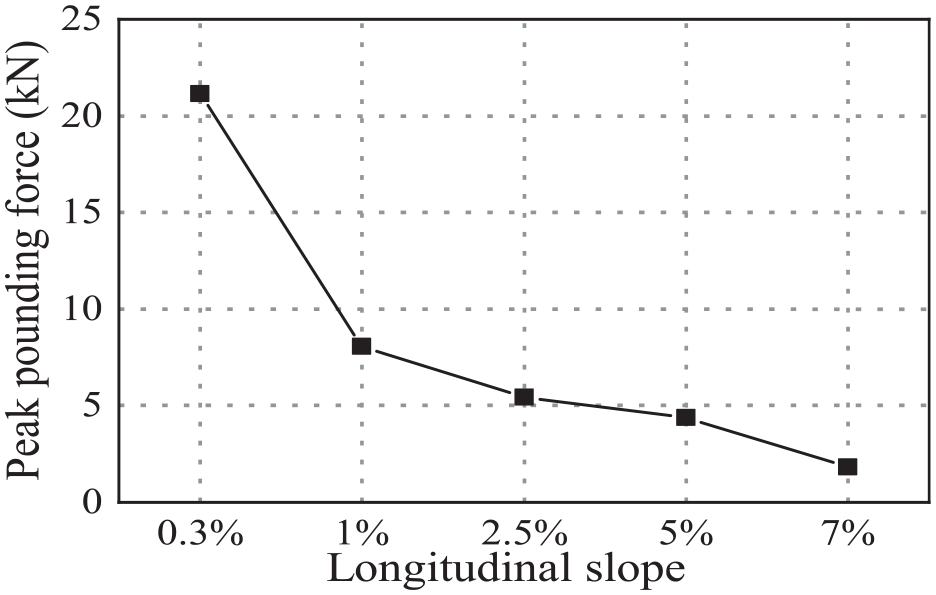
Peak pounding forces versus the different longitudinal slopes.
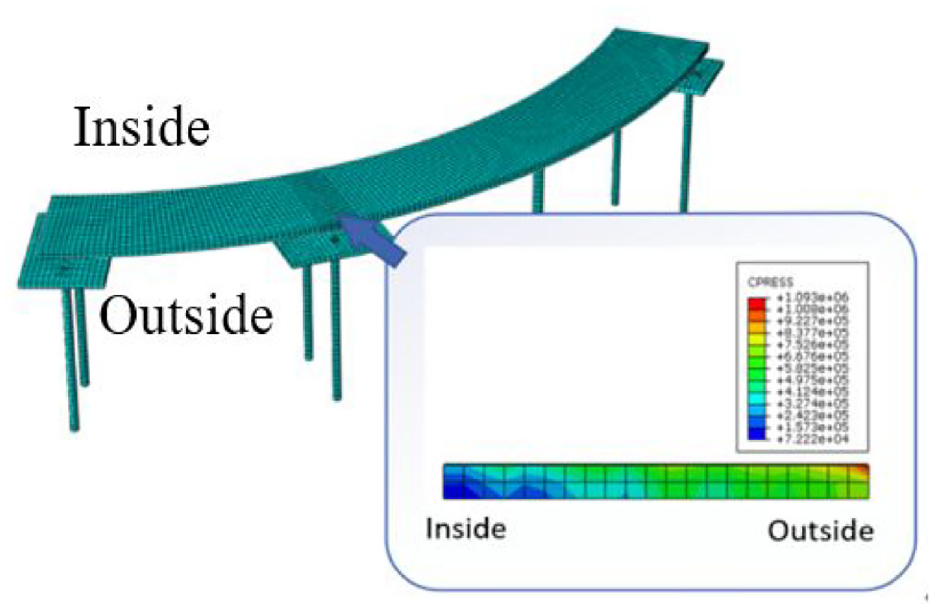
The stress contour plot of the continuous girder section with a longitudinal slope of 2.5% (t = 3.087 s).
Figure 21(a) and (b) shows that, under the non-pulse earthquake action of the non-pulse-like Chi-Chi near-fault, the tangential displacement of the four corners at the expansion joint gradually increased as the longitudinal slope increased. When the slope changed from 0.3% to 5%, the tangential displacement rised slightly, with a varied range of no more than 6.7%. However, the tangential displacement increased significantly (a maximum increase of 49%) when the slope changed from 5% to 7%. Such observations indicate that the girder is more likely to fall under the action of an earthquake. The seismic design should pay more attention to avoid bridge collapse under such circumstances. The longitudinal slope had a small influence on the radial displacement of the right joint (N2 and N4), and the induced difference was within 15%. It can be conclude that with the increase of the longitudinal slope, the center of gravity of the girder is shifted, which leads to the increase of the tangential displacement of the bridge. At the same time, the period difference between the continuous girder segment and the simply supported girder becomes smaller, which reduces the impact force at the end of the girder, as shown in Figure 19.
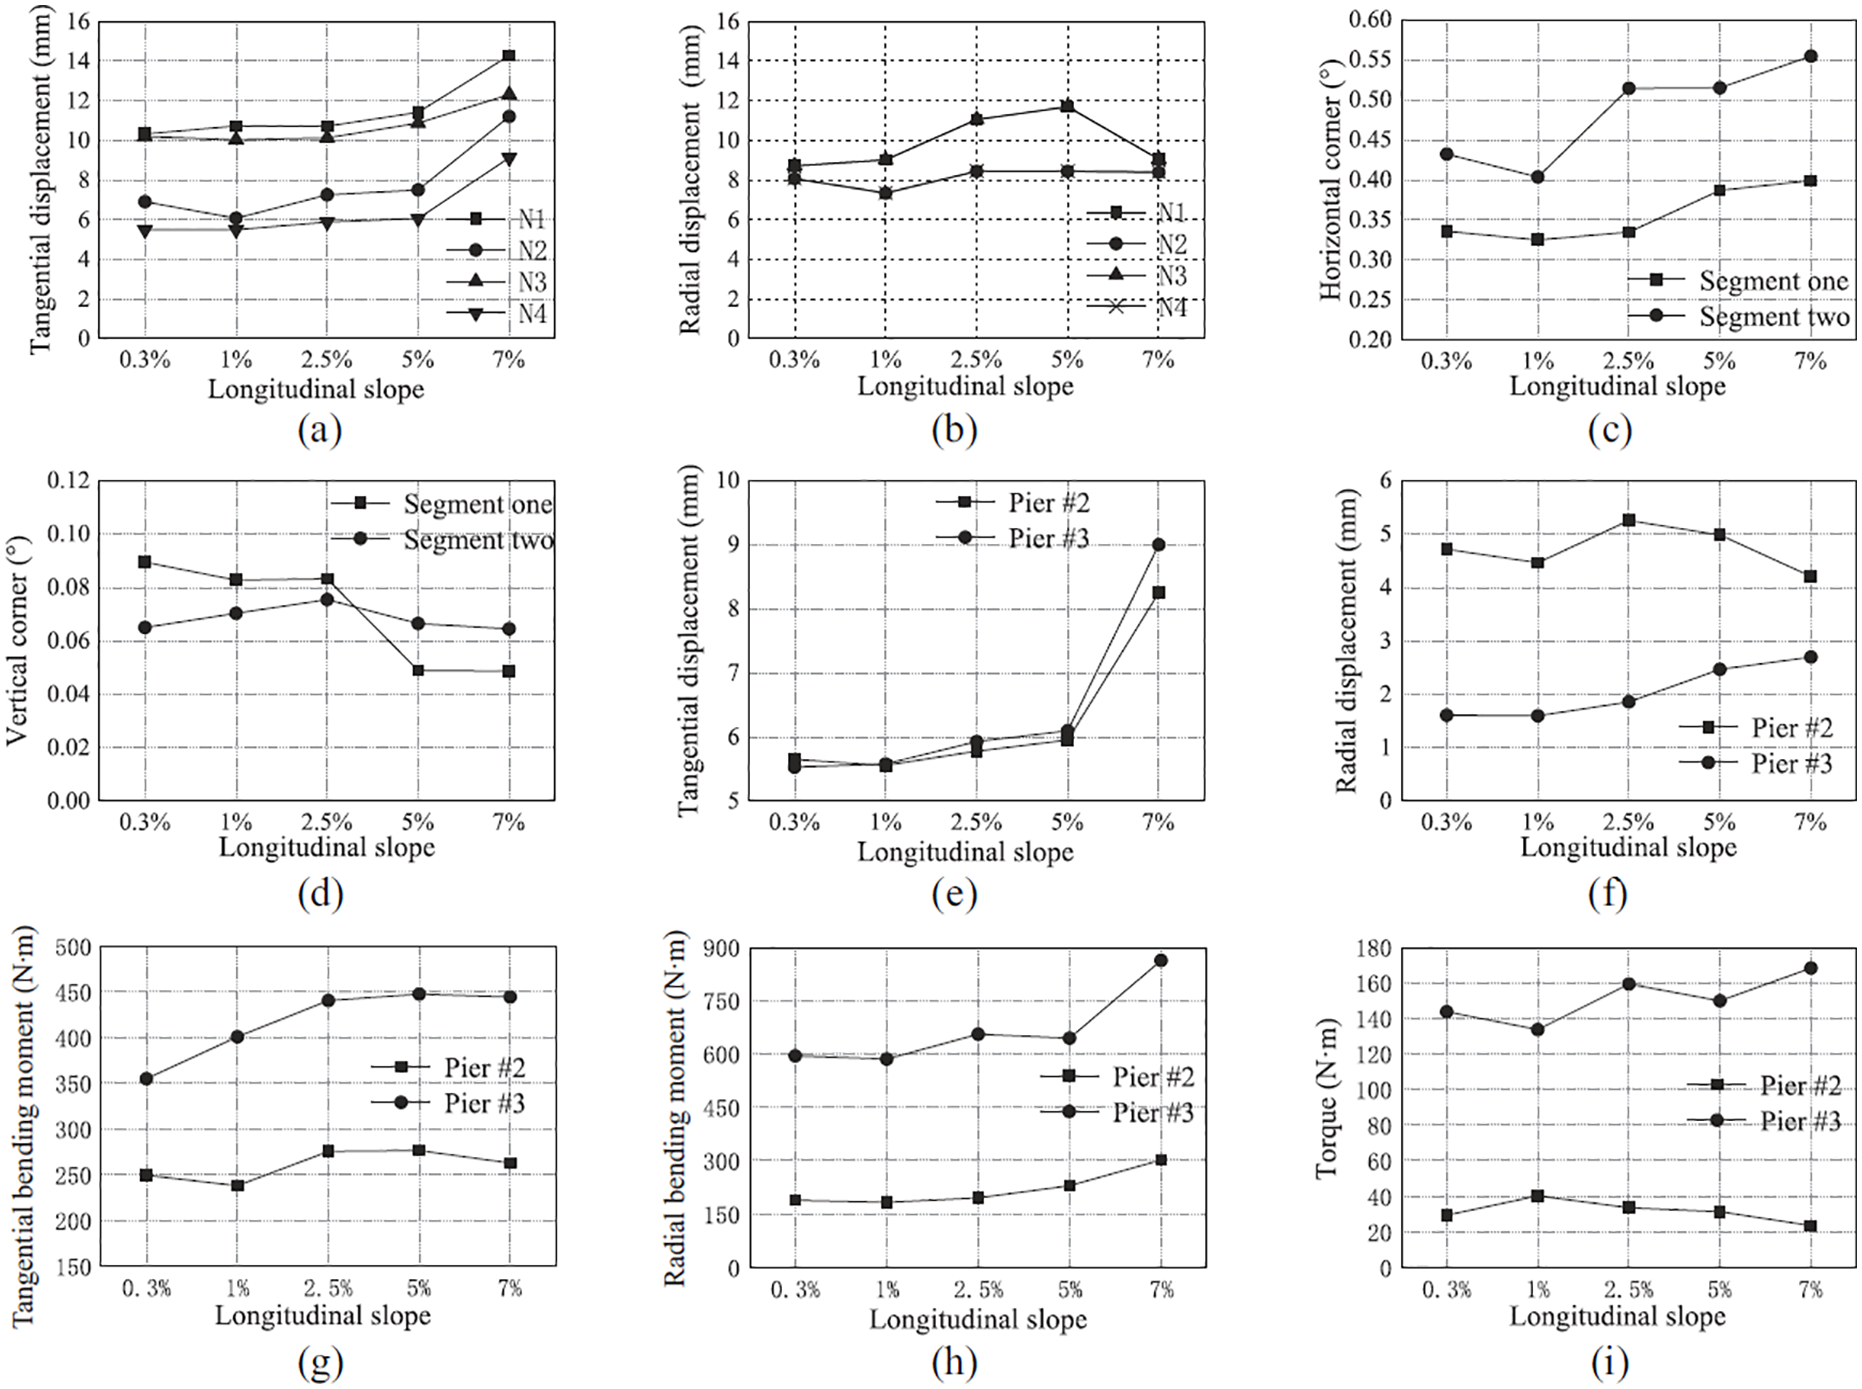
Responses of the curved bridge for different longitudinal slopes: (a) maximum tangential displacement at the pounding end of the girder, (b) radial displacement of the girder pounding end node, (c) horizontal corner of the girder, (d) vertical corner of the girder, (e) tangential displacement of the top of the pier, (f) radial displacement of the top of the pier, (g) tangential bending moment around the bottom of the pier, (h) radial bending moment around the bottom of the pier, and (i) torque at the bottom of the pier.
Figure 21(c) and (d) shows that: (1) with the increase of the longitudinal slope of the bridge’s deck, both the horizontal rotations at corners of the simply-supported segment and the continuous segment increased, indicating that an increase in the longitudinal slope will mitigate the torsional response in the horizontal plane of the structure, and (2) the vertical torsional response of the simple support of segment 1 gradually decreased as the longitudinal slope increased, and the vertical corners of the continuous connection of segment 2 were not affected by a change in the longitudinal slope.
Figure 21(e)–(i) shows the variation in the piers’ response to the different longitudinal slopes; the results have shown that the tangential displacement of the top of Pier #2 and Pier #3 increased as the longitudinal slope increased. The change was consistent with that of the tangential displacement of the pounding end of the girder. When the longitudinal slope changed, the connection form of the pier and the girder was different, and the radial displacement response of the top of the pier was also different. The radial displacement at the top of Pier #3 (pier and girder consolidation) gradually increased as the longitudinal slope increased. The radial displacement of the top of Pier #2 (pier and girder support connection) showed no obvious regularity as the longitudinal slope changed. At the same time, the overall fluctuation was small, and the difference was within 15%. For different longitudinal slopes, the radial displacement response of Pier #2 was 1.6 to 2.9 times that of Pier #3.
The tangential bending moment at the bottom section of Pier #2 increased as the longitudinal slope of the bridge’s deck increased. In contrast, the tangential bending moment around the bottom of Pier #3 did not change with the longitudinal slope. Besides, the overall difference was within 14%; therefore, it can be considered that the change in the longitudinal slope had a small impact on the tangential bending moment. However, the radial bending moment around the top of Pier #2 and Pier #3 increased as the longitudinal slope increased by different degrees, and the increase for Pier #2 was relatively large, and Pier #3 was also relatively large, while the variation range for the piers was slightly flat. With the continuous increase in the longitudinal slope, the torque at the bottom of Pier #3 showed an increasing trend in its fluctuation; this was consistent with the change rule of the right horizontal angle. A change such as this indicates that an increase in the longitudinal slope caused a rise in the continuous torsion effect; this will harm the internal force response of the structure. Results suggest that the torque at the bottom of Pier #2 changed only a little as the longitudinal slope changed. When the longitudinal slope continued to increase, the torque at the bottom of the pier slightly decreased with a maximum reduction of 20%. In addition, the increase in the horizontal torsional angle of the segment one superstructure did not have a significant influence on the bottom torque of the substructure due to the existence of the support. In general, an increase in the longitudinal slope increased the bending moment at the bottom of the pier, which harmed the internal force response at the bottom of the pier. It would be easy for damage to occur at the bottom of the pier under an earthquake. It is thus necessary to pay careful attention to such situations during the seismic design.
Discussion
The effects of pounding under different radii of curvature
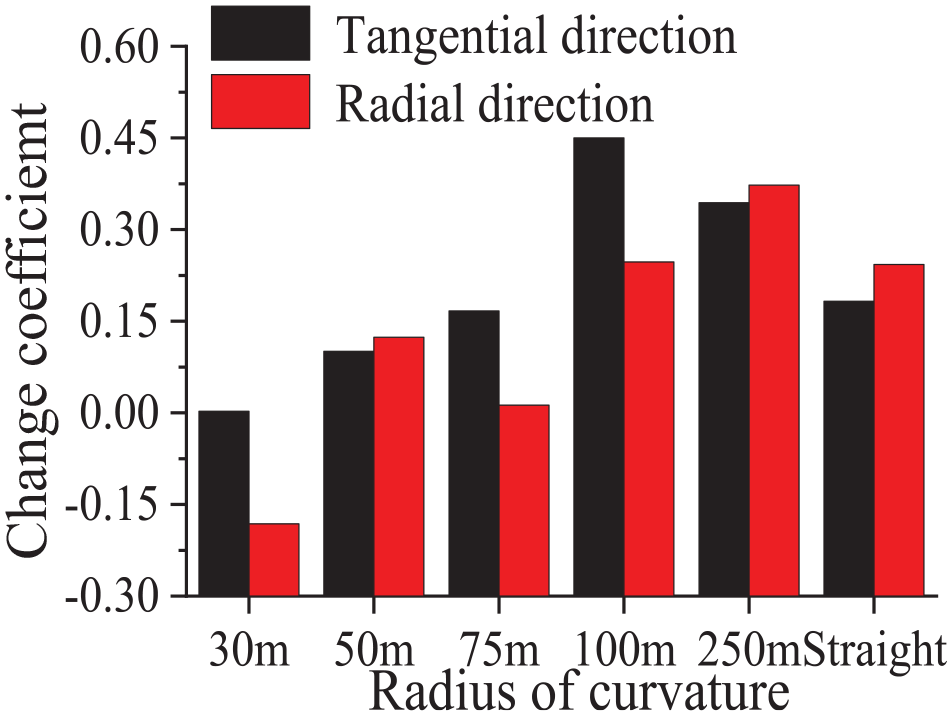
Figure 22 shows that the pounding has a noticeable limiting impact on the relative tangential displacement at the expansion joint. Compared with the curved bridges, the pounding effect for the straight bridge on the relative tangential displacement of the main girder was more pronounced. Besides, the movements of the inner corners (i.e. N3 and N4) in the tangential direction were less constrained by the pounding, compared with that of the outer corners (i.e. N1 and N2). Results show that the impact of the straight-line bridge had the most restrictive effect on the relative tangential displacement of the main girder; this reached 46% of the relative tangential displacement of the main girder without any impact. As shown in Figure 23, the change coefficients ψ were all greater than zero, which indicates that the pounding of adjacent girders had a significant influence on the relative radial displacement. As the radius of curvature increased, the effect of pounding on the relative radial displacement rapidly increased. The maximum increment became 5.8 times the relative radial displacement of the structure when the impact was not considered. Such observations could result in transverse unseating of the deck and pounding between the stopper and the girder.
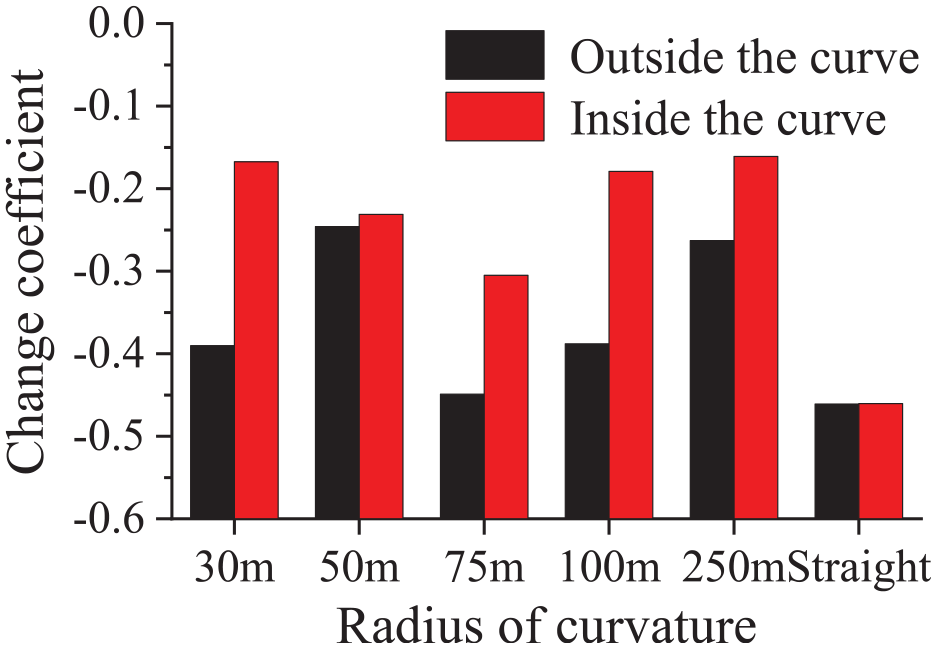
Relative tangential displacement of the girder.
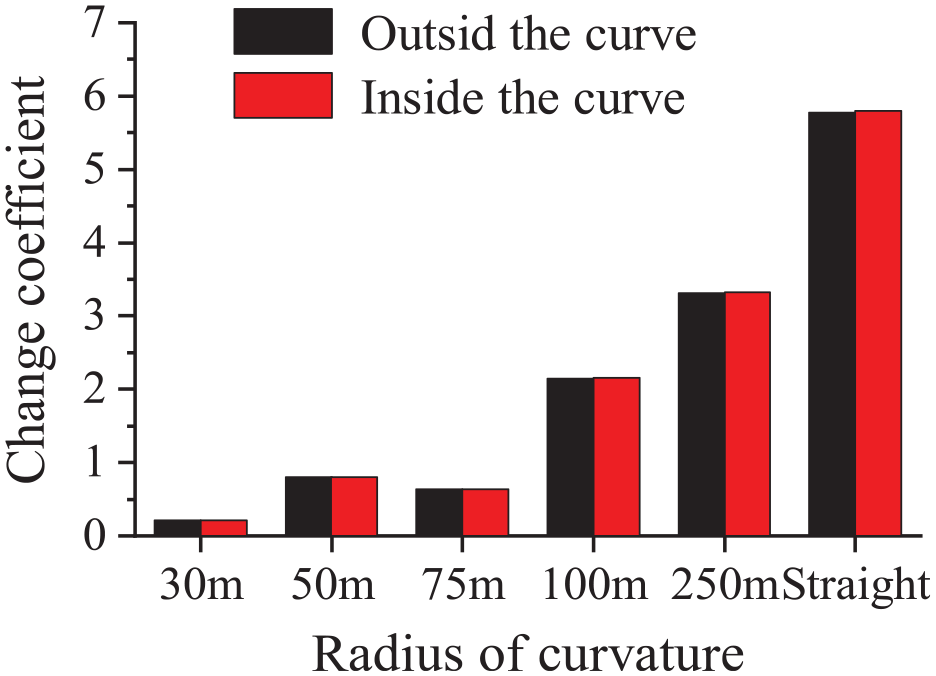
Relative radial displacement of the girder.
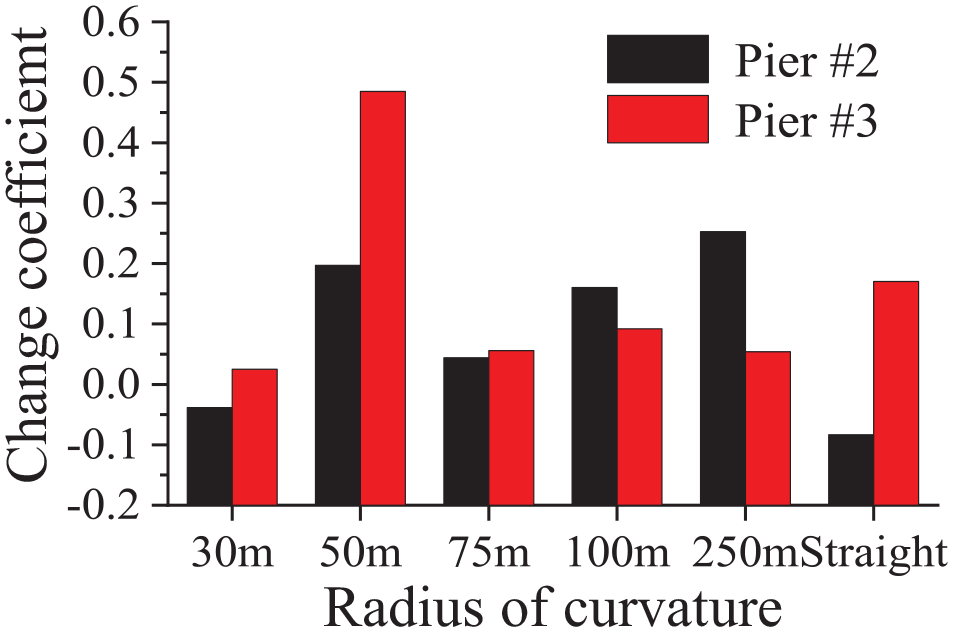
Figures 24 to 26 indicate that: (1) in addition to the tangential moment at the bottom of the pier with a radius of curvature of 100 m, the pounding between adjacent girders could reduce the moment demand at the bottom of Pier #2 (the connection to the support of the transition pier’s beam), especially the radial bending moment; (2) with the increase of the radius of curvature, the bending moment (consolidation of the pier’s beam) at the bottom of Pier #3 increased to varying degrees, with a maximum increase of 45% compared with that without pounding; (3) for the different radii of curvature, the torque at the bottom of the pier increased by 48% compared with that without pounding.
Bending moment change of the bottom of Pier #2.
Bending moment change of the bottom of Pier #3.
Torque change at the bottom of the piers.
The effects of pounding for different longitudinal slopes
Figures 27 and 28 have shown the variation in the relative displacement at the corners of the bridge’s deck for the different longitudinal slopes. When the radius of curvature was 50 m, with the continuous change of the longitudinal slope, the pounding had a constraining effect on the relative tangential displacement of the main girder. It also had a relatively small constraining impact on the inner side of the curve and a relatively sizeable restraining effect on the outer side of the curve. Therefore, the structure may suffer tangential unseating of the girder from the inner side of the curve first during a strong earthquake. With the increase in the longitudinal slope of the bridge’s deck, the growth of the relative radial displacement of the girder firstly increased and then decreased. The pounding had a more significant influence on the relative radial displacement of the girder since the change coefficients are all larger than zero. The maximum increase occurred when the longitudinal slope was 2.5%; this increase was twice the relative radial displacement of the girder without pounding.
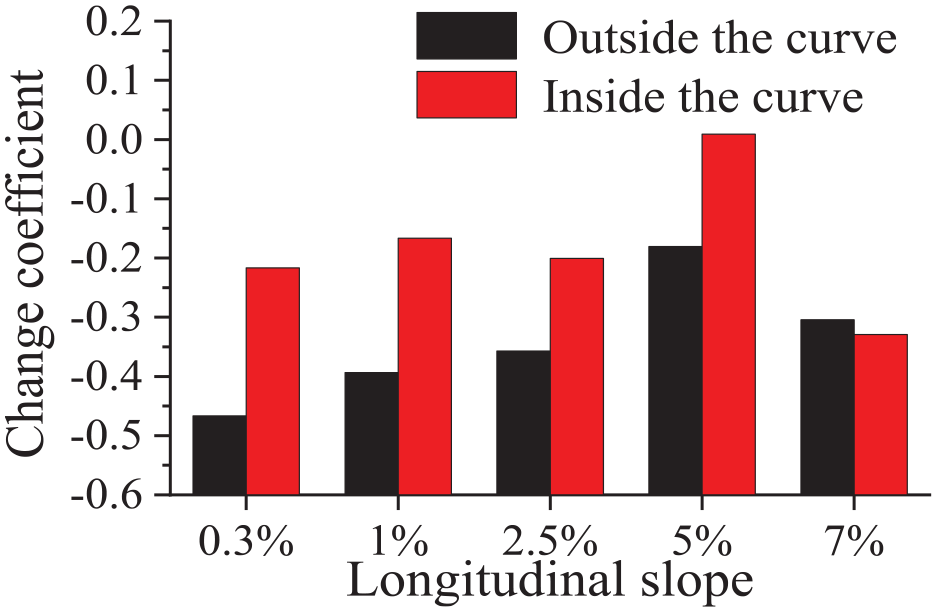
Relative tangential displacement of the main girder.
Relative radial displacement of the main girder.
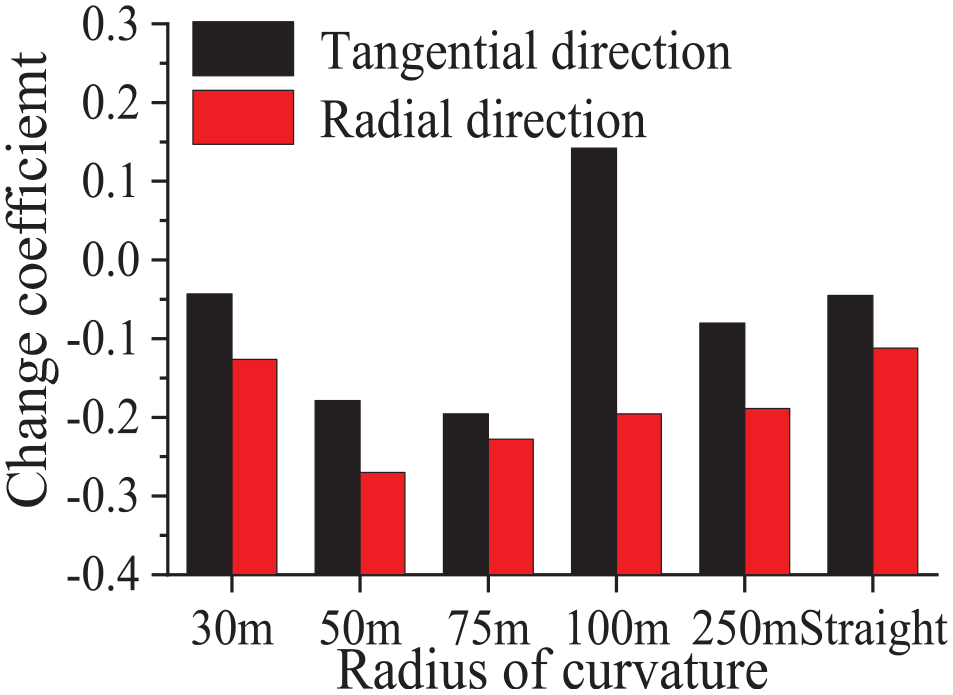
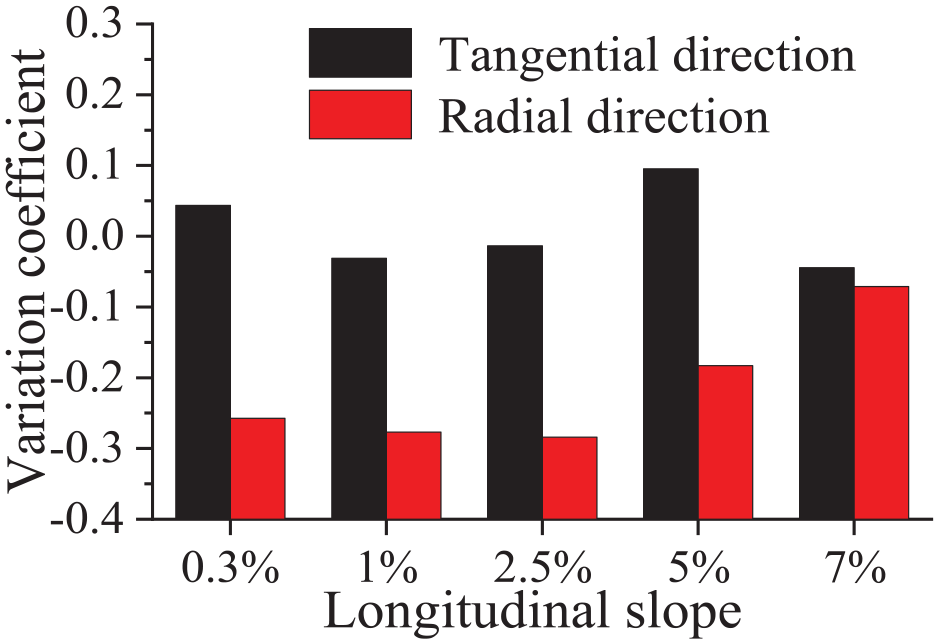
Figure 29 shows that the tangential bending moment at the bottom of Pier #2 either increased or decreased slightly with an increase in the longitudinal slope, with the difference being within 13%. While the radial bending moment at the bottom of the pier was restrained by the pounding effect, this gradually decreased with the increase in the longitudinal slope. Compared with the radial bending moment at the bottom of the piers, the tangential bending moment at the bottom of Pier #2 was affected less by the pounding since the change coefficients were relatively close to zero.
Change of bending moment at the bottom of Pier #2.
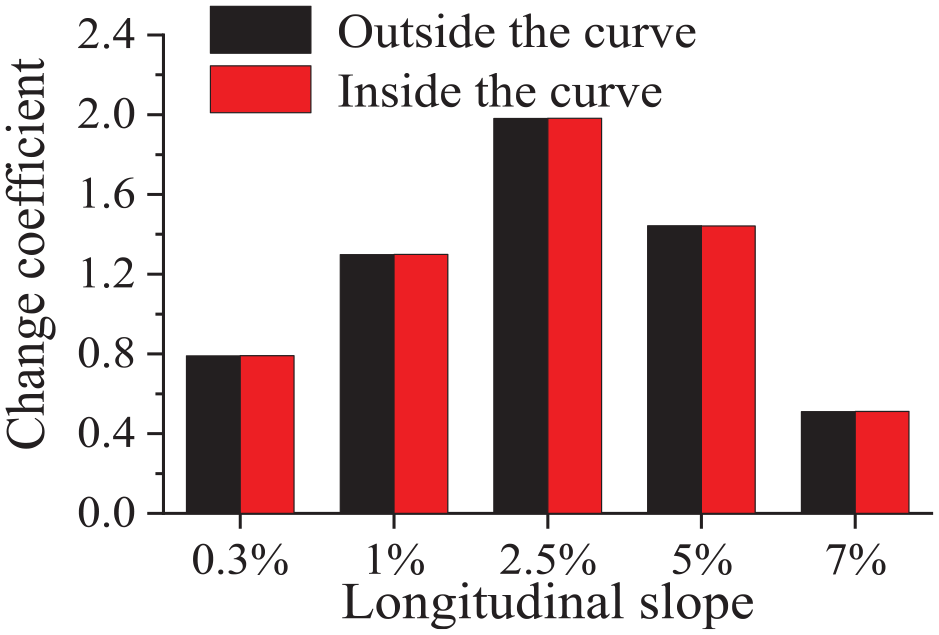
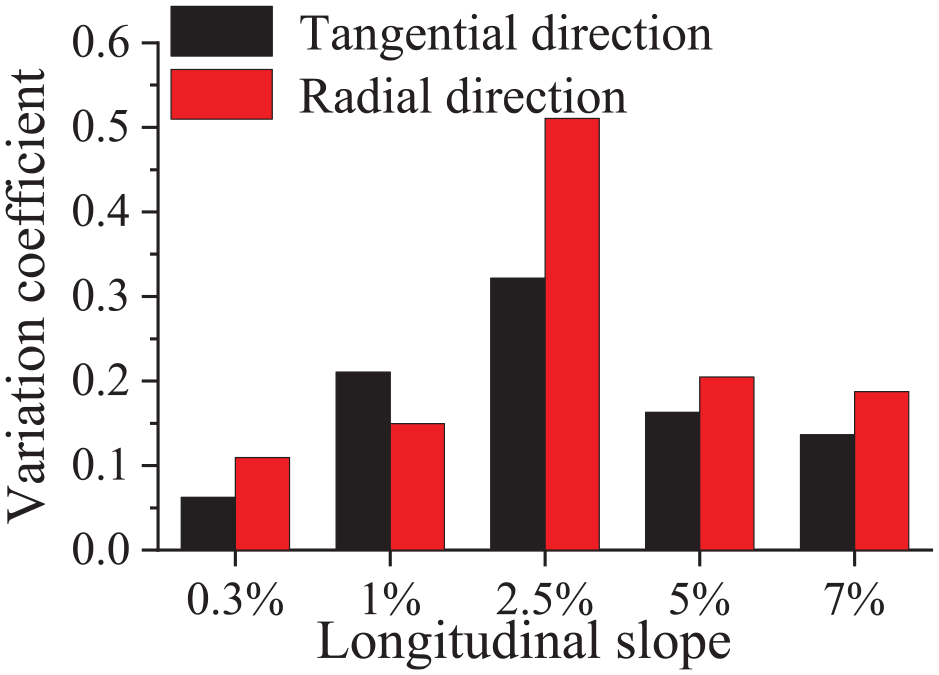
Figure 30 shows that in the case of a longitudinal slope of 2.5%, the values of the tangential and radial bending moments at the bottom of Pier #3 were significantly increased with changes of 32% and 51%, respectively comparing to the responses without considering pounding. Besides, the difference in the bending moment at the bottom of Pier #3 first increased and then decreased as the longitudinal slope increased. The maximum increase in the bending moment at the bottom of piers was 51%. The results show that the pounding contributed to the rise of the torque at the bottom of the pier. Figure 31 shows that the maximum increase in the torque at the bottom of piers could reach 60% of the torque at the bottom of the pier without pounding. The increase in the torque at the bottom of the pier, for a longitudinal slope of 7%, was relatively less than that in other cases. These results indicate that the pounding effect will aggravate the torsional response of the structure, thus causing the seismic performance of the structure to deteriorate.
Change of bending moment at the bottom of Pier #3.
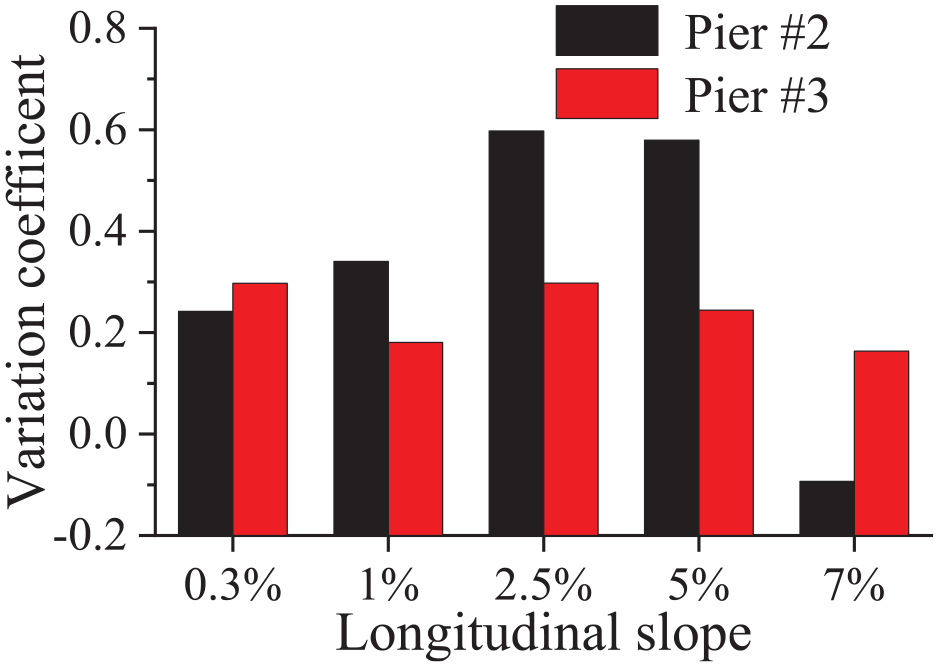
Change of torque at the bottom of the piers.
Local damage caused by pounding of different curved bridges
In order to better capture the highly nonlinear behavior within the pounding region, the mesh of the bridge’s deck near the expansion joint was refined, as shown in Figure 5. The numerical models were excited by ground motions inputted using the most unfavorable direction and the contact stress across the contact surface was obtained at the peak pounding force. In order to better quantify the non-uniform distribution of the pounding across the contact surface, the non-uniform pounding coefficient could be defined as follows:

where, η is the non-uniform pounding coefficient;
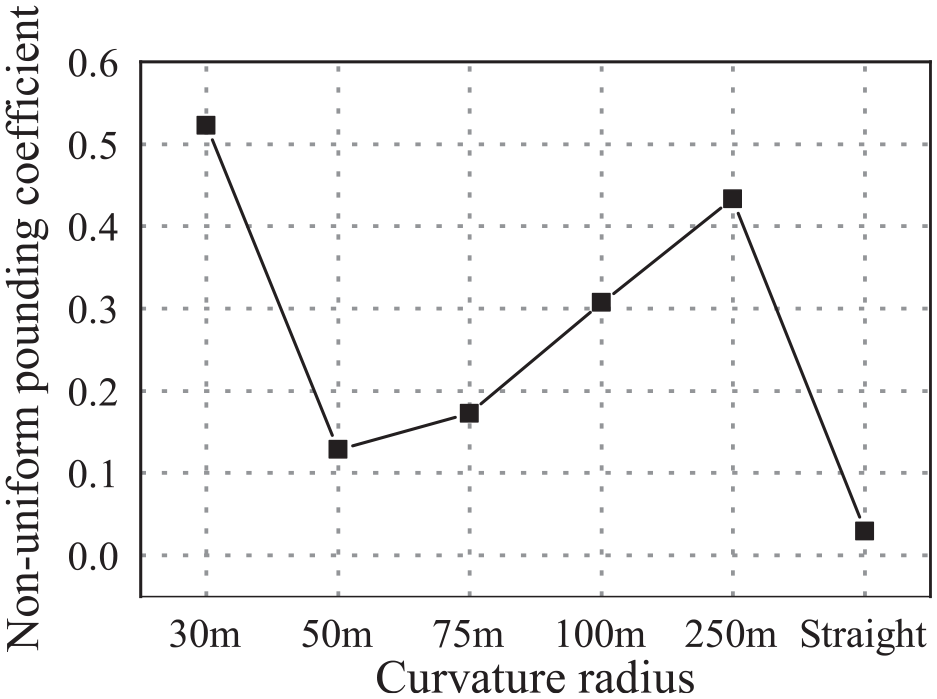
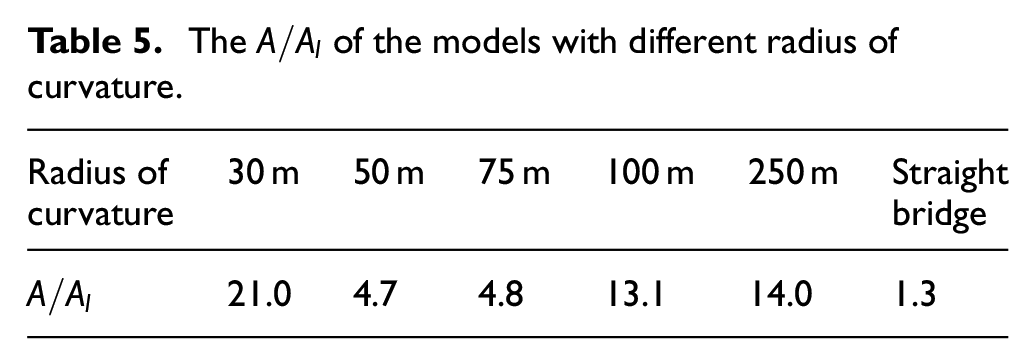
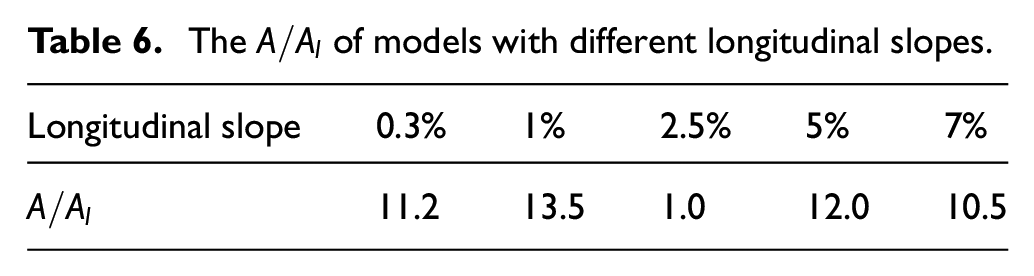
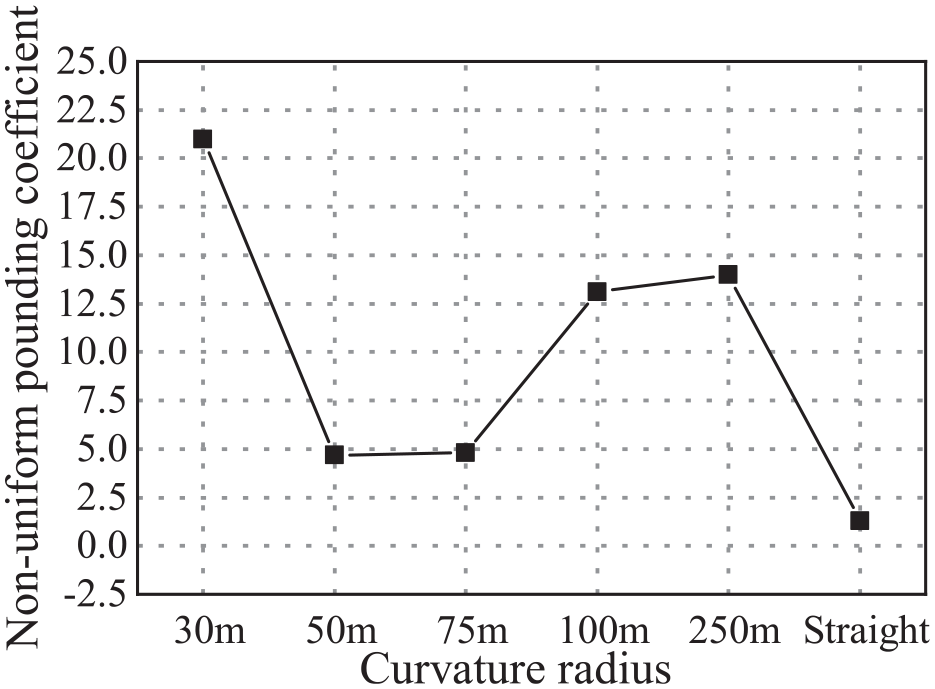
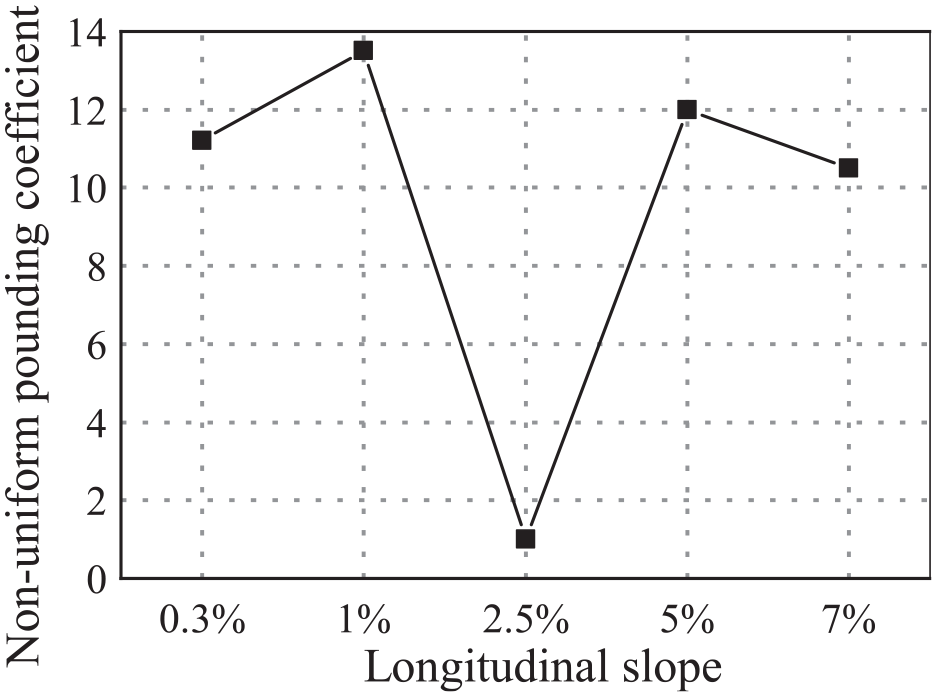
Figure 32 shows the variation of η with the radius of curvature. With the change in the radius of curvature, the non-uniform pounding coefficient of the expansion joint of the girder fluctuated considerably, and there was no noticeable change rule. However, the degree of the non-uniform pounding of the curved bridge was greater than that of the straight bridge. The maximum value of the non-uniform pounding coefficient of the curved bridge for different curvature was ten times that of the straight bridge. The pounding between adjacent girders of the straight bridge under the action of an earthquake was not even, but the degree of unevenness was low. Figure 33 shows the variation η against the longitudinal slope of the superstructure. The figure shows that the non-uniform pounding coefficient first decreased and then increased with the increase of the longitudinal slope. When the longitudinal slope was 2.5%, the non-uniform pounding coefficient was close to 0, and the contact stress was almost uniformly distributed across the contact surface.
Non-uniform pounding coefficients for different radius of curvature.
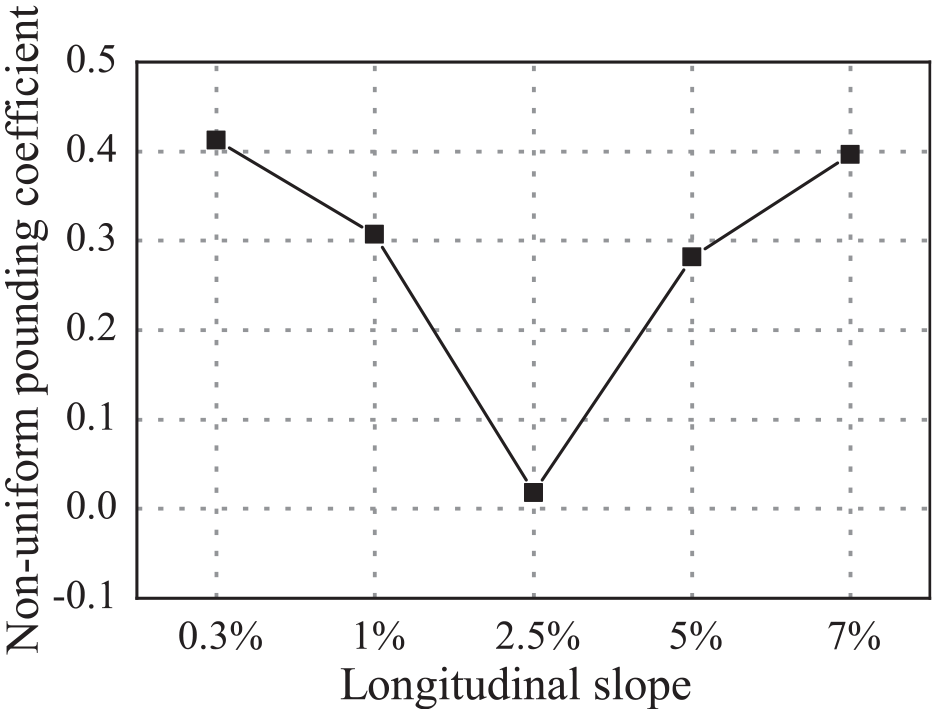
Non-uniform pounding coefficients for different longitudinal slopes.
Although the non-uniform pounding coefficient reflects the non-uniform distribution of the pounding, it cannot be used as an indicator of the damage to the superstructure. The damage of structural components due to pounding is mainly related to the local bearing coefficients
The
The
Changes in the local bearing coefficients for different radius of curvature.
Changes in the local bearing coefficients for different longitudinal slopes.
The results show that the local bearing coefficient correlated well with the non-uniform pounding coefficient. Therefore, the influence of the pounding on the local damage to the expansion joint can be ignored for a low local impact pressure. Otherwise, adequate protective measures should be taken to mitigate the damage to the superstructure of a bridge during earthquakes.
Conclusions
In this paper, a numerical model for bridges with varying horizontal curvatures was developed in ABAQUS. The model is proved to be capable of modeling the seismic pounding between adjacent girders at the location of a bridge’s expansion joint. The authors has validated the simulation results using the dataset collected from the shaking table experiment. A satisfactory agreement was obtained between the numerical simulation and the experimental results. The errors of peak acceleration of the bridge deck and pier top between the numerical analysis and the experimental results are less than 14.9%. The validated numerical model was then used to model the scale model of curved bridges to investigate the influence of the radius of curvature and longitudinal slope on the seismic response of curved bridges with or without taking pounding between adjacent girders into consideration. From the results of the investigations, the following conclusions could be drawn:
In general, pounding between adjacent girders of curved bridges is usually concentrated at the corners of the bridge’s deck near its expansion joint. The peak value of the pounding force first increased and then decreased with the increase of the radius of curvature. The peak pounding force was reached when the radius of curvature was 100 m, and the corresponding center angle was about 40°. With the increase of the longitudinal slope, the peak pounding force gradually decreased.
The radius of curvature had a significant impact on the response of the superstructure and the piers when taking pounding into consideration. The tangential displacement at the corners and the top of the piers increased as the radius of curvature increased. These changes indicate that the pounding effect between adjacent girders had a constraining effect on the tangential displacement. In addition, the variation in the radial displacement concerning the radius of curvature was contrary to the relationship between the tangential displacement and the radius of curvature. A small radius of curvature resulted in more significant torsional responses of the structure. The tangential bending moment and the radial bending moment at the bottom of a fixed pier increased with the decrease of the radius of curvature. In contrast, the radial bending moment at the bottom of a pier connected by bearings remained essentially unchanged concerning a change in the radius of curvature.
A change in the longitudinal slope also significantly influences the pounding response of the structure. When the longitudinal slope changed from 0.3% to 5%, the tangential displacement of the girder and the top of the pier #2 and #3 was barely affected by the change in the longitudinal slope. When the longitudinal slope increased from 5% to 7%, both the tangential displacement of the girder and the top of the pier #2 and #3 increased significantly; this indicates that a structure is more likely to suffer from girder unseating during earthquakes. Therefore, attention should be paid to this phenomenon during the seismic design. An increase in the longitudinal slope increased the bending moment demands at the bottom of the pier; this harmed the internal force response at the bottom of the pier. The bottom section of the pier was susceptible to severe damage during excitation by an earthquake, and therefore great caution should be taken during the design.
Pounding will significantly increase the relative radial displacement while restraining the relative tangential displacement. For a different radius of curvature and longitudinal slope, the force demands on the bottom section of the pier will be reduced, and the internal force of a pier #2 and #3 that is integrated with the superstructure will be increased when taking pounding into consideration. However, the torque demands at the bottom section of both piers increased, which indicates that the pounding will increase the torsional response of the structure.
The degree of the non-uniform pounding of adjacent girders was not sensitive to the radius of curvature, and first decreased and then increased with the increase of the longitudinal slope. The degree of non-uniform pounding could be reduced by controlling the radius of curvature and longitudinal slope. When the degree of the non-uniform pounding of the curved bridge was high, the corresponding local bearing coefficient was also large. At this point, the effective anti-pounding measures should then be used to mitigate the pounding damages to the superstructure during an earthquake.
The authors envision that the proposed study could provide basis for the future development of AASHTO 23 and Caltrans Seismic Design Criteria 24 while assessing the reliability of curved bridges subject to seismic pounding. In AASHTO Specifications, for curved girder bridges with spans between 2 and 6, the maximum central angle of the circle shall not exceed 30°. It can be simplified as a straight bridge with the same structure for seismic calculation. From this study, when the central angle below 30°, there is little difference between the seismic response of the curved bridge and that of the straight bridge. In addition, when the longitudinal slope is greater than 5%, the seismic response of the structure will be greatly increased. So the longitudinal slope should not be greater than 5%.
Footnotes
Declaration of conflicting interests
The author(s) declared no potential conflicts of interest with respect to the research, authorship, and/or publication of this article.
Funding
The author(s) disclosed receipt of the following financial support for the research, authorship, and/or publication of this article: This research is jointly funded by and the Natural Science Foundation (Grant no. 52078023), Natural Science Foundation of Beijing, China (Grant no. 8162012), the National Key Laboratory of Civil Engineering Disaster Relief Fund (SLDRCE-14-02), the Outstanding Talent Training -Young Top-Notch Individual project of Beijing, China (Grant no. 21351916004) and the National Youth Natural Science Foundation (51308027, 51508019, 51908024) and the Young talent program of Beijing University of Civil Engineering and Architecture (2016), the Housing and Urban-Rural Development Research and Development Project (2015-R2-039), the Fundamental Research funds for Beijing University of Civil Engineering and Architecture (X20094,X18303 ), and also the Research Project of Beijing Municipal Commission of Education (Grant no. KM201310016007). Their financial support is gratefully acknowledged.