
Abstract
Approaches of vessel recognition are mostly accomplished by sensing targets and extracting target features, without taking advantage of spatial and temporal motion features. With maritime situation management systems widely applied, vessels’ spatial and temporal state information can be obtained by many kinds of distributed sensors, which is easy to achieve long-time accumulation but are often forgotten in databases. In order to get valuable information from large-scale stored trajectories for unknown vessel recognition, a spatial and temporal constrained trajectory similarity model and a mining algorithm based on spatial and temporal constrained trajectory similarity are proposed in this article by searching trajectories with similar motion features. Based on the idea of finding matching points between trajectories, baseline matching points are first defined to provide time reference for trajectories at different time, then the almost matching points are obtained by setting the spatial and temporal constraints, and the similarity of pairwise almost matching points is defined, which derives the spatial and temporal similarity of trajectories. By searching the matching points from trajectories, the similar motion pattern is extracted. Experiments on real data sets show that the proposed algorithm is useful for similar moving behavior mining from historic trajectories, which can strengthen motion feature with the length increases, and the support for vessel with unknown property is larger than other models.
Keywords
Introduction
Target recognition is well known as one of the key functions in a distributed multisensor information fusion system. The general approaches for target recognition are accomplished by extracting target features such as electromagnetic (Jacobs and Sullivan, 1 Liu et al., 2 Wang et al. 3 ), radiation source (Zhang et al., 4 Hung et al., 5 Zhao et al. 6 ), optical imaging (Wang et al., 7 Su, 8 Li 9 ), or microwave imaging characteristics (Novak t al. 10 Duman and Cetin, 11 Tang et al. 12 ) with single or multiple sensors. However, the objects’ trajectory features (spatial–temporal motion pattern) are not fully utilized as well as researched, especially as trajectories with abundant motion patterns stored in the database need to be well exploited. With the rapid development of distributed multisensor data fusion systems in maritime surveillance, vessels’ spatial–temporal state can be easily acquired and the data are usually managed in the database, resulting in accumulation of a great amount of multisource spatial–temporal trajectory data, which record different types of vessels in the regional sea area. These trajectory data serve as an important foundation for understanding maritime traffic condition and vessels’ mobility behavior. However, it is impossible for all sensors to cover the same region at all times limited to position, circumstance, working principle, and so on. It is essential to utilize some trajectory data with efficient identity attributes to reinforce sensors with a strong ability of positioning but weak ability of recognition. Thus, we hope to explore mining spatial–temporal motion feature by trajectory analysis to establish such relation for multisource trajectories.
Spatiotemporal trajectory analysis has been applied to many aspects such as commuting choice, transportation management, commercial recommendation, urban planning, tourism service, and criminal investigation (Zheng, 13 Feng and Zhu, 14 Yuan et al. 15 ). For instance, Palma et al. 16 and Liu et al. 17 extract hot regions from trajectories database, Chen et al. 18 and Yin et al. 19 mine frequent active routes for moving objects, Zhang et al. 20 find the periodic activities hidden in the trajectories. The abovementioned mainly focus on the trajectories from objects that move on predefined spatial networks such as road segments, railways, and invisible air routes. Focusing on maritime situational awareness, Pallotta et al. 21 found traffic routes, route entrance and exit, and stationary areas by analyzing stored automatic identification system (AIS) data. However, existing literatures related to the issue we are concerned with are less. Zhu et al. 22 are the only ones we could find, but they have only two vessels in the validation data for experiment, which is less convincing.
A basic method for trajectory feature correlation is calculating similarity by defining proper similarity models. Detailed discussions of the trajectory similarity measure can be found in Wang et al. 23 and Toohey and Duckham. 24 Some applications of trajectory analysis are mainly based on similarity measure. For example, moving objects can be correlated by searching similar moving trajectories in predefined spatial networks (road segments, railways, and so on; Tiakas et al. 25 ). Accuracy of location-based services could be improved by mining users’ long-term activity similarity based on their trajectories (Lv et al. 26 ). Clustering and classification of moving objects in video image could be achieved by measuring the similarity of the position and direction of trajectories (Wei et al. 27 ). Users’ movement behavior can be captured by searching spatial and temporal clues in trajectories and clustering similar trajectories into groups in the condition of urban road networks (Hung et al. 28 ). Anomaly objects and suspicious activities can be extracted with fusion of data and information, including kinematic features, geospatial features, contextual information, and maritime domain knowledge and vessels motion patterns can be modeled based on machine learning approaches (Shahir et al. 29 ).
Many existing methods measure the similarity from the perspective of spatial attributes, such as the longest common subsequence (LCSS), edit distance with real penalty (ERP), edit distance on real sequence (EDR), Hausdorff distance (HD), and the improvement of these methods (Chen et al. 30 ). These methods neither lack consideration of temporal factors nor can deal only with trajectories of equal length. While dynamic time warping (DTW; Keogh and Ratanamahatana 31 ), spatial assembling distance (SpADe; Chen et al., 32 Chen et al. 33 ), w-constrained discrete Fréchet (wDF) distance (Ding et al. 34 ), clue-aware trajectory similarity (CATS; Hung et al. 28 ), and so on can be used to compare the trajectories similarity from the perspective of temporal attributes. The methods of DTW, SpADe, and wDF have been thoroughly analyzed in the literature (Hung et al. 28 ). But these methods are either not applicable to compare similar motion behaviors or working with too many constraints. Moreover, the CATS model is difficult to deal with a large scale of historical trajectories because of the simple setting of temporal threshold for searching clues.
According to the existing research results above, we find that targets with the same characteristics will show some certain spatial and temporal similarity on the trajectory. As for vessel targets, trajectories from different types of vessels of different types are always different in length, width, tonnage, draft depth, and sailing speed. Targets with similar characteristics have some similar motion patterns, which can help us to extract some features to confirm the targets’ identities. In order to recognize targets with unknown identities, the main idea in this article is searching similar trajectories with close motion patterns from historical trajectory database as much as possible, with some information extracted to support vessel identification. In order to distinguish trajectories from the difference of targets’ moving characteristics, motion characteristics must be highlighted when measuring the similarity between trajectories.
In a distributed multisensor system, targets’ trajectories from different sensors are different in positioning methods, ranging accuracy, and time intervals. Even if two trajectories are from the same source but across the timescale, it is impossible to record the same motion pattern completely. Taking radars as an example, the sampling interval of detect data from radars can be very short, very long, or even not periodic, due to different carrying platforms, bands, and purposes of radars.
Hung et al. 28 believe that there are many clues that may be extracted from spatially and temporally co-located data points from trajectories with similar movement behaviors and cluster similar trajectories into groups by spatial and temporal clues, which inspired our work in this article greatly. If some sensing manners can continuously record the trajectories of two targets with the same movement behavior, then two data points representing the same spatial–temporal state will be recorded, respectively, which should be fully matching. Since the data recording manner cannot completely record the target activities continuously but by discretely sampling data points, approximately matching data points should be found in some certain spatial and temporal ranges representing the same movement behavior, which we call “almost matching.” Based on the basic ideas above, a spatial and temporal constrained trajectory similarity (STCTS) model is proposed as the main contribution of this article, which can find the approximately matching points on two similar trajectories by spatial and temporal constraints and then calculate similarity. Based on this model, an STCTS-based similar trajectory mining algorithm is proposed to search similar trajectories from historical trajectories database. Finally, the validity of the model and algorithm is verified using real data sets, and the recognition of targets with unknown attributes can be realized.
Problem modeling
A trajectory

Sketch of trajectory and similar trajectories.
To determine whether motion patterns from two trajectories are similar, not only should we compare from the perspective of space, but also from the time when the moving behavior occurs. As shown in Figure 1, the start time of trajectory
In the actual situation, it is generally difficult to directly measure the similarity between the whole trajectories. In most cases, affected by factors such as tidal variation, wind, waves, ship avoidance, and so on, there are only subtrajectory segments that meet the similarity under spatial and temporal constraints. The notion of similar subtrajectory segments is somewhat analogous to the common subsequence in LCSS model, but this similar subtrajectory is a spatial–temporal prism structure here.
Considering a trajectory with unknown identity and a set of historical trajectories, we hope that all trajectories similar to the current motion pattern can be mined from the historical data set based on the STCTS model, and the current target with unknown identity can be confirmed from the perspective of spatial–temporal trajectory motion features. To realize the purpose of identifying targets with unknown identities, the historical data set should provide targets’ identity information.
In this article, a data set provided by the AIS is used for validation experiments. AIS can automatically broadcast ships dynamics and some other information to all other installations in a self-organized manner. In AIS, each vessel has a unique identity MMSI (Maritime Mobile Service Identity) registered by the International Maritime Organization (IMO; Harati-Mokhtari et al. 35 ). AIS transmitter on vessels can broadcast positioning data provided by positioning devices (such as Global Positioning System (GPS)) through AIS messages, while the current mainstream positioning equipment is differential GPS, whose positioning accuracy is better than 10 m. AIS can also provide ship static data such as vessel name, call sign, size, type, destination, and so on. According to AIS technical standards, the interval of AIS dynamic messages provided by the sailing vessels is 2–10 s, and the data sampling rate is higher. AIS data is sent out in broadcast form, which is easy to obtain, and the data size of one single message is small and easier to store. Based on the reasons above, AIS data is very appropriate to be used for historical motion pattern records and we used it for validation experiment.
Trajectory similarity measure
If some sensors can continuously record trajectories of two targets with similar motion behavior, the same motion behavior will record one data point on the two trajectories, respectively, and the two data points should be totally matching without considering the bias. This match is theoretical, and we call them matching point.
Definition 1
Matching points. Data points represent exactly the same motion pattern from two trajectories.
The concept of matching points is a pair of points, which means there is a data point on the two trajectories representing the same moving behavior. Matching points is too strict to be satisfied. Affected by sensor performance, working principles, measurement bias, sampling rate, and other factors, the general record data point samples data discretely, thus it is difficult to record the sampling data points representing the same behavior synchronously. We need to set some spatial and temporal constraints to select the approximately matching point with the similarity measured. We call such approximately matching points as spatial–temporal joint constrained matching points, spatial–temporal matching point for short.
Since the timestamp of the two comparing trajectories are usually different, it is necessary to set a relative start time separately to place temporal constraints on data points. Before giving the definition of the spatial–temporal matching points, we define the concept of baseline matching point first.
Definition 2
Baseline matching point. A matching point that represents the relative start time.
We need to determine one data point on each of trajectories as the baseline matching point, and there are three ways to determine.
Specify a data point as baseline matching point on two trajectories, respectively;
Specify a data point on one trajectory, and set some rules to search one optimal matching point on the other trajectory;
Set some rules to search the optimal matching point on the two trajectories, respectively.
Theoretically, the spatial–temporal matching points representing the same motion pattern from two trajectories should be close enough to each other in space and be close enough relative to the respective baseline matching point in time. The definition of spatial–temporal matching points is given below.
Definition 3
Spatial–temporal matching points. Given a spatial threshold
If not specified in the following, matching points refers to the spatial–temporal matching points.
Figure 2 shows an example of baseline matching points and matching points. In Figure 2,

Sketch of baseline matching points and matching points.
For any data point on reference trajectory, the quantity of matching points on the other trajectory may be none, only one, or more than one. How to distinguish these matching points and which one can represent the state of target most approximately needs to be compared quantitatively.
Definition 4
The similarity between matching points. Given a spatial threshold
The range of function
Definition 5
Optimal matching point. Given a spatial threshold
The optimal matching point is the matching point which can mostly reflect the motion pattern of the reference data in all the matching points. If two trajectories represent one similar motion pattern, we should find the optimal matching points from these two trajectories as much as possible. We will use the example in Figure 2 to illustrate the selection of optimal matching point, as shown in Figure 3. Given

Sketch of optimal matching points and an illustrative example for computing similarity.
If the sampling data points are sparse, we can increase the spatial threshold and temporal threshold appropriately according to the sampling rate. As for the data missing, if the situation in some areas is not very serious, we can also increase the spatial threshold and temporal threshold appropriately as the sparse situation. Otherwise, if the data missing is very serious, we believe that such trajectories are no longer of high value, because such trajectories lack enough information and are no longer reliable, which is not the focus of this article.
With the definition of optimal matching point and the similarity between matching points, we can define the spatial–temporal similarity between trajectories.
Definition 6
Spatial–temporal similarity between data point and trajectory. Given a spatial threshold
Definition 7
Spatial–temporal similarity between trajectories. Given a spatial threshold
Figure 3 illustrates an example of calculating the spatial–temporal similarity between trajectories. Assume that the spatial threshold is
When we calculate
Experiment and discussion
Experimental environment
Two real data sets are used for the experiment, which include an AIS data set as the historical motion pattern reference and a maritime radar data set as the test data with identity under confirmed. The historical AIS data set is collected by the shore-based AIS receive equipment and the space range of the data set is part of the Yellow Sea area between Yantai port and Dalian port, with longitude range from 121.2°E to 122.2°E and latitude range from 37.7°N to 38.7°N. The time range of historical data set is from 1–31 August 2015, which contains 24,886 trajectories from 8444 vessels, counting 13,220,910 data points in total. The radar data set is reported from a shore-based sea surveillance radar, whose scanning period is about 20 s, and the spatial cover is the same as the AIS data set. The time range of radar data is from 13:23 to 14:57, 1 September 2015, and time intervals of radar data range from 20–60 s according to the stability of tracking (if stable, reported every 3 circles), resulting in the different length of radar trajectory data. Meanwhile, all the targets in radar data set have correlated AIS information, to supply true vessel type for evaluating.
It is worth noting that for most vessels, the time cost to sail across the area selected for experiment is 3.5–5 h, so the time spans of historical AIS trajectories and radar trajectories differ widely. It is essential to cut AIS trajectory to make the time span close to radar trajectory. First of all, we should determine the baseline points on trajectories. We can specify the latest data point on radar trajectory as the baseline point and the other one on AIS trajectory can be determined by the maximum similarity measure. The baseline matching point provides a reference start time for the other data point, which cannot be determined by time but can only be determined by space. The baseline data point on historical trajectory must be the most similar data point compared to the baseline data point on the reference trajectory. Certainly, if the distance between baseline data points is larger than spatial threshold
When we carry out the experiment, each trajectory in the test data set is regarded as the reference trajectory, and search similar trajectories in the historical data set according to the trajectory data index one by one, with all target hits and the same type of hits recorded respectively. In the end, the support is derived.
Experiment results
The experimental parameters are set as follows:
The experimental results are shown in Figures 4 and 5, which, respectively, shows the total hits and correct hits under different similarity thresholds, and correct type support under different similarity thresholds.
From the results shown in Figures 4 and 5, hits decrease gradually along the trajectory data lengths while the support increases. This illustrates that the STCTS-based mining algorithm can accumulate and highlight the motion characteristics of targets. The motion significance of the target trajectory can be strengthened with increase in data points. As the similarity threshold increases, some radar target hits become 0, which play less in our work. So we did not adopt a larger similarity threshold in our experiments.

Total hits and correct hits.

Support of correct type hits.
Figure 6(a) and (b) shows the hits and support along trajectory length of radar target 7 with similarity threshold as 0.4.

Mining results along trajectory length: (a) Hits of radar target 7. (b) Support of radar target 7.
Performance evaluation
In Wang et al. 23 and Toohey and Duckham, 24 the existing trajectory similarity measure such as HD, DTW, LCSS, EDR, ERP, SpADe, and wDF and the methods based on the basic ideas above are introduced in detail with comprehensive experiment analysis. Based on the analysis above and the specific work in this article, we conduct comparative experiments with modified Hausdorff distance (MHD) and interpolated modified Hausdorff distance (IMHD) in Wei et al. 27 and Shao et al., 36 and LCSS in Michail et al. 37 MHD and IMHD are two improved approaches based on HD. Two kinds of path similarity functions of S1 and S2 based on LCSS were proposed in Michail et al., 37 measuring the similarity of two trajectories by the ratio of points number of common parts to the total number of trajectories.
Different from the experiment in section “Experiment results,” we use the total radar trajectory as the conference trajectory to mine similar trajectories in historical AIS trajectories. Because when we compute the similarity between radar trajectory and AIS trajectory, we cut the subtrajectory from AIS, we do the same with the other model.
Since the proposed STCTS-based mining algorithm uses spatial threshold, temporal threshold, and similarity threshold, in order to uniform the conditions of experiments, the parameters of the proposed method in the comparative experiment are set the same as the experiments in section “Experiment results.” The spatial threshold in similar trajectory mining methods based on MHD, IMHD, and LCSS model is set to the value corresponding to the similarity threshold, respectively.
The experiment runs on the desktop computer, the operating system is Windows7, CPU is Intel Core i5-4570, the memory is 8G, all algorithms are written in C# language, and the program running environment is VS2010. Data set used for comparative experiment is the same as in section “Experimental environment,” but we only use the whole trajectories in the validation data set as reference trajectory. The run time of algorithms and the support of the same type vessels will be recorded. In order to reduce the random factors, we repeat the experiment 10 times and take the averaged value as the final result. The run time of various methods is shown in Table 1. In addition, the distance between the trajectories was output by MHD and IMHD, so the spatial threshold works when output. The spatial threshold in LCSS was used for searching, and different thresholds will result in different experiment results, which run separately for different spatial thresholds.
Runtime of different models.
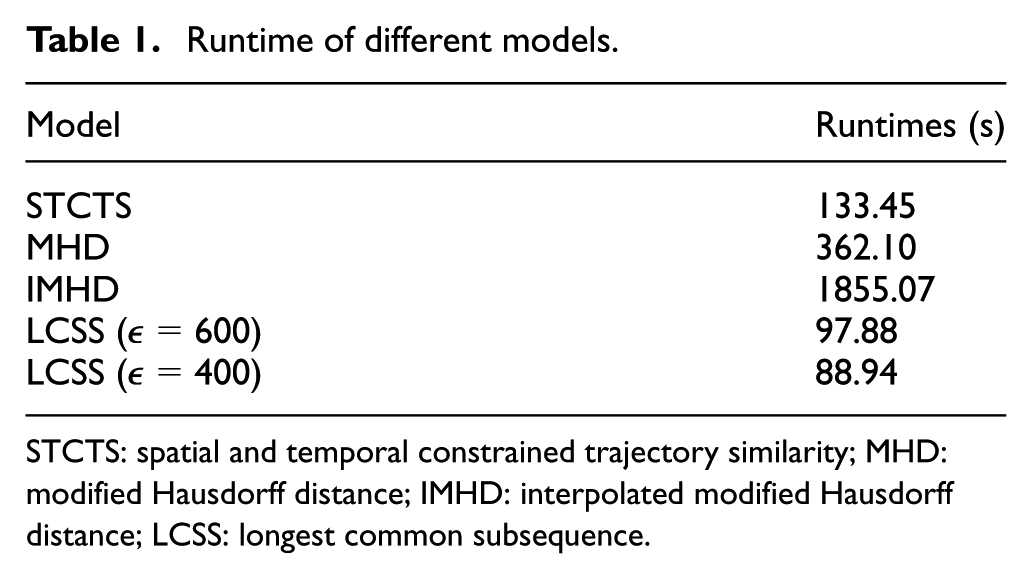
STCTS: spatial and temporal constrained trajectory similarity; MHD: modified Hausdorff distance; IMHD: interpolated modified Hausdorff distance; LCSS: longest common subsequence.
As shown in Table 1, the time performance of STCTS and LCSS is better. Because there is no need to compare temporal attributes, the time cost of LCSS model is lower than STCTS.
As the results shown in Table 2, the proposed STCTS-based mining algorithm obtains the highest support, which means the STCTS model can measure the spatial–temporal motion pattern better. We take an example of radar target 150 to show the mining similar trajectories of different methods, shown in Figure 7(a)–(d).
Hits and supports with different thresholds.
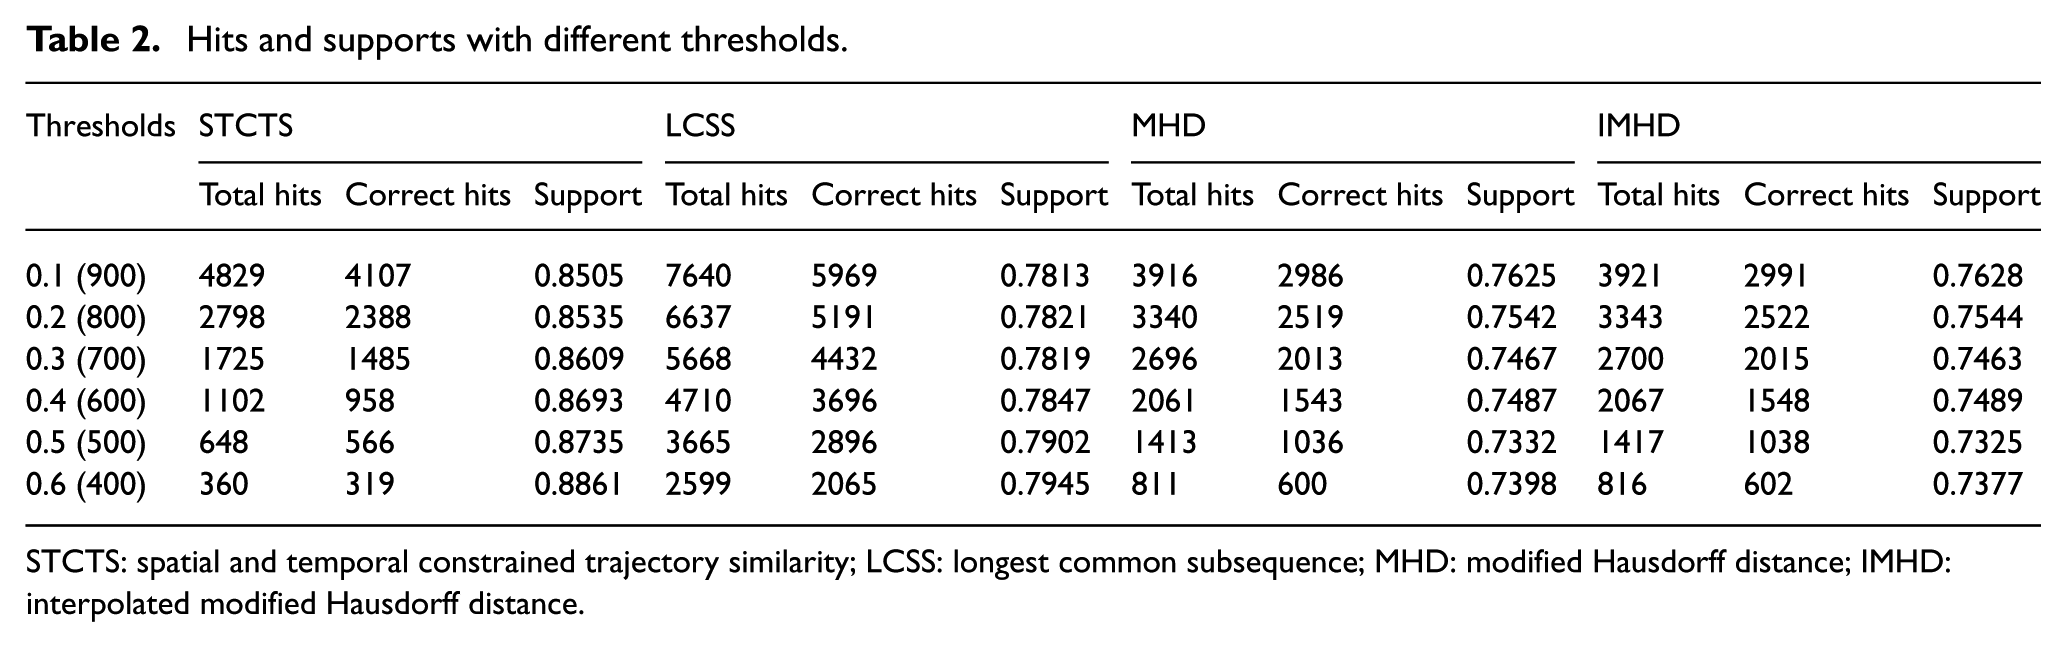
STCTS: spatial and temporal constrained trajectory similarity; LCSS: longest common subsequence; MHD: modified Hausdorff distance; IMHD: interpolated modified Hausdorff distance.

Similar trajectories mining results with different methods: (a) STCTS-based method. (b) LCSS-based method. (c) MHD-based method. (d) IMHD-based method.
According to the comparative experiment results above, we can draw the following conclusions:
Similar trajectory mining methods can help to identify targets, and the support is relatively high with different similarity models;
The proposed STCTS model can measure the motion characteristics of trajectory better. The mining algorithm based on the similarity model can effectively extract a similar spatial–temporal motion pattern with similar motion features and obtain a higher support.
Conclusion
Based on the idea of searching similar matching points, we define spatial and temporal thresholds to constrain the range of approximately matching points, then we choose the matching point with the highest similarity, that is, the optimal matching point, to measure the similarity between two trajectories. Based on the STCTS, a mining algorithm to mine similar motion pattern from historical trajectories is proposed and targets with unknown identity are confirmed by comparing current interested trajectory with historical trajectories. Experiments results with real data sets show that the STCTS-based mining algorithm can effectively realize the mining of similar motion patterns from historical data set, which can provide a relatively higher support for target recognition.
The proposed algorithm can be applied to daily awareness of maritime situations, which can run in the background for searching similar trajectories compared to current trajectories. In addition, we can set several special trajectory motion patterns in advance, and focus on the targets matching with those motion patterns.
Footnotes
Handling Editor: Janos Botzheim
Declaration of conflicting interests
The author(s) declared no potential conflicts of interest with respect to the research, authorship, and/or publication of this article.
Funding
The author(s) disclosed receipt of the following financial support for the research, authorship, and/or publication of this article: This work was supported in part by the National Natural Science Foundation of China (61531020) and by the Special Funds of Taishan Scholars Construction Engineering.