
Abstract
This article presents a fiber Bragg grating–based monitoring and warning system for expressway slopes. A detailed architecture of the sensing system based on fiber Bragg grating sensors for safety analysis and pre-warning of slopes is described and interpreted. The whole warning and monitoring system was mainly realized based on two monitored parameters from fiber Bragg grating strain sensors: (1) the measured bend strain of inclinometers for the calculation of horizontal displacement and (2) axial strain distributions of soil nails. The maximum magnitudes of cumulative strain and displacement in the present monitored expressway slope were 198 με and 5.06 mm, respectively. Critical threshold values of different warning levels for expressway slopes have been proposed using statistical analysis method based on comparative analysis of history monitored data from slopes in the same region. A total of four warning levels characterized by different ranges of displacement rates and the related engineering measures to treat expressway slopes were proposed and discussed. This fiber Bragg grating–based monitoring system of soil nails and inclinometers forms a real-time sensing network, assisting engineers to adopt quick and essential measures to deal with potential landslide risk.
Introduction
Landslides along manmade infrastructures are destructive natural disasters all over the world, leading to thousands of casualties, significant damage, and economic loss in the past few decades. Security monitoring and early warning for expressway slopes is crucial particularly in hilly areas. An effective slope monitoring method provides scientific data with respect to slope movement, assisting engineers to fully understand and predict the potential landslide. 1
Fiber Bragg grating (FBG) sensing technology is a popular sensing method in recent years for health monitoring of civil engineering structures due to the outstanding advantages such as high resolution, small size, light weight, real-time monitoring, remote sensing, resistance to electromagnetic interference (EMI), and ease of installation. 2 A single FBG sensor can be directly used as a strain gauge and encapsulated into different types of transducers for the measurement of displacement, tilt angle, strain, stress, temperature, and pressure. Safety evaluation of slopes can be achieved in terms of different mechanical parameters measured by FBG sensors, such as strain variation, 3 horizontal displacement distribution or internal inclination, 4 and pore water pressure. 5 A large number of monitoring projects using FBG sensors from monitoring ground displacement have been reported in different studies. For example, different FBG based inclinometers for ground movement monitoring have been developed by mounting a series of FBG strain sensors along an inclinometer casing for the measurement of bending strain distribution, 6 and the obtained strain change can further be used to calculate the horizontal displacement at different locations of slopes using finite difference method 7 or numerical integration method. 8 Main advantages of these FBG-based inclinometers include high resolution, real-time monitoring, remote sensing, and temperature insensitivity. But there are also several disadvantages of these FBG-based inclinometers; for example, the occurred measurement error may accumulate, thereby generating potential significant displacement error at ground surface. 9
Monitoring the mechanical performance of reinforcements underground such as soil nails, geotextiles, and anchors using FBG sensors offers an effective alternative for safety evaluation of slopes.10–13 Potential landslide have significant influence on the mechanical performance of the above reinforcements, and therefore a corresponding evaluation with respect to slope stability can be conducted by analyzing the obtained strain/stress distributions. Typical studies conducted by Zhang et al. 12 and Li et al. 14 indicate that using FBG sensors is feasible and powerful for soil nail strain measurement in both laboratory testing and field monitoring.12–15 There are many studies carried out for performance investigation of retaining walls and piles using FBG sensors.16,17 However, these studies mainly focus on the mechanical behavior of a specific element inside slopes or retaining walls. There is a lack of a detailed investigation regarding how to develop an early warning method for expressway slopes in terms of the monitored parameters from FBG sensors, such as strain, stress, pore water pressure, and displacement data. A rational and detailed method is very useful particularly for field engineers to take essential actions to prevent significant engineering disasters.
This article describes a slope monitoring and early warning method based on a combined analysis of strain distributions of soil nails and displacement variations of inclinometers using FBG sensors. Safety status of the expressway slope was classified into four different levels according to the monitored mechanical parameters. Engineers and researchers can estimate the security condition of expressway slopes according to the measured parameter range and adopt the corresponding measures to predict potential landslide.
A safety monitoring and altering system based on FBG sensing technique
Working principle of FBG sensing technique
FBG technique is a typical sensing method for the measurement of different physical parameters such as temperature, pressure, strain, and stress. FBG sensor has many advantages such as easy implementation, high accuracy and durability, resistance to EMI, non-corrosion, light weight, and small size. FBG sensor is developed based on wavelength-selective sensing section, where only a central light wavelength matching with the local Bragg condition can be reflected back to the detector. Wavelength change of an FBG sensor is temperature and strain dependent, and their relationship can be given by 18

where
Monitoring and early warning of expressway slopes
The proposed FBG-based monitoring system mainly consists of two components including software and hardware. The software is mainly a computer program to present whether the slope is safe or not. To achieve the objectives of early warning and real-time monitoring for expressway slopes, all the measured parameter information from optical fiber sensors is transferred into strain and lateral displacement (cumulative or increasing rates of displacement and strain) using the warning software. Allowable limits for all concerned critical parameters are considered as the threshold values. For example, in case the horizontal displacement of inclinometer casing, strain of soil nails, or their increasing rates approach or exceed the threshold values assigned in the computer program, the warning system will display a corresponding warning signal to operators indicating that the slope is in an unsafe state. Essential engineering measures can therefore be adopted to deal with the potential unsafe slopes accordingly to prevent possible economic loss and casualties.
Overall architecture of the FBG-based monitoring and warning system is shown in Figure 1, which consists of three sets of input parameters. One set of input parameters consists of critical parameter values such as threshold limits of strain, displacement, or the related increasing rates in order to generate baseline criterion to deliver warning information. These parameter values should be given before running the software program. Another set of parameters includes strain and displacement data from optical fiber sensors obtained from field. The warning mode is divided into two types, Mode I and Mode II, as shown in Figure 1. Both the proposed modes allow the system to offer warning information for expressway slopes according to different parameters. Mode I refers to the possible warning information from FBG-based inclinometers and Mode II is based on the real-time strain information from soil nails. Ground movement due to excavation activities or significant rainfall infiltration leads to both obvious lateral displacement of inclinometers and strain rise along soil nails, and both the displacement and strain or their increasing rates are involved in the prediction of future slope safety uncertainties. Accordingly, the program will provide warning by comparing the threshold values with the ones from the monitored parameters and further actions can be taken to provide safety insurance for expressway slopes.
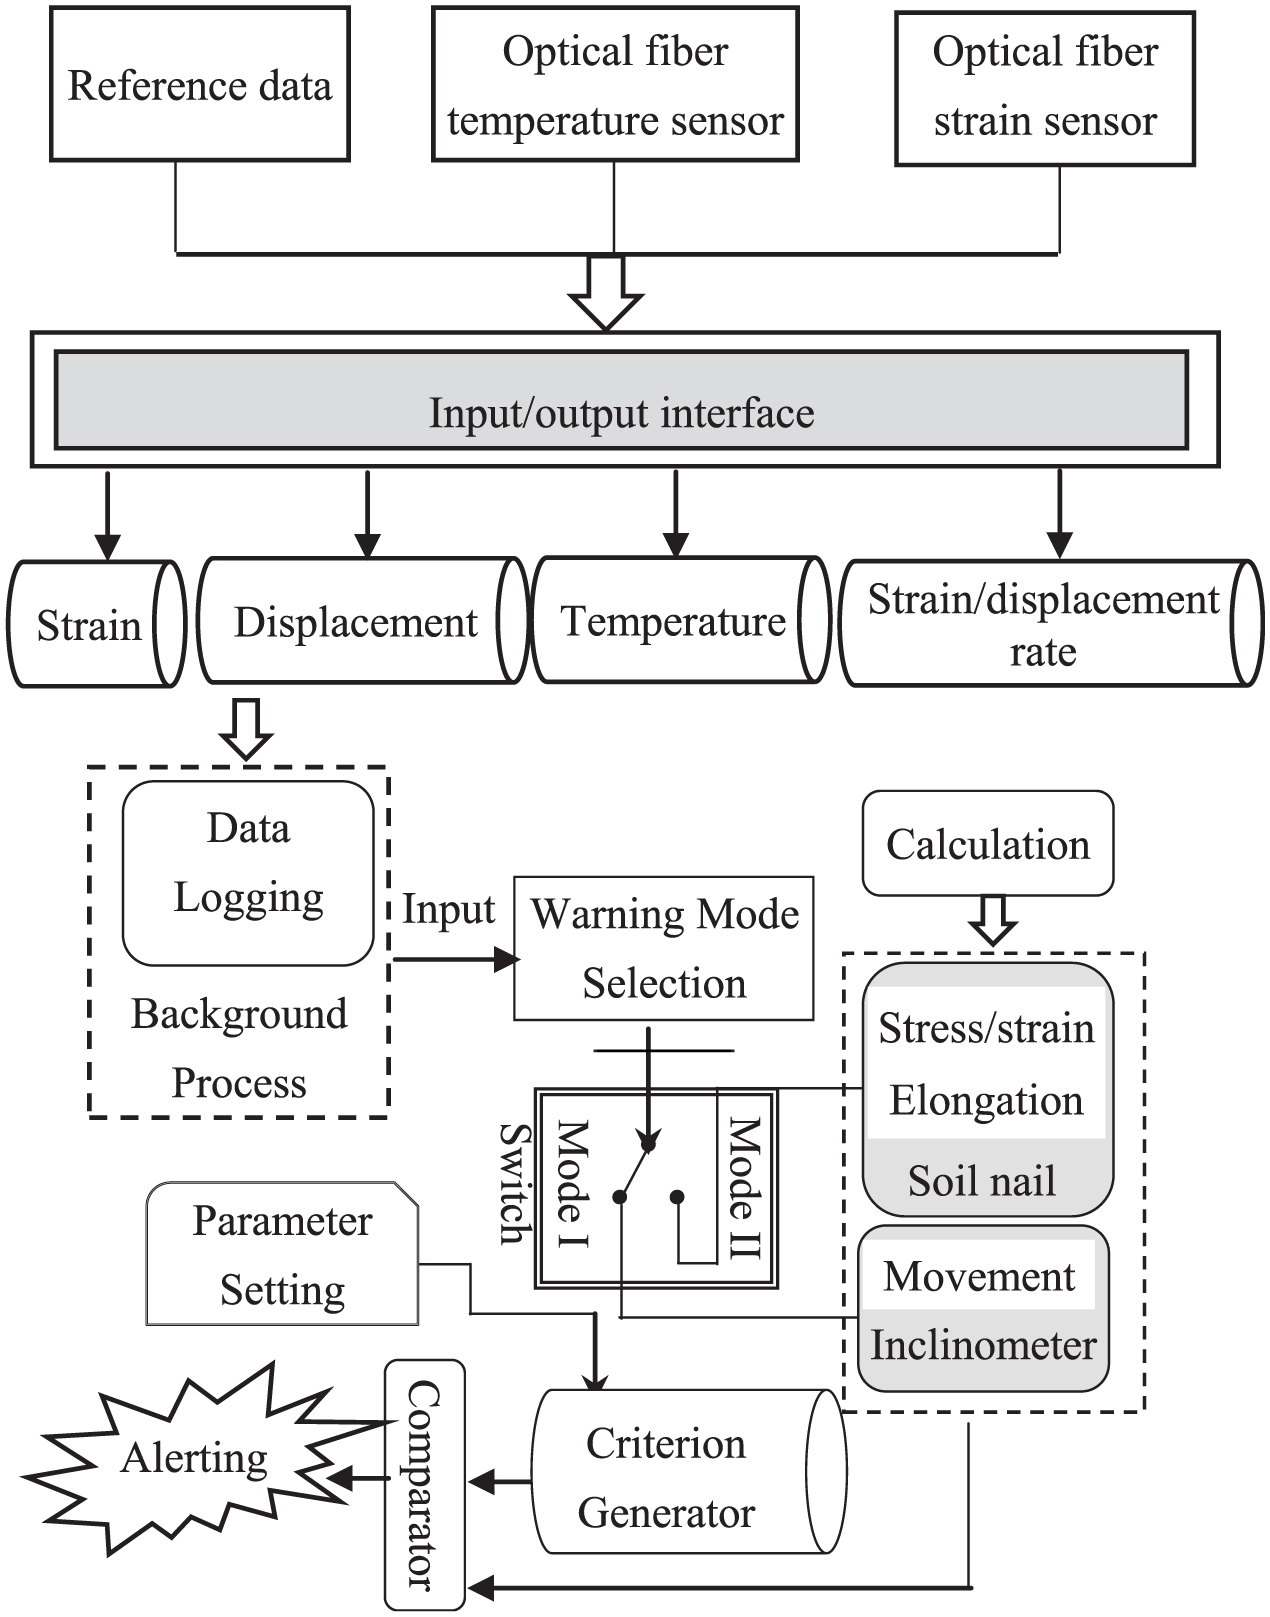
Flow chart of an optical fiber sensor–based warning system for expressway slopes.
Field monitoring of a slope using FBG technique
Landslide monitoring of a real slope in Sichuan Province
Monitoring project was carried out on a cut expressway slope (Slope feature No. is V5) which was around 23.5 km away from Panzhihua along the highway from Panzhihua to Tianfang in Sichuan Province, Mainland China. This slope was mainly composed of completely decomposed granite and highly decomposed granite. Height and length of this slope were around 39.5 and 130 m, respectively. Inclination angle of slope surface after excavation was 53° to horizontal. Soil nails (with lengths from 24 to 28 m) were embedded underground as reinforcements at different height locations. Figure 2 shows the basic layout of the monitored soil nails and inclinometer casings mounted with FBG sensors. It is noted that the inclinometer used in this study has many advantages such as low cost, ease of installation and transportation, light weight, as well as continuous measurement of displacement. It is seen that a total of six soil nails (namely, SN1 to SN6 from slope top to slope toe as shown in Figure 2) were monitored using a series of FBG sensors. Micron Optics’ SM125 optical sensing interrogator based on proven Fiber Fabry-Perot Tunable Filter technology is used for measuring strain and temperature parameters in field. The wavelength resolution and scanning frequency of the FBG sensor are 1 pm and 10 Hz, respectively, with a wavelength range of 1510–1590 nm. Vertical and horizontal spacing between adjacent soil nails was 2 m and the related inclination angle was 20° with respect to horizontal. Soil nail lengths were 28 m for SN1, SN2, SN3, and SN4 and 24 m for SN5 and SN6, respectively. Diameters of the steel bar and drill hole were 32 and 110 mm, respectively. A number of FBG strain sensors and one temperature sensor were mounted on each soil nail. FBG strain sensors were mounted 4, 7, 11, 15, and 19 m away from soil nail head for all these six soil nails. Temperature distribution along the soil nails is assumed to be uniformly distributed, as the depth difference within the soil nail length is very small (less than 10 m). Therefore, only one temperature sensor was installed on a soil nail for compensation. The objective of conducting temperature compensation for all strain data of soil nails is to calculate the pure strain, which directly infers the deformation change along soil nails. Knowing the external temperature change measured by FBG temperature sensor, the pure strain can be obtained in terms of the wavelength change data shown in equation (1).
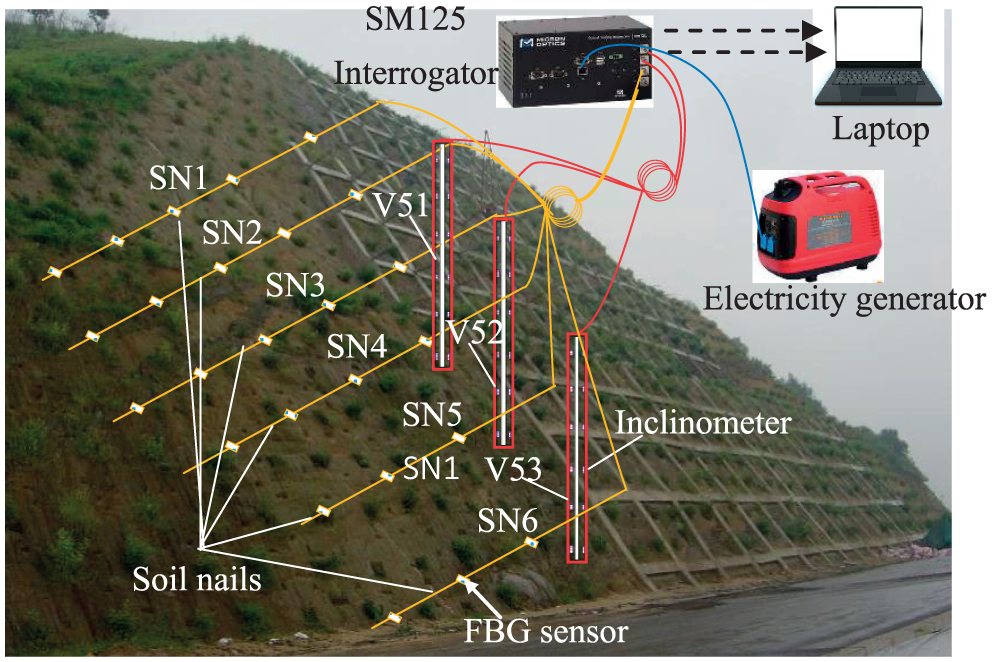
Arrangement of optical fiber sensor–based warning system for safety alerting of slope V5.
For the measurement of internal ground movement of slope V5, three inclinometer casings (namely, V51, V52, and V53) mounted with two series of FBG sensors along the two sides were placed at three different locations of the slope for monitoring the corresponding horizontal displacement. Figure 3 shows a schematic view of the FBG-based inclinometer used in the present monitoring study. Internal and external diameters of this inclinometer casing are 50 and 70 mm, respectively. Length of each inclinometer casing is 11 m, and a total of 20 FBG strain sensors were mounted on the two opposite sides of the inclinometer casing (with 10 strain sensors on each side, and the spacing between adjacent FBG sensors was 1 m). Figure 4 shows the typical installation process of FBG sensors on inclinometer casings for ground movement monitoring. FBG strain sensors were prestressed up to around 3000 με (in order to sense compressive strain) and placed in two small slots along the inclinometer casing as shown in Figure 4(a) and (b). FBG strain sensors were initially prestressed up to 3000 με and fixed by tapes at the two ends, and then glue was used to adhere the strain sensors onto the soil nail bars. Plastic tubes were used at the tips of inclinometer casings for protection (Figure 4(c)) and plastic covers shown in Figure 4(d) were mounted at inclinometer tips protecting the optical fiber cables as shown in Figure 4(c). Optical fiber cables were placed inside the plastic tubes that are orange in color for better protection. Figure 5 shows the installation details of FBG-based inclinometer casings in the monitored slope. These FBG-based inclinometers were divided into a number of sections (around 3–4 m for each section) before installation (Figure 5(a)) for ease of transportation. The three inclinometer casings were then placed in three 150-mm-diameter boreholes and connected one section by one section as shown in Figure 5(b) and (c). Cement slurry at a water cement ratio of 0.42 was finally used to fill the space between boreholes and inclinometer casings (Figure 5(d) and (e)). Initial data of FBG sensors can be taken after cement slurry has initially hardened in boreholes (7 days after grouting).

Installation scheme of optical fiber strain and temperature sensors on an inclinometer casing for ground movement monitoring.

FBG-based smart inclinometer for ground movement monitoring: (a) fabrication of FBG sensors on an inclinometer casing; (b) prestressed FBG sensors adhered on inclinometer casing surface; (c) protection of optical fiber cables at the tip of inclinometer casing and a casing coupler for connecting two adjacent inclinometer casings; and (d) inclinometer casings after the installation of tip caps.

Installation of FBG-FBG based inclinometer casings in a real slope: (a) a group of FBG-based inclinometers; (b) installation of smart inclinometers in field slope; (c) connection of two adjacent inclinometer casings; (d) inclinometer casing after being installed in borehole; and (e) inclinometer casing after being grouted in a borehole.
Calculation of horizontal displacement using FBG-based inclinometers
Horizontal displacement underground can be calculated using FBG strain distribution along inclinometer casings. Two series of FBG strain sensors mounted at two opposite directions of the inclinometer casing can be used to calculate the curvature k, gradient a, and horizontal displacement u using the following equations

where A and B are the integration constants. Boundary conditions of inclinometer casing tips were assumed to be fixed end. This method is popular and has been widely used for ground displacement calculation.2,8,21,22 It is noted that the thermal effect on FBG strain sensors can be eliminated as the occurred bend strain distribution was obtained by the strain difference of the two series of opposite FBG sensors. Therefore, no additional temperature sensor was used for inclinometer monitoring.
Monitoring results and data interpretation
Horizontal displacement distributions of inclinometers
Data collection of FBG strain sensors on soil nails and inclinometers was conducted monthly and wavelength data of all strain sensors were collected from field. Five groups of strain data from V52 and four groups of strain data from V51 and V53 were finally collected. Figure 6 shows the average wavelength changes of the two series of FBG sensors along the two opposite sides (V51-A and V51-B) of the inclinometer V51. S1 to S10 refer to the FBG strain sensors installed from the head to the tip of the monitored inclinometer casing. It is seen that wavelength changes exhibit step-by-step variation after initial data collection in the first month and most wavelengths of FBG strain sensors show continuous but limited rise after 6 months (less than 0.3 nm).

Typical measured average wavelength shift of two series of FBG sensors mounted on the inclinometer V51.
Figure 7 presents the calculated horizontal displacement distribution based on wavelength shift for the inclinometers V51 and V52. The sensors mounted on V53 were damaged so that no strain data were collected. It is clear in Figure 7 that the measured displacement exhibits a general rise as the embedment depth of the inclinometer decreases, indicating that ground movement close to the slope surface is relatively apparent. The occurred maximum displacements are around 5 and 3.45 mm for V51 and V52, respectively. Figure 8 depicts the maximum average horizontal displacement rate against elapsed time. The displacement rate is calculated by dividing the occurred horizontal displacement by elapsed time and the unit is mm/day. Most displacement rates are within a limited range (between 0 and 0.04 mm/day). The maximum average displacement rates of V52 present a slightly larger variation range compared with V51, which is maintained in a stable range within 0.01 and 0.03 mm/day.
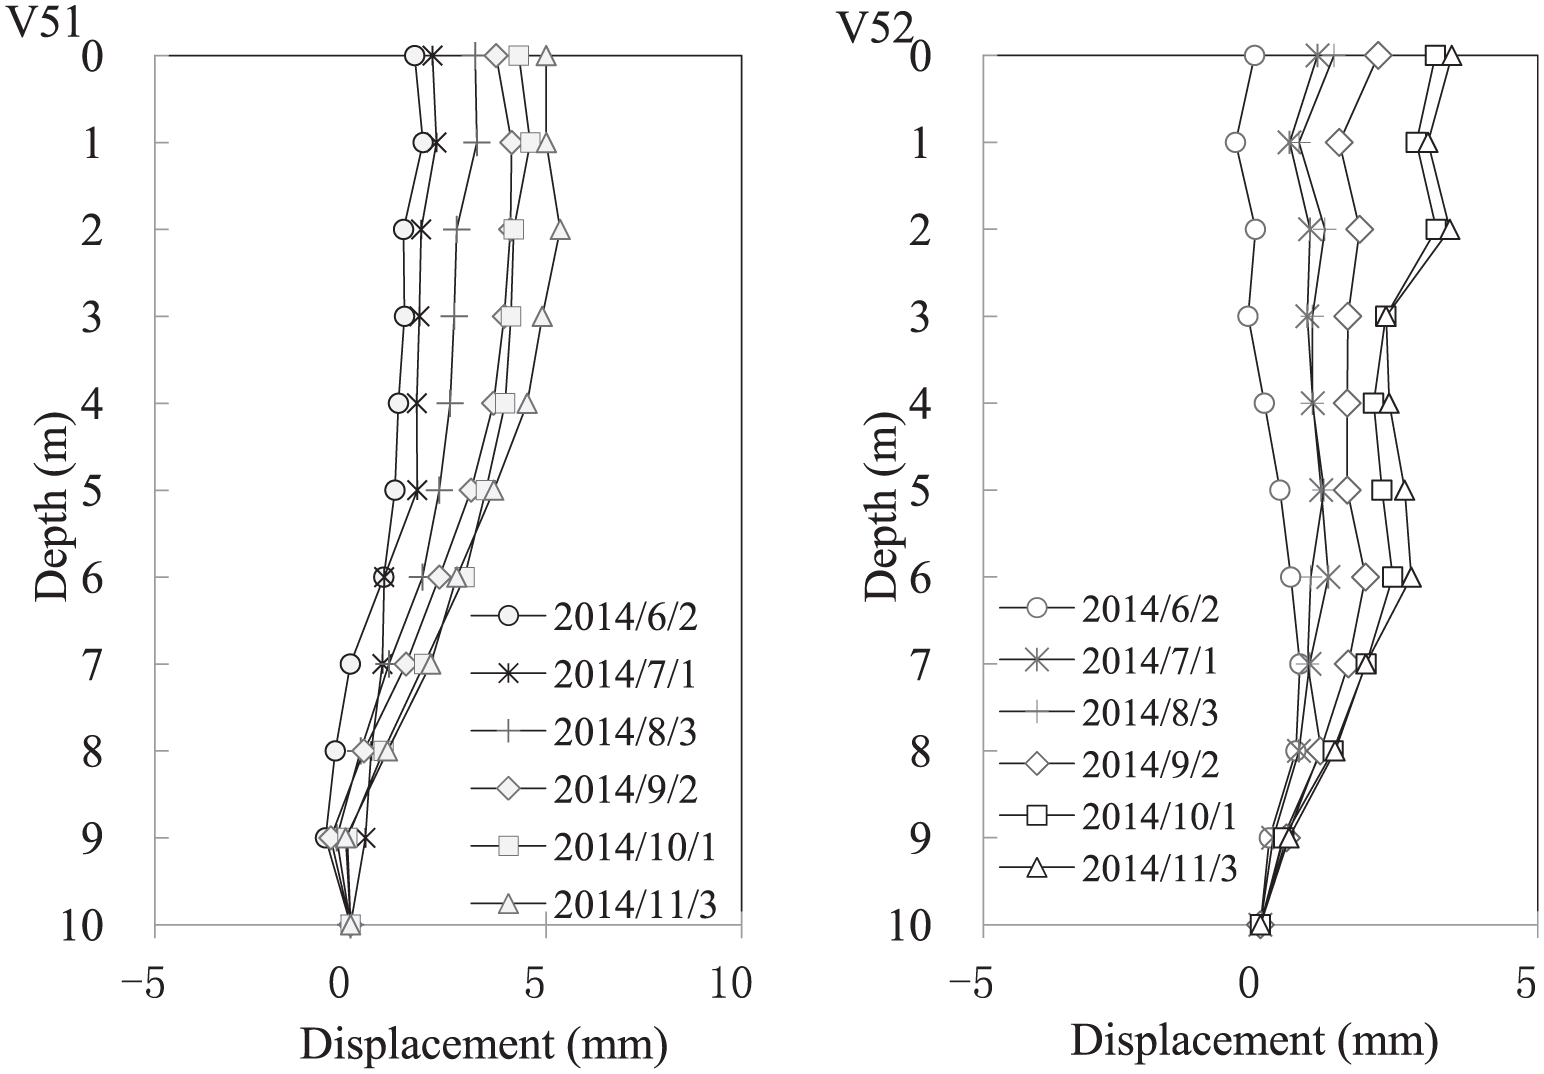
Measured displacement variations against inclinometer depth for V51 and V52.

Maximum average displacement rate against time for the two inclinometers V51 and V52.
Strain distributions of soil nails
The monitored strain data of soil nails can be used to assign early warning status of slopes at different levels. 23 The maximum tension strain of a soil nail was also used to analyze the potential instability issue of slope. In case the slope becomes unstable, the maximum strain will present an abnormal rise which can be detected by the data collection system in this study. All the measured axial strain distributions along the soil nails are shown in Figure 9. Optical fiber sensors mounted on the soil nails SN2 and SN6 were completely damaged so that no strain data were collected from the two soil nails. It is clear that the measured strains tend to increase continuously for the soil nails SN1 and SN3 in the first 5 months after initial readings, approaching a level of around 184 με on SN1 and around 160 με on SN3. The obtained strain data of the soil nails SN4 and SN5 are relatively lower compared with SN1 and SN3. The occurred maximum axial strain of the soil nails SN4 and SN5 in the fifth month were around 120 and 60 με, respectively.

Axial strain variations against elapsed time for different soil nails.
All the measured average strain rates of the four soil nails are shown in Figure 10(a) and (b). It is clear that most strain rates of the soil nails SN1 and SN3 occur within a range between 0 and 2 με/day as shown in Figure 10(a). The most obvious ground movement is present in the fifth month characterized by a maximum strain rate of 2 με/day on the soil nail SN3. Strain rates of the soil nails SN4 and SN5 are relatively more scattered than those of SN1 and SN3. The maximum strain rate of the two soil nails was around 1.5 με/day, occurred in forth month on soil nail SN4. The two observed high strain rates in the fourth or fifth month after initial reading indicates that the axial strain rates of soil nails appear to rise as the time elapses. In addition, the axial strain rates of soil nails appear to change more obviously in the middle sections of soil nails than at the two ends. This is mainly due to the fact that the soil nail heads and tips are basically two free ends, where neither initial bending nor tension occurred.
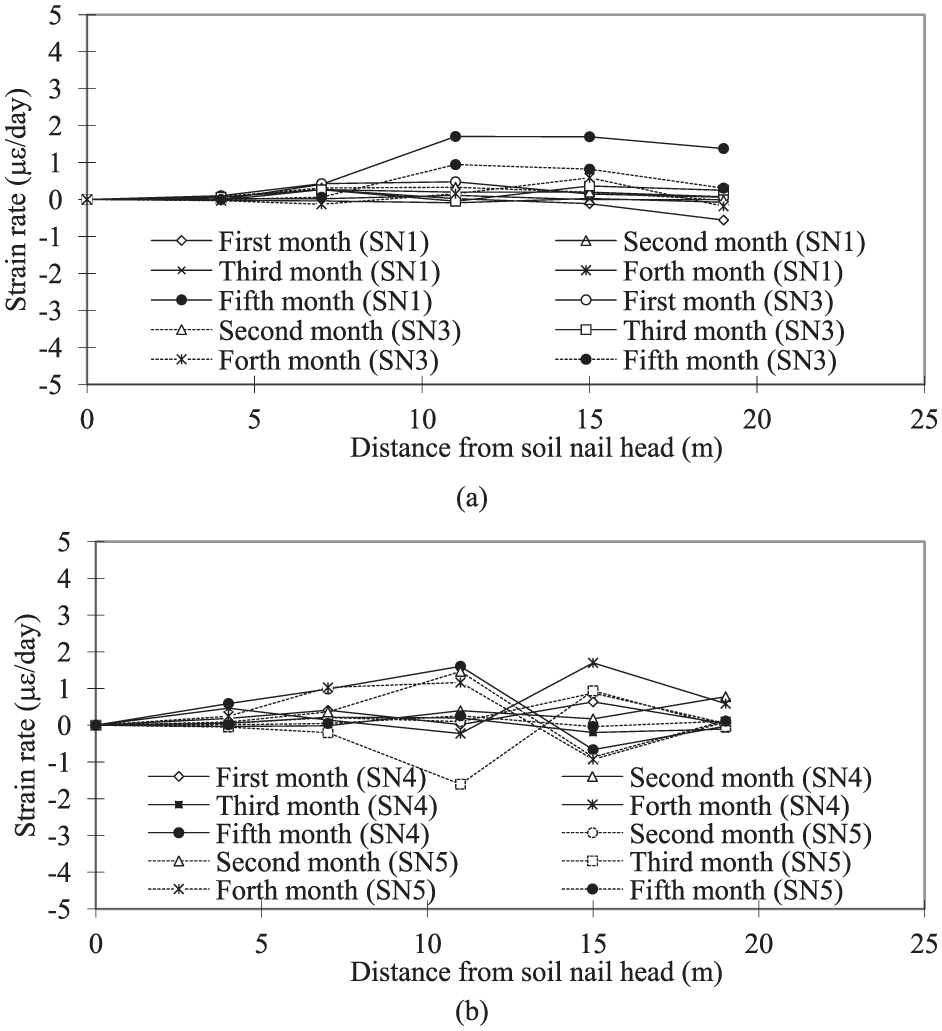
Axial strain rate variations of soil nails against soil nail distance for (a) SN1 and SN3 and (b) SN4 and SN5.
Early warning of expressway slopes based on statistical analysis
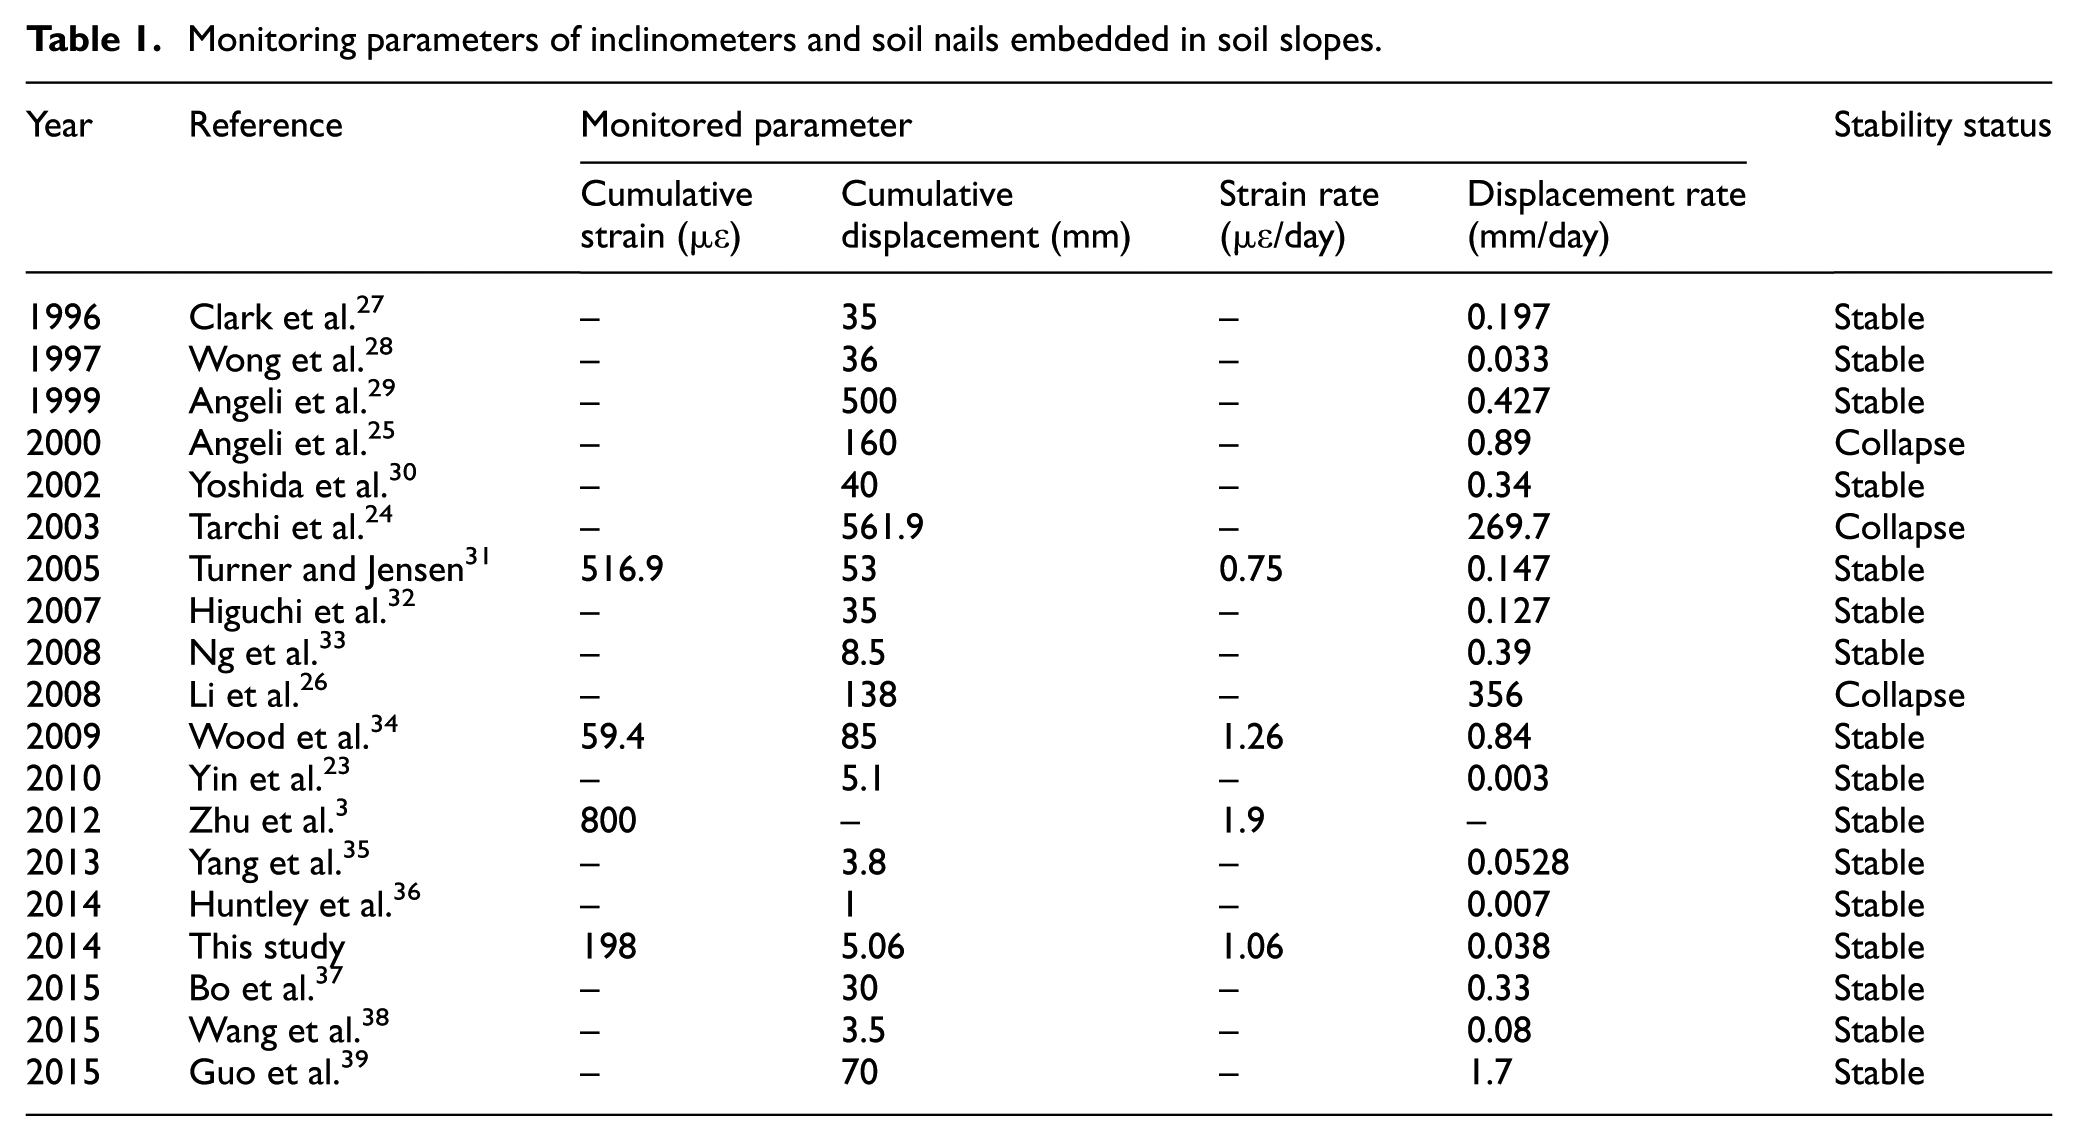
Stability evaluation of slopes can be carried out based on the strain of soil reinforcements (soil nails or anchors) and ground displacement (inclinometers). Table 1 presents the monitored parameter data of some typical slopes in the literature. These parameters include cumulative (or maximum) displacement, cumulative strain, displacement rate, and strain rate. It is seen that there are limited strain rate data of soil reinforcements in the literature but extensive ground displacement information monitored from the inclinometers. The maximum cumulative strain of reinforcements (soil nails or anchors) and cumulative displacement in a stable slope approached 800 με3 and 500 mm, 24 respectively. Cumulative displacements of collapsed slopes are 160, 25 561.9, 24 and 138 mm, 26 respectively. These maximum cumulative displacements are much larger than the displacement magnitudes of stable slopes. Figure 11 shows the maximum displacement rates and cumulative displacement values from various slopes. It is clear that these monitored data are highly scattered for different types of slopes as their geological conditions were highly varied. Quantitative analysis of safety status for slopes based on these monitored data is therefore very difficult due to the highly different geological conditions and the various influencing parameters. In case the parameter samples that include strain/displacement information from all slopes form a population, we can carry out statistical analysis for these slopes taking into account both samples’ deviations and means. We can also indicate the safety condition of a slope by considering certain confidence interval.
Monitoring parameters of inclinometers and soil nails embedded in soil slopes.
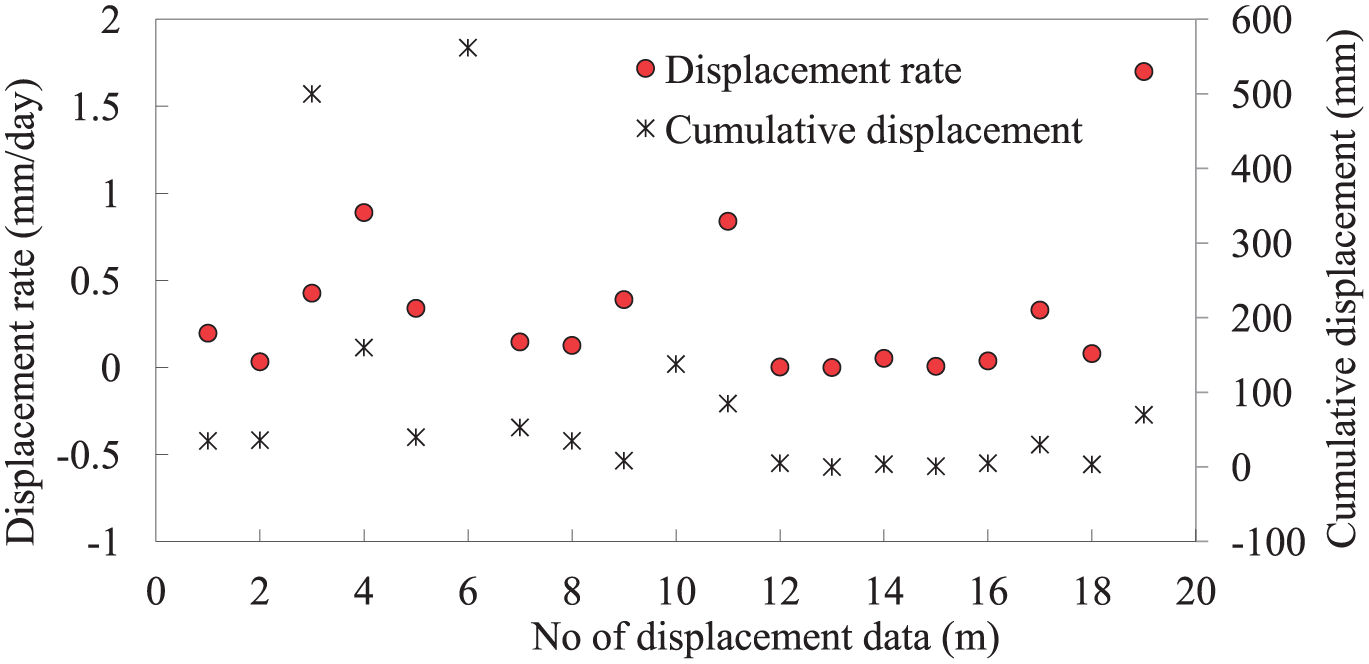
Maximum displacement rates and cumulative displacement values from different slopes in the literature.
The displacement and strain information forms a population for statistical analysis of slope safety status. In this study, the mean displacement rate X of slopes is considered as a population, which is assumed to follow normal distribution with unknown population mean u and variance σ2. The selected mean displacement rates are random samples forming a normal distribution. A basic statistical analysis can be conducted to find the range of mean displacement rate at certain confidence level. 40 Sample mean is the unbiased estimator of population mean. The unknown variance σ2 is represented by S2, which can be estimated by sample variance. Hence, the t distribution is proposed to construct a valid confidence interval as follows

where T has a t distribution with a degree of freedom of n – 1. A confidence interval corresponding to 100(1 – α)% one-sided confidence interval on u is given by

According to the slope movement history in the same region of the current monitored slopes, the sample mean and standard deviation of displacement rates are 0.315 and 0.444 mm/day, respectively. n is 15 (number of average displacement rates of the stable slopes in the same region). Considering the typical confidence levels 90%, 95%, and 99%, the related confidence intervals (maximum mean displacement rates) on u are 0.156, 0.106, and 0.004 mm/day, respectively, as shown in Table 2. For a specified slope with the measured average displacement rate, the stability status of slopes can be evaluated taking into account different confidence levels. In the case of a 95% confidence level, a related threshold limit of 0.106 mm/day is selected as the upper bound of average displacement rate.
Confidence intervals on u for different confidence levels.

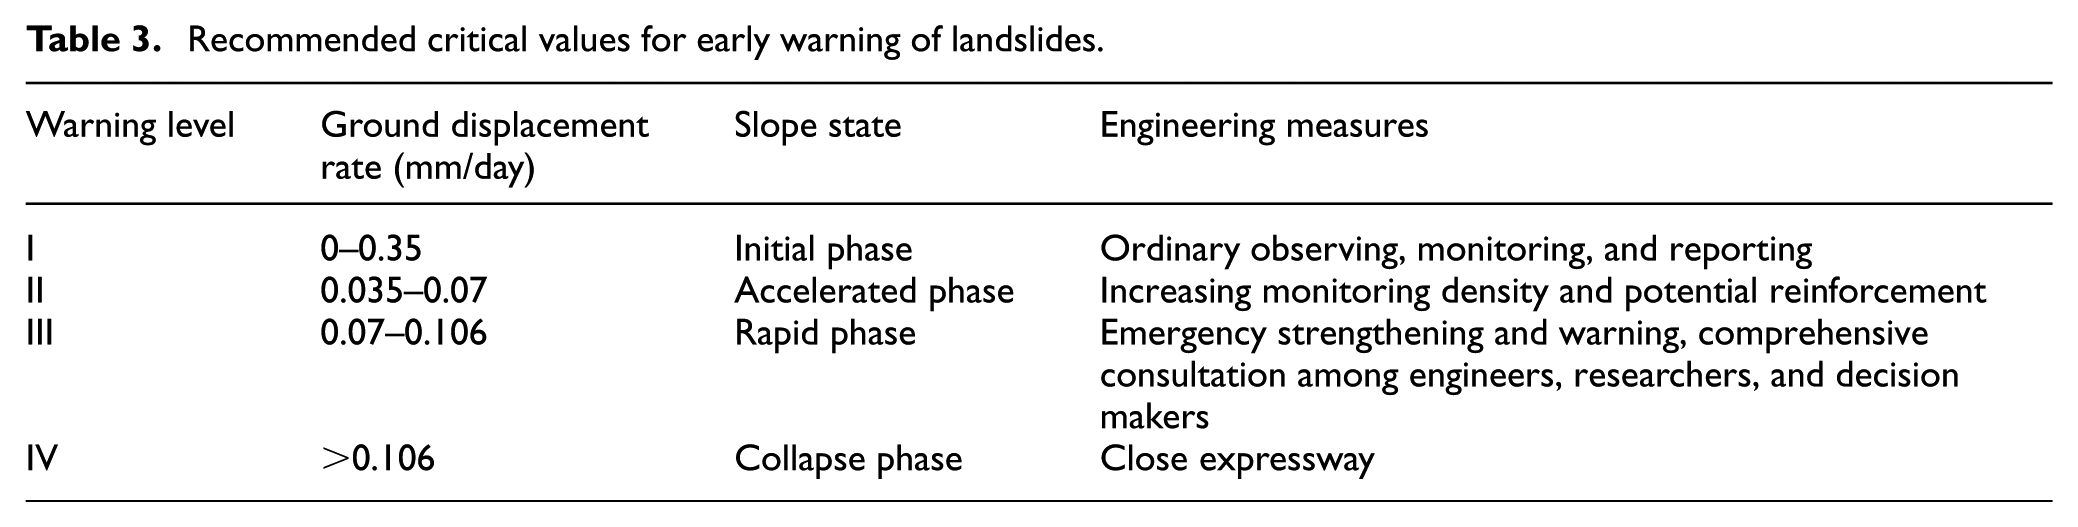
Warning status of expressway slopes can be divided into different levels with different essential actions to mitigate potential risk associated with landslide in field. Threshold limits of displacement rates corresponding to different warning criteria are essentially required. Table 3 presents the recommended critical values for early warning of landslides and the associated engineering measures for the current monitored slope. The threshold limit of 0.106 mm/day was equally divided into three displacement rate ranges corresponding to different slope safety statuses. The proposed early warning method is divided into four different levels, including level I, level II, level III, and level IV, and four corresponding safety statuses, including the initial phase, accelerated phase, rapid phase, and collapse phase. If the slope is relatively safe at level I, the slope is characterized by the initial creep state. The related essential engineering activities shall be adopted to deal with the monitored slope, such as ordinary monitoring and reporting. In case level II is achieved, an increase in monitoring density and reinforcement should be considered, to prevent a further ground movement. Emergency strengthening and on-site warning can be considered if the slope is at rapid phase (level III). Typical abnormal phenomena should be monitored such as ground cracks and sliding within this phase. Continuous consultation should also be carried out among experts, engineers, researchers, and decision makers. The expressway has to be closed if level IV (collapsed state) is approached. Therefore, engineers can take essential measures to mitigate these risks associated with potential landslides occurring at different warning levels. The average displacement rate of the expressway slope in this study is 0.054 mm/day (within the range 0.035–0.07 mm/day), and therefore the slope state is at accelerated phase. It is noted that the FBG-based system can be used for remote monitoring of slopes, so that all monitoring data can be collected at monitoring station where engineers can receive the monitored information and transfer warning signal to managers to take essential measures. The slope was found to be stable as neither obvious change of strain/displacement nor cracks were observed during the monitoring period. The early warning method suggested in this study can be used for slopes which have similar geological conditions with the present slopes. However, researchers can also carry out more safety analysis for different slopes in terms of the same statistical analysis method.
Recommended critical values for early warning of landslides.
Conclusion
This article has proposed a safety monitoring and early warning system of expressway slopes based on optical fiber sensors. This monitoring system was developed based on the measured information of displacement, strain, and their increasing rates. Early warning method of the monitored slopes was also proposed with a number of suggested threshold limits for different warning levels.
Safety monitoring of a real expressway slope was achieved by monitoring the mechanical performance of soil nails and inclinometers using optical fiber sensors. Both the measured strain and displacement presented a progressive rise as the time elapsed. The maximum magnitudes of cumulative strain and displacement in the present monitored expressway slope were 198 με and 5.06 mm, respectively. This FBG-based monitoring system of soil nails and inclinometers formed a real-time sensing network, assisting engineers to adopt quick and essential measures to deal with potential landslide risk.
An optical fiber sensor–based warning method of expressway slopes is also proposed based on the monitored information of strain, displacement, and their increasing rates. The four-level early warning method based on statistical analysis is proposed characterized by four different ranges of displacement rates. Four different engineering measures were also suggested to treat slopes at different safety statuses for engineers and researchers.
Early warning method in the present analysis was mainly developed based on the horizontal displacement rate of expressway slopes without the consideration of strain rate variations of soil nails due to the limited history data for statistical analysis. A further analysis is strongly suggested to correlate safety status of expressway slopes with strain rates of possible internal reinforcements such as soil nails, anchors, and piles.
Footnotes
Handling Editor: Hongyan Ma
Declaration of conflicting interests
The author(s) declared no potential conflicts of interest with respect to the research, authorship, and/or publication of this article.
Funding
The author(s) disclosed receipt of the following financial support for the research, authorship, and/or publication of this article: The authors wish to acknowledge the financial support from the National Natural Science Foundation of China (NSFC; Project Nos 41602352 and 41472240), Key Laboratory of Structure and Wind Tunnel of Guangdong Higher Education Institutes, Shantou 515063, China (Project No. 201603), the Fundamental Research Funds for the Central Universities (17D110116 and 2015B25514), and Henan Key Laboratory of Textile Materials.