
Abstract
In this article, we investigate the problem of personal message acquisition optimization for intelligent apparatus in the space information network. The quality of experience for persons during achieving the synthetical message rapidly and exactly through the apparatus is significant to the apparatus layout. In this article, we presented a quality of experience–oriented synthetical statistical analysis optimization approach for the personal message acquisition for intelligent apparatus. The main contribution is that the mathematical analysis is combined with the statistical data for the assessment of the personal message acquisition to overcome some drawbacks in the existing works. Experiments verified that the presented approach could make the personal message acquisition with much higher quality of experience.
Keywords
Introduction
The space information network (SIN) has drawn much attention recently.1–5 Kawamoto et al. 6 studied the effective data collection via satellite-routed apparatus system. With the development of SIN, the development of intelligent apparatus grows much faster. The apparatus is developing toward the integrated message display screen, where the synthetical message would be displayed. Then the quality of experience (QoE)-oriented personal message acquisition optimization (QOPMAO) for intelligent apparatus is very significant for the astronaut and the monitoring personnel. The intelligent apparatus message display deployment should follow the principles so that the personnel can understand the relevant functions rapidly. Zhen et al. 7 studied the design preference for touch screens, including navigational elements, text, display standards, and graphic style guide according to perception of study scope. Xue et al. 8 studied an autostereoscopic 3-D display suitable for the mobile environment is prototyped and evaluated. Mashashi et al. 9 proposed the service and the function by using the technique of the human centered design of the development of an attractive user interface that is an important item in the Mobile Phone. The authors proposed a concrete user interface by structurally describing value from which the user requests service and the experience according to it as a scenario. Sohn et al. 10 put forwarded some standards for the layout of the intellect apparatus message display screen and the approaches of optimization. Nakarada-Kordic and Lobb 11 studied that perceived attractiveness had a statistically significant effect on search perseverance, but not on accuracy and time-to-target. The findings highlight the need to further study web interface aesthetics especially in those contexts where the purpose is to keep the users online for longer.
In this article, we presented a QoE-oriented synthetical statistical analysis optimization approach for the personal message acquisition for intelligent apparatus. We combine the mathematical analysis and statistical approach intensively for the assessment of the personal message acquisition to overcome some drawbacks in existing works. Significantly, the QoE-oriented analysis and assessment is the characteristic. Experiments verified that the presented approach could make the personal message acquisition with much higher QoE.
The QoE-oriented personal message acquisition optimization approach
We present the QOPMAO approach to make the analysis. The QOPMAO approach would be consisted of the following three states:
The hierarchical diagram of fascination items for the message display screen of the apparatus would be built. This stage focuses on the subtle experiences in the consumer’s inner. Therefore, we might acquire the people’s preference and cognition on the apparatus and acquire the items. Although the items achieved through the assessment stage constituted the basic assessment, the significance sequencing and their weight relationship were still unknown.
Then, the items achieved by the assessment stage would be put forward into a quality model of consecutive vague model to analyze the quality attributes of items exactly. In the presented QOPMAO, we adopt the consecutive vague model which is based on the theories of the model and the vague model. The consecutive vague model integrates vague skills and the quantitative analysis method of the model. The question pair included a functional question that captured a customer’s perception of whether the apparatus had a certain attribute and a non-functional question that captured a customer’s perception if the apparatus did not have the attribute. Based on the responses, the apparatus attribute can be classified into one of five categories according to the assessment. We adopt the normalized effect number αij according to the results in Yu-Wen et al.
12
Based on the analysis of the questionnaire, the testees’ preference could be presented as

The participants were able to select a number as the value of the significance of each specific people demand. The numbers of
The average of the total participant QoE for a specific people demand is expressed by the assessment indicator, which was employed to represent the average assessment of all participants. Given N participants, the number of computing value might be calculated. The people QoE under the special people demand might be brought according to the mathematical set of the number of effect, which could be computed as
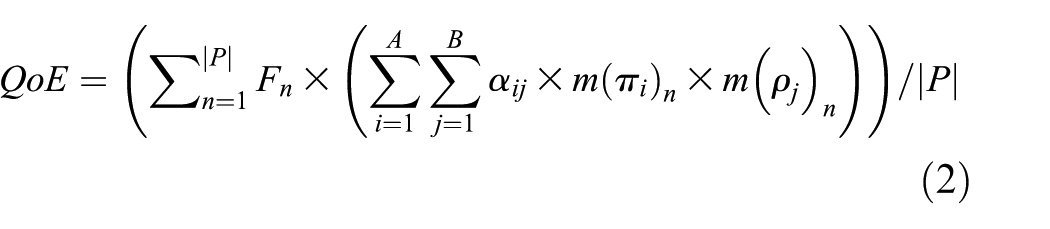
where
Experiment and analysis
The experiment courses
To verify the presented QOPMAO, we make the experiment on the apparatus’ personal message acquisition optimization. We adopt smartwatch message display screen as the experimental subject so that the experiment would be facilitated, since the users are commonplace. Of course, the presented approach could also be applied to other apparatus’ personal message acquisition optimization.
These specimens include the partial display and the total display. The former includes turn signal, tokens of pilot lamp, and attention tokens. The total display includes all the images, characters, numbers, and the scale of electronic quantity. The brand message and the colors have been deleted to avoid the mislead. The commonly used ingredients of message display screen include the hodometer, galvanometer, milometer, turn signal, and headlamp. Several kinds of formats were adopted in the typeface part. To achieve true effects, the specimens of apparatus were matched with the moving environment. The angle of incline displaying of the notebook computer is in accord with the angle of apparatus message display screen observed by the user. By comparing the assessment diagram of each user, and merging the similar descriptions, the assessment of all users was summarized.
The experiment results
According to the results listed on the assessment stage, times of mentioning the items were sequenced. The users’ responses were analyzed by adopting the questionnaire and the attribution estimating matrix. We used the items achieved through the assessment stage into a vague computing, exactly analyzed the users’ comments on the quality of the six attributes. Based on the result achieved through the vague computing analysis, we not only assess the kind of some item but also analysis the role to user’s QoE. In the stage of apparatus development, the ingredient deployment may integrate the demand based on the result of the order (Figures 1 and 2).
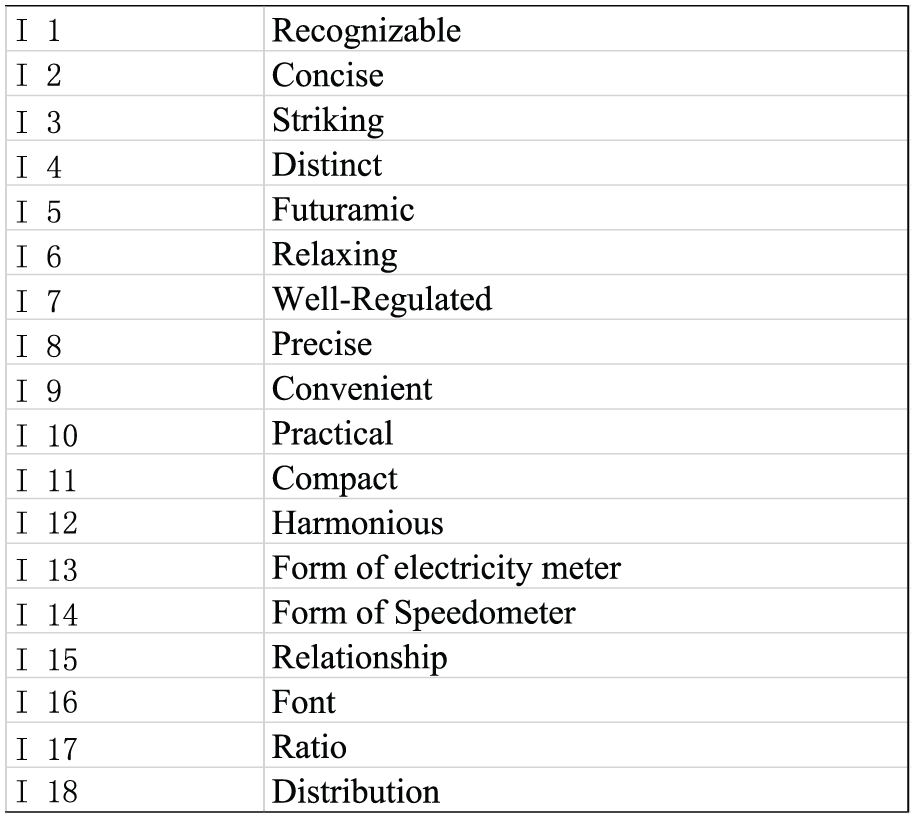
Statistical items.

Statistical results.
The result shows that “Item 1” is the top of the analyzed items. According to the results of quantification analysis, the form of electricity mete, the relationship, the amount, the typeface type, and the ratio together contribute to the “Item 1” experience.
According to Figure 3, the number of attribute 1, attribute 2, and attribute 3 exceeded threshold 0.70. The coefficient of determination was employed to account for the explain of the related variable. With the apparatus’s message display screen, the comparison between the spatial arrangements and measures of galvanometer and hodometer, the amount and distribution bring the experience of “distinct” for the users. According to the analysis result, under the item of “distinct,” the “amount” and the “distribution” have the most important effects and the highest coefficient. Under the item of “simplification, displaying-optesthesia,” and the “typeface” has the most significant effects and biggest coefficient of partial correlation, followed by the forms of hodometer and galvanometer (Figure 4).
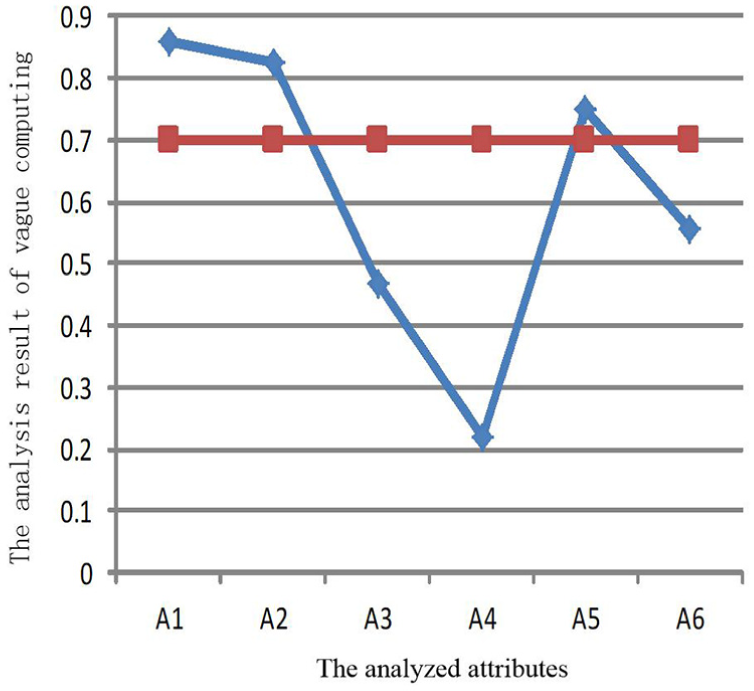
Vague analysis results.

Quantitative analysis results.
The results shows the three main items. People chose the instrument information display screen because of the following cases: the form of a hodometer, galvanometer, fonts, and numbers, in the form of aspect ratio, space arrangement, measurement, the amount of information, and the distribution of the surface.
The result analysis
The display method of pilot lamp would make the user get the message about the electronic quantity fast and exactly according to the design of recognizable in the apparatus message display screen. However, the pilot lamp could not be rapidly recognized because the electronic quantity token is compact. The electronic quantity token adopted by the galvanometer has its definite token images. It could inspire the message ingredient deployments of apparatus message display screen to combine the message electronic quantity token on the pilot lamp. In this way, it could keep the pilot lamp’s advantages of being recognized fast. At the same time, the token’ message would also be conveyed in a graphical way.
The big typeface and striking numbers of the digital hodometer are both important to hodometer, allowing personnel to get the related message better by observing the moving speed hodometer. Nevertheless, the point-type hodometer could consume much more space to show the messages of that speed which would cause the problem of limited space for some other ingredients.
The spatial arrangement between the galvanometer and hodometer, the measure comparison, the amount of message on the message display screen, and the distribution brings the experience of “distinct” for the users. Thus, it requests the message ingredient deployment on the message display screen to take the significant and sub-significant message into consideration. The hodometer should user a bigger space than the galvanometer. In addition, the hodometer should be strikingly displayed and be arranged at the center region of the apparatus message display screen.
The way to arrange the messages on the display screen beautiful is one of the important issues. It is more challenging when the space is strictly limited. The apparatus message display screen with the two important items of “simplification and displaying-optesthesia” could show the messages in an efficient way and achieve the optesthesia aesthetics of users at the same time.
Conclusion
The apparatus is moving toward the integrated message system. People would like to select an apparatus message display screen with good QoE where the significant message is properly displayed and the significant and sub-significant message is well-matched and well-regulated. In this article, personal message acquisition optimization for intelligent apparatus in SIN was studied to realize the synthetical message achieved rapidly and exactly. We presented a QoE-oriented synthetical statistical analysis optimization approach for the personal message acquisition for intelligent apparatus. We combine the mathematical analysis and statistical approach for the assessment of the personal message acquisition to overcome some drawbacks in the existing works. Experiments verified that the presented approach could improve the layout of intelligent apparatus message display screen.
Footnotes
Handling Editor: Ota Kaoru
Declaration of conflicting interests
The author(s) declared no potential conflicts of interest with respect to the research, authorship, and/or publication of this article.
Funding
The author(s) received no financial support for the research, authorship, and/or publication of this article.