
Abstract
This article aims to measure bicycle facility operating state based on the survey and analysis of bicycles’ abreast riding. We conducted a detailed bicycle operating investigation consisting of four exclusive bicycle paths in Nanjing, China, and introduced an approach to extract the data of bicycle abreast riding from bicycle arrival data. Then, the relationships between bicycle volume and bicycle group size, abreast riding number, lateral clearance, and path width occupancy were discussed. In the end, we compared passing event, macro bicycle flow parameter, and single riding ratio in representing a cyclist’s individual comfort, suitability, and difficulty to data acquisition. The results and conclusions we obtained are as follows: (1) bicycle group size, abreast riding, and path width availability keep a positive correlation with bicycle volume, respectively, while single riding proportion and lateral clearance have a negative relationship with it. (2) Bicycle single riding proportion is a better parameter reflecting bicycle level of service from an objective perspective. We first studied bicycle abreast riding from a vantage point of bicycle group. Single riding proportion offers bicycle facility appraisers another possible choice to assess bicycle level of service. Path width occupancy is very useful in optimizing bicycle facility.
Keywords
Introduction
In modern urban traffic development, bicycle receives more concern as a green and energy-saving mode of transport. In recent years, the popularity of electric bicycle creates new momentum for Chinese bicycle transport. Meanwhile, it produces more demand and challenges to bicycle facility design and construction. Evaluating bicycle level of service (BLOS) is the base of designing and constructing a bicycle path. The conventional BLOS evaluation method in China considers more from overall bicycle flow operation and involves individual perception of service less. The evaluation method reported in Highway Capacity Manual 2010 (HCM2010) is based upon the non-motorized facilities in the cities of Western countries. The user groups and device settings of these facilities differentiate noticeably from the counterparts in China. Thus, this article aims to propose a BLOS evaluation method from a vantage point of bicycle micro-riding behavior. The method considers more about bicycle commuting environment in China which has much higher volumes than those in western cities.
On a bicycle path, when the bicycle volume is low, each bicycle has enough riding space. In this case, most bicyclists prefer to drive alone. As the volume grows, bicyclists have to follow others or ride in a group. In this situation, abreast riding may occur. That is abreast riding may reflect the change of bicycle flow state and BLOS. Hence, we research on the phenomenon and try to explain its relationship with BLOS.
The objective of this article is to propose a new parameter based on bicycle abreast riding to measure bicycle facility operating condition. The facilities to observe are four exclusive bicycle paths in Nanjing, China. The path users are bicycles and electric bicycles.
Literature review
Botma 1 first proposed to use passing events to evaluate the BLOS in 1995. His work was then accepted and followed by other researchers.2–5 Among them, Li et al. 4 proposed a method to model bicycle passing maneuvers on multi-lane bicycle paths and Zhao et al. 5 used the cellular automata method to model the characteristics of bicycle passing events in mixed bicycle traffic. The two studies were both under the context of high bicycle ridership in China. Botma’s model was adopted by Highway Capacity Manual 2000. 6 Green et al. 7 pointed out the limit of BLOS evaluating method reported in HCM 2000, and they presented a new evaluation method based on the number of passing and meeting events. Hummer et al. 8 introduced Green’s approach in report Evaluation of safety, design, and operation of shared-use paths. Landis, 9 Sorton, 10 and Epperson 11 developed a model, or group of models, that describe the quality of service afforded bicyclists in the shared-roadway environment. Landis et al. 12 suggested applying real-time human perceptions in assessing BLOS. Their approach received much attention and was extended by other scholars.13–15 Petritsch et al. 13 created a PROBIT model that predicted how bicyclists perceive the arterial roadway environment based on the field data obtained in Florida, USA. Jensen 14 examined the effect of existing traffic operations, geometric conditions, and other variables on cyclists’ satisfaction in Denmark. Li et al. 15 investigated the factors that contribute to bicyclists’ perception of comfort on physically separated bicycle paths and quantified their impacts. HCM 2010 integrated the ability of a bicyclist to maintain an optimum speed, the number of times that bicyclists meet or pass other path users, and the bicyclist’s freedom to maneuver in BLOS evaluation. 16 In China, the method reported in the literature 17 was generally accepted by researchers, which focused on macro indicators to assess BLOS.
The literature review above shows that scholars have presented many methods and indicators to assess BLOS, including passing events, human perceptions, and freedom to maneuver. The approaches can be divided into two categories. One is based on cyclists’ subjective perceptions and the other is from an objective perspective of bicycle flow operation. Both are comprehensive and practical. But most of them focus on the bicycle facilities and user groups in western cities. The situations in China are considerably different from the counterparts in western cities. Bicycle volumes in Chinese cities are noticeably higher than those in western cities and the users on bicycle paths are only bicycles. The approach adopted in China is biased toward macro indicators. To evaluate BLOS from a micro-vantage point, we conducted a research on bicycle abreast riding.
Methodology
Definition of bicyclists’ abreast riding
Before researching bicyclists’ abreast riding, we need to define the behavior of abreast riding clearly, or need to know under what condition abreast riding will happen. We consider bicycles are moving abreast in a bicycle group when the headways between them are below the half of the length of a design bicycle. According to the physical dimension reported in Guide for the planning, design, and operation of bicycle facilities, 18 a design bicycle is 0.75-m wide and 1.8-m long. Thus, when the headways of some bicycles in a group are under 0.9 m, they are riding side by side (illustrated in Figure 1).
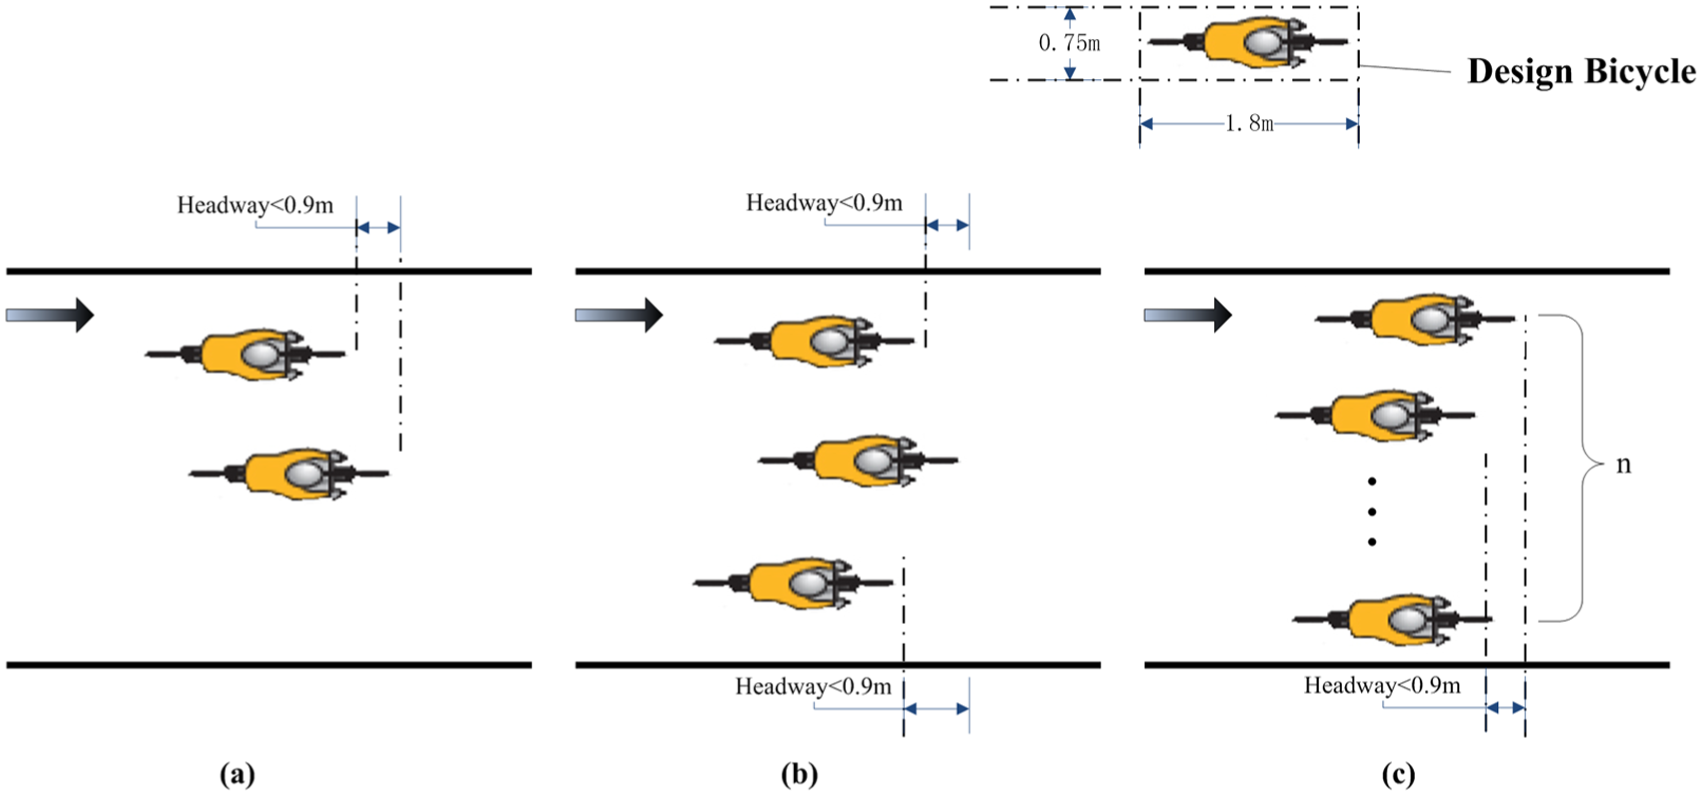
Design bicycle and definition of abreast riding: (a) Riding 2 abreast, (b) Riding 3 abreast, and (c) Riding n abreast.
Data collection
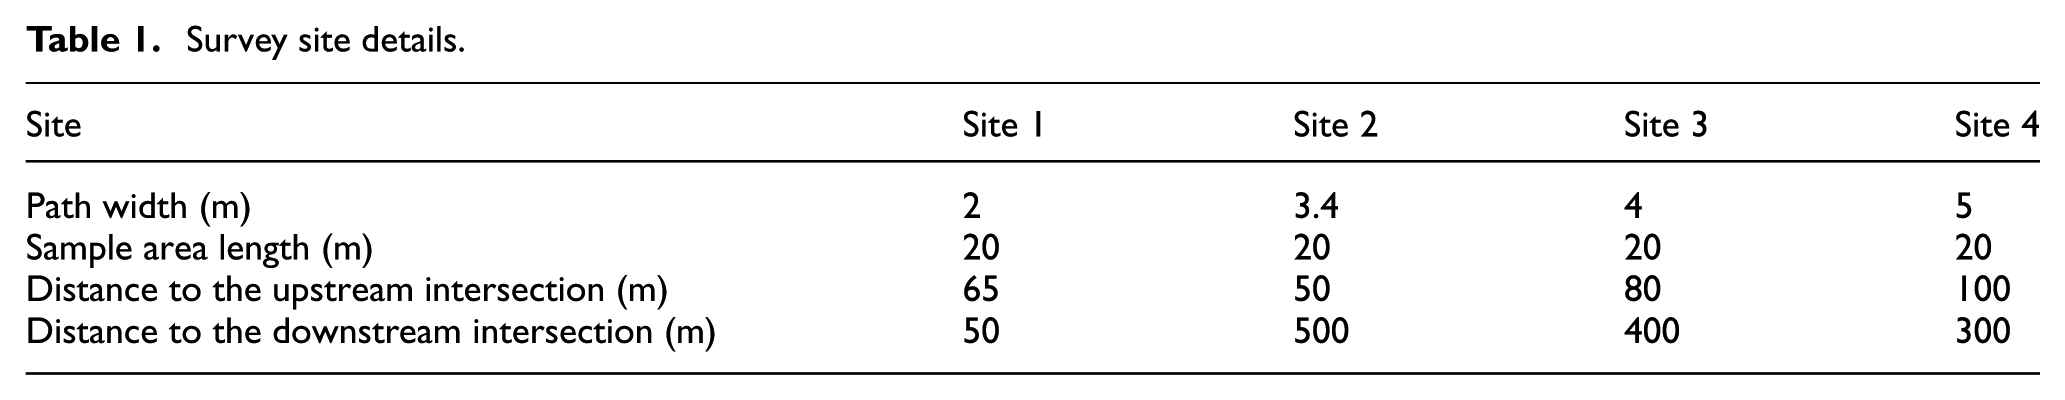
The method to collect bicycle data was camera recording. We investigated the bicycle operation during workdays in Nanjing. The observations were timed between 7:00 and 9:00, and 17:00 and 19:00. The two periods are the commuting interval in Nanjing. Here are the selection criteria of survey sites:
Bicycle paths of different widths;
Paved level terrain, good sight;
Far from intersections, block accesses and bus stations;
High bicycle volume;
An acceptable vantage point for a camera.
We finally identified four exclusive non-motorized paths, and the details are listed in Table 1.
Survey site details.
The equipments of the investigation included a tape measure (50-m long), a camera, a tripod (its maximal height is 4 m), six red traffic cones, and two white tapes. Because the camera worked at a top view, the white tapes pasted on the path were markings. When bicycles came, they would cover the tapes. So, the traffic cones were auxiliary signs.
Our field observation consisted of three procedures: measuring the physical dimensions of the sample area, marking the area with the white tapes and traffic cones, and setting up the camera and shooting. Figure 2 presents the detailed settings.

Setting details for the observation.
Data processing
Due to the dynamics of cycling, it is a difficult task to capture the bicycles in abreast riding directly. Thus, an indirect calculation method was adopted. According to the definition of abreast riding mentioned above, it is viewed as riding abreast when the headways between bicycles are below 0.9 m. So abreast riding is transferred to space headway computing. Constant relative position of bicycles is a necessary condition for headway calculation. This is basically the usual cases for bicycles in group riding, each of which is restricted by the surrounding ones. Because of this, we counted bicycles by groups.
Bicycle groups were first numbered according to their arriving orders. Then, the time was noted when each bicycle just reached every white tape. Statistical interval was 60 s. In all, 30 intervals were recorded at each site.
Through four-step processing of the raw arrival data, we had the data of abreast riding, lateral clearance, and availability of bicycle path width. The procedures are listed in Figure 3. The following are the detailed methods.
Step 1. Time headway and velocity calculation. The formulas used for this step were (1) and (2). Here, the figure to compute time headway is the moment when bicycles reached the second white tape


where
Step 2. Space headway computing. Here, we assumed the velocities of all the bicycles in the sample area and the time headways between them remained unchanged. When a bicycle in a group arrived at the second white tape, the headways between this bicycle and the other ones in the group were calculated with formula (3)

where
Step 3. Abreast bicycles identification. For bicycle i, we used the following approach to identify its abreast bicycles in the group


where
Step 4. Average lateral clearance (ALC) and average path width occupancy (PWO) computing. The formulas were as follows


where


where

Data processing procedures.
Results and discussion
Bicycle group
Using mean bicycle number to describe a bicycle group size, we find bicycle group size in bicycle flow keeps a positive relationship with bicycle volume (see Figure 4). That is bicycle group size increases as bicycle volume grows. This means bicyclists ride on the bicycle path freely and dispersedly when the volume is low. As the volume goes up, bicycles start to move after and coordinate with others. In other words, bicycle groups appear and their sizes gradually grow. To determine the relationship between bicycle group size and volume, linear function is used to fit the data from four sites. The results listed in Table 2 reveal that linear function performs well in the fittings.

Relationship between bicycle group size and volume.
Linear fit results between bicycle group size and volume.

Gs = group size; SSE = sum of squares due to error; RMSE = root mean square error.
Abreast riding
Table 3 illustrates that single riding always has the biggest share in bicycle groups. This accounts for that group motion does not equate to moving side by side. Also, bicyclists prefer to ride alone rather than two or more abreast. This ensures them more personal space and comfort. However, the proportion of single riding decline with volume’s rising. Taking site 4 as an example, we can see the decreasing trend in Table 3. This demonstrates some are losing the condition of single riding and BLOS becomes worse.
Statistical results of single riding proportion and abreast bicycle number.
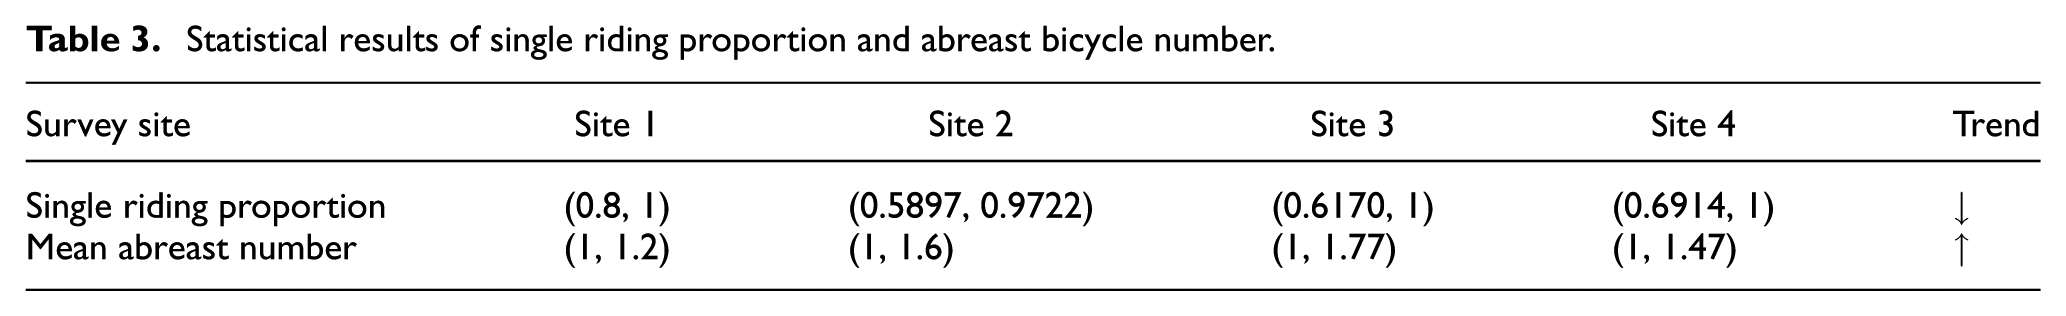
Simultaneously, riding abreast in a group is ascending (shown in Figure 5). The figure about mean abreast number of bicycles also illustrates the change. The mean abreast numbers at four sites experiences different degree of increasing (see Table 3). This shows that volume increase forces some bicyclists to move side by side and thus their riding comfort deteriorates.

Relationship between different abreast bicycle numbers and volume.
According to the varying characteristics of single and abreast riding, we can deduce the whole changing process of single riding in a bicycle group as bicycle arrival goes up. When few bicycles are on a path, all bicyclists may drive alone (illustrated in Figure 6(a)); with more bicycle arrivals and a higher volume, some bicyclists have to ride abreast and the single riding sees a gradual decline (see Figure 6(b)). After bicycle flow reaches the saturation state, bicycles’ continuing arrivals would contribute to a congestion of the flow. Meanwhile, more bicycles are in abreast and single riding proportion continues to fall. When bicycle flow is blocked completely, no bicycle is riding alone (shown in Figure 6(c)). As described above, the quantity of bicycles’ single riding is closely related to BLOS and a symbol of BLOS.

Single-ridings in different bicycle flows: (a) free flow, (b) medium flow, and (c) jam flow.
Lateral clearance
ALC is used to measure the lateral space each bicycle can share. Figure 7 shows a negative linear correlation between ALC and bicycle volume. We have found more abreast ridings arise from a growing volume. On a bicycle trail of a fixed width, more abreast driving lead to individual space decrease in lateral direction necessarily. Lateral clearance is the direct symbol of a bicycle’s level of service. Thus, it can be applied in comments to describe the BLOS state concretely.

Relationship between average lateral clearance and volume.
PWO
On a bicycle trail, a higher volume will cover more flow space (see Figure 8). Due to the restriction of path width, when abreast riding number reaches the top value the path width allows, the PWO obtains the maximum (calculated with formula (9)). Figure 9 shows the PWO maximums of 30 intervals at each site. The red lines mark the location of the theoretical maximums. We can see that the actual values of the first 3 sites all reach their respective theoretical top. The actual value at site 4 is 0.75, below the theoretical maximum. The frequency that a path reaches its PWO maximum presents the use level of the path. From the ratio data on the last bar of each sub-graph, it is obvious that the usage decreases as a bicycle path widens. Especially, the path should be narrowed at site 4 because it never reaches its theoretical top. And we also consider narrowing the path at site 3 due to its low use level, with the maximums only being fulfilled at 16.7% of the time.

Relationship between average path width occupancy and volume.

Path width occupancy maximums of the four sites, the percentiles on the last bar of each sub-graph means the proportion of this situation in all the cases: (a) Site 1, (b) Site 2, (c) Site 3, and (d) Site 4.
In sum, comparing theoretical maximum and actual value, an engineer can determine the necessity to reconstruct and how to modify the width of a bicycle path. If the actual value was below theoretical maximum, it means design volume is not reached and the path can be narrowed according to the actual value. On the contrary, the actual value always peaks at its theoretical maximum, which means the path needs to be widened

where the symbols are the same as before.
Comparison of three objective measures
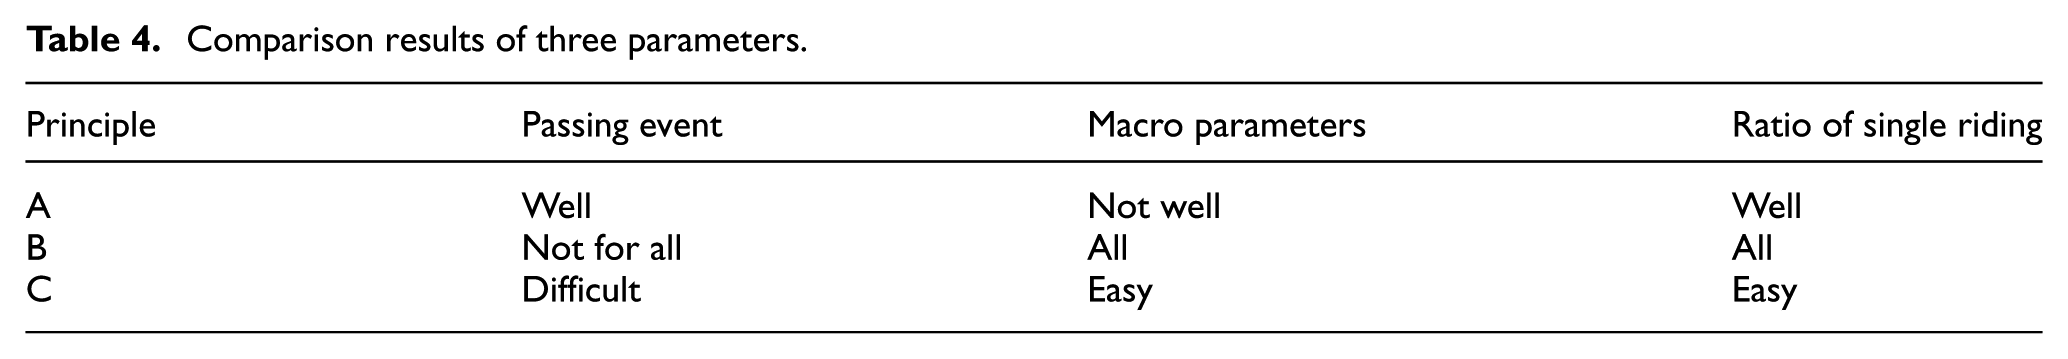
As mentioned in the literature review, passing event is an influenced parameter to evaluate bicycle operation in Western countries, while Chinese practitioners use macro parameters (e.g. volume or density) more often. After the discussion about the relationship between single riding and bicycle operating state, we found ratio of single riding in a bicycle group was also a close indicator related to BLOS. All these three assess the state of bicycle operation from an objective perspective. It is necessary to compare the three to determine their suitability in Chinese context. The following principles are applied in the comparison:
Whether it well reflect the comfort state of each cyclist in a bicycle group or not.
The suitability in diversity bicycle flow states and various types of cycling facilities.
The degree of difficulty in data acquisition.
Table 4 shows the comparison results of three parameters. For the first principle, macro parameters are usually aggregated measurements, so which cannot reflect each individual’s comfort well. Both passing event and single riding are more focused than the macro ones. The former represents the desire of a cyclist who tries to obtain higher level of service through overtaking the others, while the latter is the comfortable state a cyclist pursues. It is known that implementing a passing need enough lateral and forward space which is gradually lost as bicycle volume or density rises. A bicycle cannot complete a passing at some point when bicycle flow has not reached the definitely jammed state. So, passing event has no means after this point. For the other two, they are always observable from free flow to blocked state. In contrast to the other two parameters, a passing event is a process rather than an instant phenomenon. This increases the difficulty of observing, and the degree of difficulty will rise because completing a overtaking become harder as bicycle volume or density grows. It is easier for computers to measure an instant parameter than a process. This is important in automatic data collection in the future. Overall, observing the number of single riding provides a better choice for practitioners to evaluate bicycle operation.
Comparison results of three parameters.
Conclusion
This article conducted a study on bicycle group size, abreast riding, lateral clearance, and PWO and analyzed the close relationship between bicycle single riding proportion and level of service. On the basis of the above work, we obtained the following conclusions:
Bicycle group size, abreast riding, and path width availability keep a positive correlation with bicycle volume, respectively, while single riding proportion and lateral clearance have a negative relationship with it.
PWO maximum performs well in evaluating the width usage of a bicycle path. It can serve bicycle path or trail reconstruction.
Bicycle single riding proportion is a better parameter reflecting BLOS from an objective perspective, and it provides transport practitioners another choice to measure BLOS.
We first studied bicycle abreast riding from a vantage point of bicycle group. Proportion of single riding offers bicycle facility appraisers another possible choice to assess BLOS. PWO is very useful in promoting bicycle facility. The evaluating method of BLOS requires more data from diverse bicycle facilities to validate and support.
Footnotes
Academic Editor: Elsa de Sa Caetano
Declaration of conflicting interests
The author(s) declared no potential conflicts of interest with respect to the research, authorship, and/or publication of this article.
Funding
The author(s) disclosed receipt of the following financial support for the research, authorship, and/or publication of this article: This research was supported by National Key Basic Research Program of China (no. 51238008), National Natural Science Foundation of China (nos 51408322 and 51408145), and Guangxi Natural Science Foundation (no. 2014GXNSFBA118255).