
Abstract
The axial piston pump is a key component of the industrial hydraulic system, and the failure of pump can result in costly downtime. Efficient fault detection is very important for improving reliability and performance of axial piston pumps. Most existing diagnosis methods only use one kind of the discharge pressure, vibration, or acoustic signal. However, the hydraulic pump is a typical mechanism–hydraulics coupling system, all of the pressure, vibration, and acoustic signals contain useful information. Therefore, a novel multi-sensor fault detection strategy is developed to realize more effective diagnosis of axial piston pump. The presence of periodical impulses in these signals usually indicates the occurrence of faults in pump. Unfortunately, in the working condition, detecting the faults is a difficult job because they are rather weak and often interfered by heavy noise. Therefore, noise suppression is one of the most important procedures to detect the faults. In this article, a new denoising method based on the Walsh transform is proposed, and the innovation is that we use the median absolute deviation to estimate the noise threshold adaptively. Numerical simulations and experimental multi-sensor data collected from normal and faulty pumps are used to illustrate the feasibility of the proposed approach.
Introduction
Axial piston pump, one of the most widespread components in the hydraulic systems, has been widely used in industrial machines. It has some typical advantages, such as high power density, high limit pressure, and long service life. There is no doubt that the axial piston pumps are among the most common used power source in the industrial hydraulic systems. Due to the need of lubricating in the contact surface between the cylinder block and the valve plate, the surface of the cylinder block is made of a layer of copper alloy which is pretty soft and very easy to fail. The main causes of such failures include shock wave, dirty oil, cavitations, and so on. This failure always leads to the rupture of the oil film, which causes periodic pulses in the discharge pressure signal; the impact of valve plate and cylinder block, which causes periodic pulses in the vibration signal; the failure of triangle groove’s silence function, which causes periodic pulses in the acoustic signal.
All of the pressure, vibration, and the acoustic signals contain useful information, multimedia sensor networks as well as multiple classifiers ensemble of learners can improve the accuracy of pattern recognition problems, so it is necessary to develop a multiple sensor fault detection method.1,2 Frequency domain analysis is one of the most prevalent methods for monitoring conditions of axial piston pumps.3–6 We can transform the time domain signals to the frequency domain by the means of fast Fourier transform and Hilbert transform easily. But in many cases, such time domain signals are often interfered by various ambient noises and the transmission system, so it is also necessary to develop a denoising method to obtain better accuracy of fault diagnosis. 7
During the past several decades, there are many researches about the fault diagnosis of axial piston pump, taking into account the discharge pressure signal, vibration signal, or acoustic signal. Lu et al. 8 developed a method which combines ensemble empirical mode decomposition (EEMD) paving and optimized support vector regression model to detect faults and estimate the fault sizes of piston pumps based on the discharge pressure signals. Kumar and Kumar 9 developed an automated signal processing method to detect faults in the centrifugal pump based on the vibration signals. Mitchell et al. 10 developed a wavelet analysis method to diagnose the piston condition of the water hydraulic motor in a water hydraulic system based on the acoustic emission (AE) signals.
However, the hydraulic pump is a typical mechanism–hydraulics coupling system, all of the pressure, vibration, and the acoustic signals contain useful information. In order to obtain better diagnosis accuracy, multiple sensors are required to collect monitoring information. By comparing with the single-source information, the multi-sensor strategy results are more accurate in fault diagnosis and health prognosis.11,12
Figure 1 represents a two-dimensional (2D) schematic diagram of axial piston pump and the contact surface between valve plate and cylinder block. It is important to notice from Figure 1 that the cylinder block has a layer of copper alloy on the sliding surface, which maintains a good lubrication between cylinder block and valve plate that slide against each other, the aim of which is to mitigate direct surface-to-surface contact. The copper alloy layer during high-pressure operation can spall away from the cylinder block by the reasons of shock wave, dirty oil, and cavitations, which are very common in the practical working condition. In this article, we will mainly focus on the diagnosis of this fault.
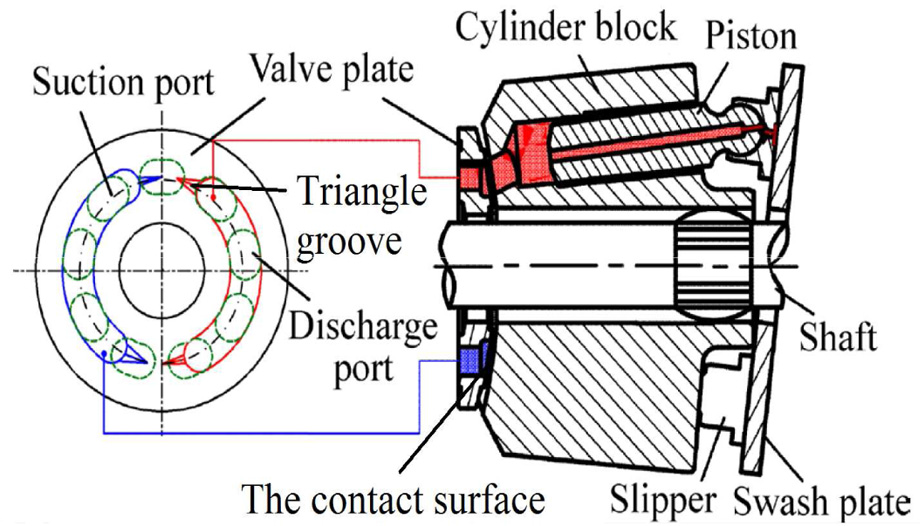
The components of axial piston pump.
So far, many advanced denoising approaches have been developed, which included the wavelet transform, empirical mode decomposition (EMD), and so on.
There are a number of advantages using the wavelet transforms for the purpose of faulty signal processing, particularly pertaining to noise suppression.13,14 A signal is decomposed into a set of wavelet coefficient, at each scale using the noise threshold, and finally gets the reconstructed signals. It is a good choice to deal with the non-stationary signals. However, there are some limitations using the wavelet transforms for noise suppression. For example, it always leads to oscillation effects when dealing with the low signal-to-noise ratio (SNR) scenarios, and the selection of wavelet basis is a difficulty in application. EMD is one of the most popular methods that have been recently developed in faulty diagnosis of axial piston pumps.15,16 A complicated signal can be decomposed into a number of intrinsic mode functions (IMFs) followed by the Hilbert spectrum analysis to calculate the corresponding instantaneous amplitude and instantaneous frequency hidden in the noisy signals. There are many advantages in the EMD, for instance, self-adaptive ability, can be applied to non-linear and non-stationary process, and well engineering application.17,18 However, there are also some limitations in this method, such as the distortion of the faulty impulses, the end effect, and the physical interpretations of IMFs. What’s more, EMD sometimes cannot extract fault features because of the mode mixing phenomena.19–21 To solve these problems, EEMD is developed by Wu and Huang, which can be applied to the spectral kurtosis optimized band-pass filtered signal and obtain a number of IMFs.22,23 However, the problems of reducing the narrow band impulses and huge running time are still need to be solved.24,25
Walsh transform was used in signal denoising filed for many reasons. It can decompose a signal into a set of orthogonal, rectangular waveforms which called Walsh coefficients. The transformation has no multipliers and is real because the amplitude of Walsh functions has only two values, +1 or −1. Walsh transform is a reversible transform, and the original signal can be recovered perfectly using the inverse Walsh transform. The differences between the original signal and the signal obtained from inverse Walsh transform equals zero, indicating perfect reconstruction. Because of the most of the signal energy is concentrated at lower sequency coefficients,26,27 truncating the higher sequency coefficients can help with noise suppression. For denoising purpose, the filtered coefficients are stored and used for signal reconstruction. The problem is to estimate the noise threshold. In this article, we use the median absolute deviation (MAD) as the adaptive noise estimate innovatively. The proposed method is ostensibly similar to the wavelet denoising, but there are effective improvements, such as it requires less storage space and is faster to calculate because it uses only real additions and subtractions.
The rest of this article is organized as follows: the fundamental theories of Walsh transform denoising method are briefly described in section “Walsh transform method.” Then, a simulation analysis is carried out to validate the effectiveness of the Walsh transform denoising method in section “Simulation signal processing.” The three experimental investigations are given in section “Experimental investigations.” And finally, we offer the conclusions in section “Conclusion.”
Walsh transform method
The Walsh transform is a non-sinusoidal, orthogonal transformation technique which decomposes a signal into a set of basis functions. These basis functions are Walsh functions, which are rectangular or square waves with values of +1 or −1. The Walsh transform returns sequency values. Sequency is a more generalized notion of frequency and is defined as one half of the average number of zero-crossings per unit time interval. Each Walsh function has a unique sequency value. You can use the returned sequency values to estimate the signal frequencies in the original signal. The Walsh transform is used in a number of applications, such as image processing, speech processing, filtering, and power spectrum analysis. Walsh functions have many different definitions and are used for various applications, for instance, strict sequency ordering Walsh functions which are favored for communications; Dyadic ordering Walsh functions, which are also known as Paley ordering, which have certain analytical and computational advantages; Hadamard ordering Walsh functions which are used in controls applications. 28 In this article, we use the definition based upon derivation of Walsh function from Rademacher function that is thought to be more appropriate for signal processing purpose. 29
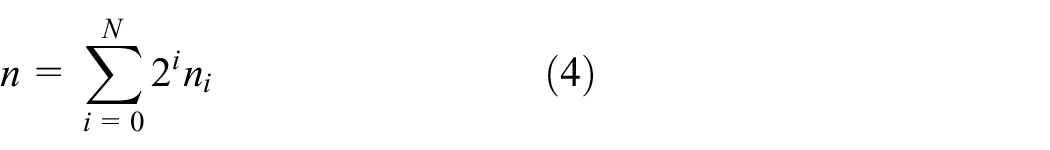
The Rademacher functions are defined as follows
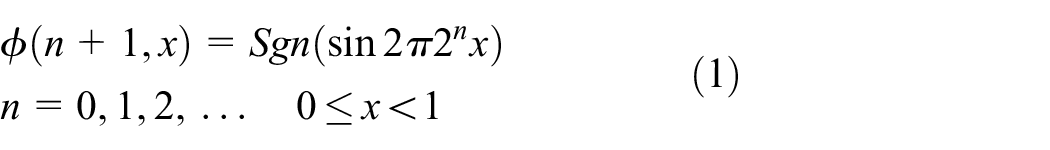
where

The Walsh function is defined in terms of product of Rademacher function as

A signal


In function (7),

Walsh coefficient can be obtained using the Walsh transform easily; the problem is to estimate the noise threshold. An adaptive noise estimate, which is defined as function (9), is proposed in this article innovatively 30

The Walsh transform method can be briefly described as follow: first, as the wavelet denoising method, a signal is decomposed into Walsh coefficients using the Walsh transform. Second, because of the energy compaction effects of Walsh transform, we filter these coefficients with thresholding. Finally, use the inverse Walsh transform for reconstruction, and the new fault signal of noise suppression is obtained.
The complete process detail of the proposed method is shown in Figure 2. The diagram of the proposed multi-sensor fault detection system is shown in Figure 3.

The Walsh transform denoising method.

The multi-sensor fault detection system.
Simulation signal processing
In order to verify the validity of Walsh transform denoising method, a simulation signal which contains random noise is constructed. The model of the signal is expressed in function (10). The simulation signal is designed to be generated by sine function with two different frequency values, as shown in function (11)


And, 6-dB white noise (R(t)) is added to the simulation signal. The sampling frequency is 40,960 Hz, and the data length is 16,384 points. The impulse signal and the noisy signal are shown in Figure 4(a) and (b). It is clear to see that the signal is immersed in heavy noise. The denoising results are shown in Figure 4(c)–(f). As shown in Figure 4(c)–(f), the noises in the reconstructed signals can be effectively suppressed through the Walsh transform denoising method. From Figure 4, it is easy to find that the noise process is well characterized at the lower thresholdings, and the structural characteristic of the test signal is well processed. 31 Showing the proposed Walsh transform denoising method has theoretical correctness in noise suppression field.

The simulation signal.
Experimental investigations
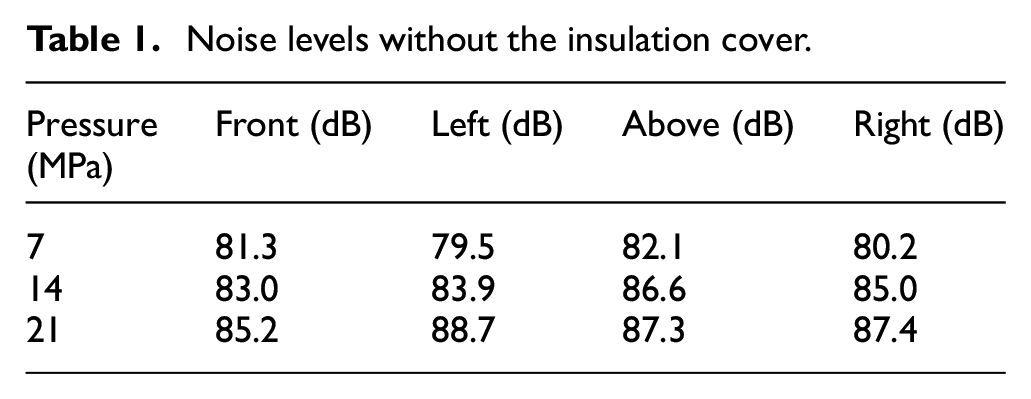
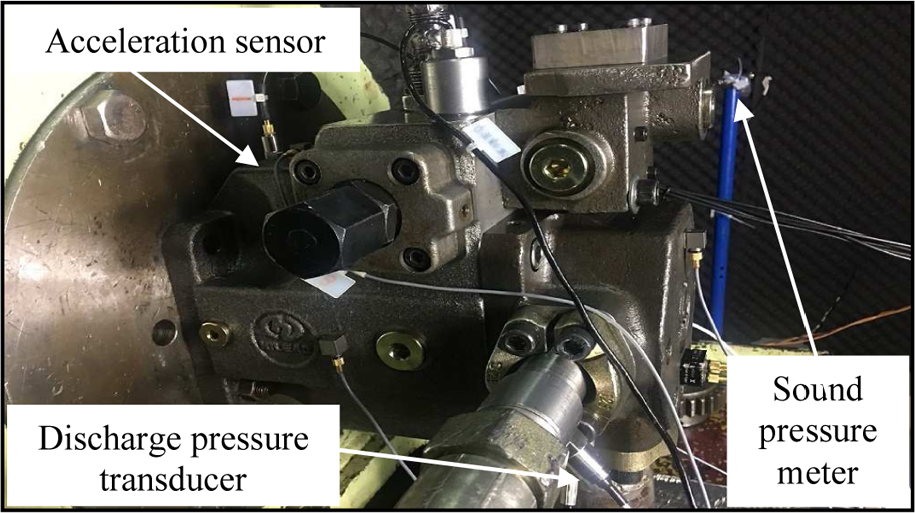
In this section, the laboratory experiments on axial piston pump with pit defect were conducted. The test system is shown in Figure 5. The experimental data include the pressure, vibration, and acoustic signals. In order to prevent the interference of ambient noise and motor noise on the acoustic signal of the piston pump, sound insulation covers for the laboratory and the motor were installed, shown in Figure 6. The noise levels without and with the sound insulation cover are shown in Tables 1 and 2. According to the two tables, it is easy to find that the insulation cover can reduce the interference of motor noise effectively.

The main components of the test system.
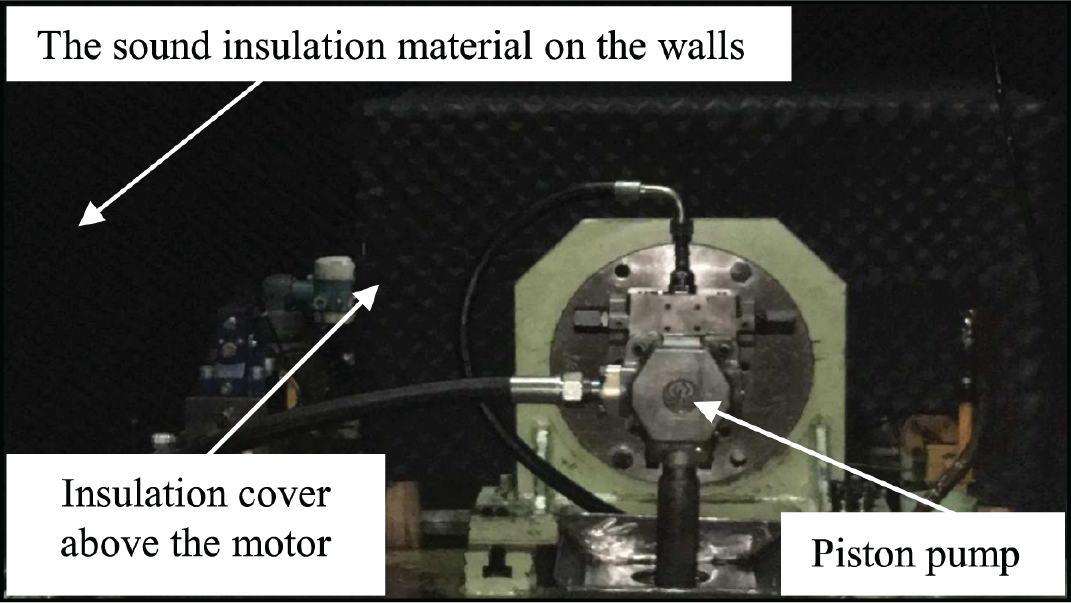
The sound insulation covers of the walls and motor.
Noise levels without the insulation cover.
Noise levels with the insulation cover.

The position of the multi-sensor is shown in Figure 7. The normal condition of the copper alloy layer is shown in the left of Figure 8. The pitting defection was pre-installed on the copper alloy layer of the cylinder block, which is shown in the right of Figure 8.
The position of the multi-sensor.
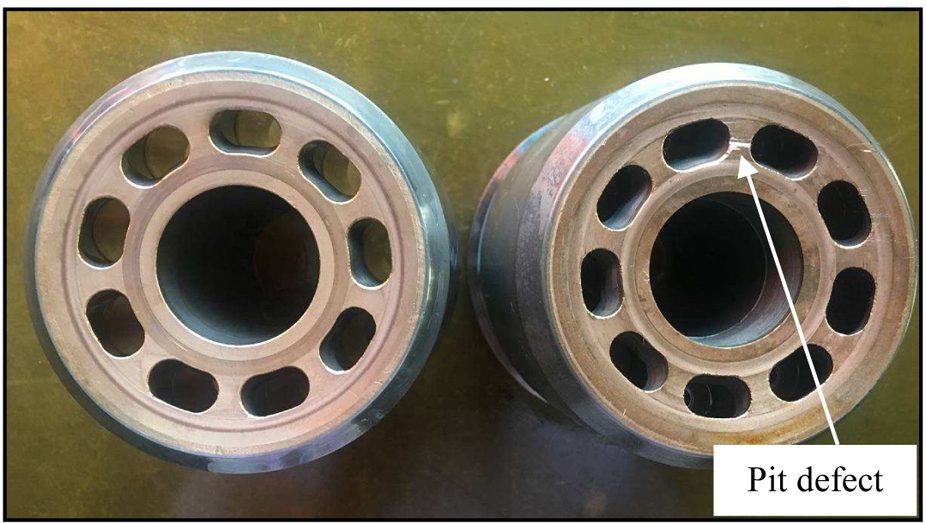
The normal and fault cylinder block.
From Figure 9, we can see the triangle groove on the discharge port, which can reduce the amplitude of discharge fluctuation efficiently. Due to the pit defect on the cylinder block, the triangle groove on the discharge port will lose its pressure smooth function and cause periodical pulses when the groove passes through the pit defect.32,33 According to the above reasons, it is easy to find that the fault discharge pressure frequency can be evaluated as same as the shaft frequency. All of the following experiments which compare the normal pumps with the pit fault pumps demonstrate this view efficiently. The pump speed is 975 r/min (shaft frequency is 16.25 Hz), discharge pressure is 15 MPa, flow rate is 30 L/min, sampling frequency is 48,000 Hz, and the data length is 32,768 points.
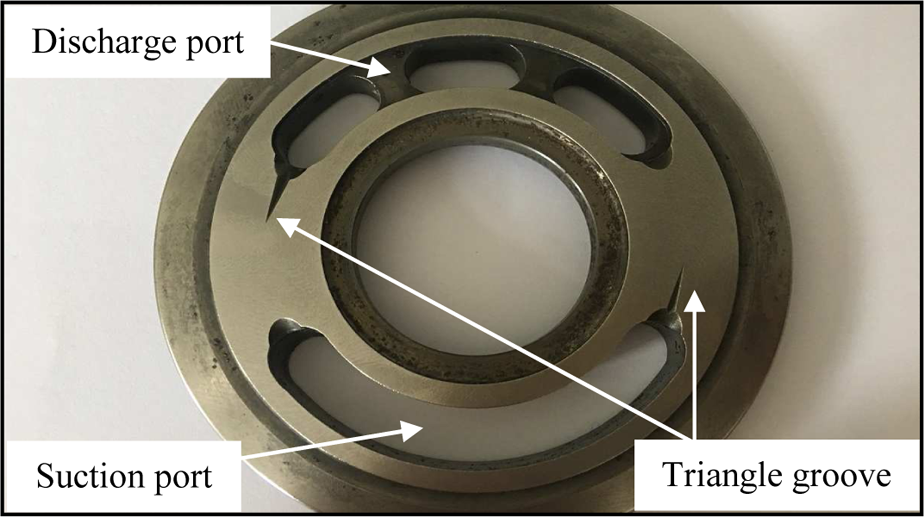
The valve plate.
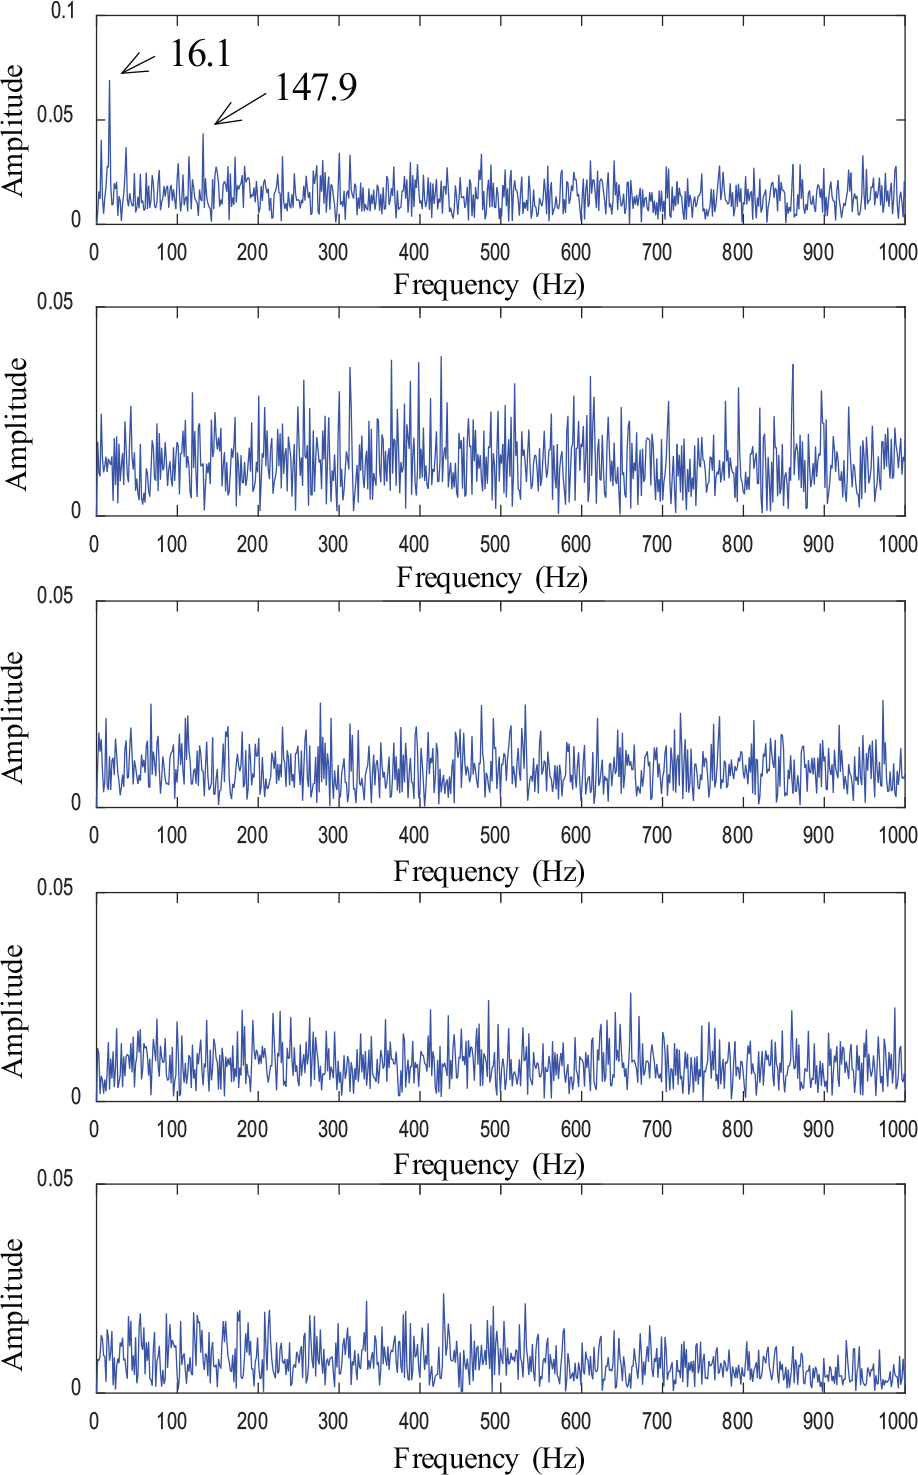
Twenty-five discharge pressure signals are collected, the fault diagnosis accuracy of the proposed denoising method reaches 92%, and the accuracy of the untreated signals is only 76%. Two pairs of the raw and denoised signals are shown in Figures 10 and 11, respectively, and the corresponding frequency spectrums are shown in Figures 12 and 13. In Figure 13, the piston frequency (147.9 Hz, which is evaluated as the nine times of the shaft frequency, because there are nine pistons in the pump), the fault discharge pressure frequency (16.1 Hz), and its second harmonic (32.2 Hz) are more obvious than Figure 12.

The raw discharge pressure signals.

The denoised discharge pressure signals.

The frequency spectrums of the raw discharge pressure signals.

The frequency spectrums of the denoised discharge pressure signals.
Because the periodic discharge pressure pulses lead to the same frequency pulses in the vibration signal, the piston frequency is also very obvious on the vibration signal’s Hilbert envelope spectrum. Due to the existence of pit defect, the two triangle grooves will hit the pit defect two times every turn.34,35 According to the above reasons, it is easy to find that the fault vibration frequency can be evaluated as the two times of the shaft frequency on the Hilbert envelope spectrum. The following vibration signals collected from the normal and pit fault pump demonstrate this view efficiently. The parameters are the same as the first experiment.
Twenty-five vibration signals are collected, the fault diagnosis accuracy of the proposed denoising method reaches 92%, and the accuracy of the untreated signals is only 84%. By comparing Figures 14 and 15, we can find that the periodic pulses of the denoised signal are more obvious. The Hilbert envelope spectrums of two pairs of the raw and denoised vibration signals are shown in Figures 16 and 17, respectively. In Figure 16, the fault vibration frequency (32.2 Hz) and its third, sixth harmonics (98.6, 197.2 Hz), the piston frequency and its harmonics (147.9, 295.9, and 443.8 Hz) are revealed, but the features are immersed in heavy noise and not as distinct as Figure 17. Moreover, the amplitude in Figure 17 is nearly as 10 times as Figure 16, showing that the proposed method can improve the SNR efficiently.

The raw vibration signals.

The denoised vibration signals.

The Hilbert envelope spectrums of the raw vibration signals.

The Hilbert envelope spectrums of the denoised vibration signals.
Due to the pit defect on the cylinder block, the two triangle grooves will lose their pressure smooth function as well as the silence function when the grooves pass through the pit defect. 36 What’s more, within the scope of the both ports, almost the entire acoustic signal comes from the discharge port, because the pressure of the suction port is almost as low as the atmospheric pressure, which causes no sound explosions. According to the above reasons, it is easy to find that the fault acoustic frequency can be evaluated as the same as the fault discharge pressure frequency (which is evaluated as the one time of the shaft frequency). The following experiments demonstrate this view efficiently.
Twenty-five acoustic signals are also collected, the fault diagnosis accuracy of the proposed denoising method reaches 88%, and the untreated signals are only 72%. From Figures 18 and 19, we can find that the periodic pulses of the denoised signal are more obvious than the raw signal. The Hilbert envelope spectrums of two pairs of the raw and denoised acoustic signals are shown in Figures 20 and 21, respectively. In Figure 20, the fault acoustic frequency (16.1 Hz) and the piston frequency (147.9 Hz) are revealed, but the features are immersed in heavy noise and not as distinct as Figure 21. Moreover, the second and third harmonics of piston frequency (295.9 and 443.8 Hz) can be found in Figure 21, which cannot be found in Figure 20.

The raw acoustic signals.

The denoised acoustic signals.

The Hilbert envelope spectrums of the raw acoustic signals.

The Hilbert envelope spectrums of the denoised acoustic signals.
In order to be more specific, the EEMD (one of the most advance denoising methods) is compared with the proposed denoising method. The fault diagnosis accuracy for discharge pressure signals is 84%, which is 8% lower than the proposed denoising method; for vibration signals is 92%, which is the same as the proposed denoising method; for acoustic signals is 84%, which is 4% lower than the proposed denoising method. Showing the performance of the proposed denoising method is pretty good.
The IMFs of the fault raw acoustic signal showing in Figure 18 and their corresponding Hilbert envelope spectrums are shown in Figures 22 and 23.

The IMFs of the raw acoustic signal.
The Hilbert envelope spectrums of the IMFs.
In Figure 22, the fault acoustic frequency (16.1 Hz) and the piston frequency (147.9 Hz) are only revealed in IMF1, but the features are immersed in heavy noise and not as distinct as the features in Figure 21. Moreover, the decomposition time required for EEMD is longer than the proposed denoising method. The average calculation time consumed by EEMD for the total 75 experimental signals is 2.59 s, and the proposed denoising method only need 0.91 s. The computer with 3.2 GHz i5-Core CPU, 4.0 GB RAM, and MATLAB (R2015a) platform are applied to the experimental signal processing.
The three experimental investigations show that the proposed Walsh transform denoising method can improve the raw signal’s SNR obviously, and the fault feature frequency in axial piston pump can be extracted effectively. Therefore, the proposed Walsh transform denoising method has a higher practicability in noise suppression field, and the Walsh transform denoising method is a viable and novel tool to detect faults in axial piston pumps.
Comprehensive results of the three sensor signals can further improve the fault diagnostic accuracy up to 96%. If two or three of the three sensors judge that the axial piston pump has failed, we think the axial piston pump has failed. The accuracies of the comprehensive multi-sensor fault detection strategy using the Walsh transform denoising method are shown in Table 3. Where “F” represents the detection result of the faulty pump is fault and “N” represents the detection result of the faulty pump is normal.
The accuracy of the comprehensive multi-sensor fault detection strategy.

Conclusion
To solve the shortcoming of the conventional fault diagnosis method for axial piston pumps, a new multi-sensor fault detection strategy for axial piston pump using the Walsh transform method is proposed in this article. The working principle of axial piston pump, the discharge pressure, vibration, and acoustic responses to the pit fault are introduced in this article. The three experimental investigations show that the same pit fault has different influences to different kinds of signals. The fault feature frequency of the discharge pressure signal is evaluated as the one time of the shaft frequency on the frequency spectrum. The fault feature frequency of the vibration signal is evaluated as the two times of the shaft frequency on the Hilbert envelope spectrum. And, the fault feature frequency of the acoustic signal is evaluated as the one time of the shaft frequency on the Hilbert envelope spectrum. Only use one or two kinds of sensor dada could not detect the fault occasionally. In order to obtain better diagnosis accuracy, it is very urgent to use the multi-sensor fault detection strategy in the working condition.
Furthermore, we combine this multi-sensor strategy with the Walsh transform denoising method, which can decompose a signal into a set of rectangular Walsh coefficients. With the process of fitting these coefficients with soft thresholding and using the inverse Walsh transform to reconstruct the signal, the new fault signal of noise suppression is obtained. This method has some effective improvements, such as it requires less storage space and is faster to calculate. The simulation and experimental investigations demonstrated the feasibility of using the Walsh transform method to detect faults in axial piston pumps. Finally, we transform the denoised time domain signals to the frequency domain by the means of fast Fourier transform and Hilbert transform and get the frequency spectrum and Hilbert envelope spectrum which are used to determine fault by comparing experimental values with theory values.
However, as can be seen in Figure 5, the fault diagnosis system needs at least three sensors, which will cost more money than conventional fault diagnosis method. The other drawback of the present strategy is that three signals need to be dealt with to determine the fault, which costs more time than one sensor method. Therefore, future work will focus on further optimization of the proposed method.
Footnotes
Handling Editor: Janos Botzheim
Declaration of conflicting interests
The author(s) declared no potential conflicts of interest with respect to the research, authorship, and/or publication of this article.
Funding
The author(s) disclosed receipt of the following financial support for the research, authorship, and/or publication of this article: This work was supported by the National Science Foundation of China (Grant Nos 51575400, 51505339, and 51405346), the Zhejiang Provincial Natural Science Foundation of China (Grant Nos LQ16E050005 and LQ17E050003).