
Abstract
Connected cars, which are vehicles connected to wireless networks through the convergence of automotive and information technologies, have become an important topic of academic and industrial research on automobiles. In this research, we conducted a field experiment to understand vehicle maintenance mechanisms of a connected car platform. Specifically, we investigated the feasibility of prognostics and health management under different driving circumstances, with varying vehicle models, vehicle conditions, drivers’ propensity for speeding, and road conditions. We collected sensor data through a two-stage model of vehicle communication using an on-board diagnostics scanner and data transmission using wireless communication. We found that device defects can be predicted based on driving situations such as the driving mode, mechanical characteristics, and a driver’s speeding propensity.
Introduction
Companies are investing on Internet of Things (IoT) technologies, and one area of particular interest is connected cars. Connected cars indicate vehicles connected to always-on networks through the convergence of automotive and information technologies. Connected car services can be categorized into traffic safety, infotainment, traffic efficiency, and cost efficiency. Traffic safety, in particular, has four subcomponents: fleet management systems, prognostics and health management (PHM), intelligent driver-assistance systems, and driver behavior detection. 1
This research examines prognostics element in the PHM system of connected cars. With the increase in the use of combined electromechanical modules, such as motor-driven power steering and electronic parking brakes, PHM has become critical in the automobile industry. In PHM, prognostics refers to the process of predicting the future reliability of a product by assessing the extent of deviation or degradation of a product from its expected normal operating conditions. Furthermore, health management is defined as the process of measuring and recording the extent of deviation or degradation from normal operating conditions. By 2020, electrical equipment is expected to constitute 50% of each automobile, and each vehicle is expected to contain more than 200 sensing elements that transmit signals to an electrical control unit (ECU). 2 The importance of sensor-based diagnostics and prognostics has been greatly emphasized on because the failure of automotive electrical equipment can have fatal consequences.
In this research, we conducted a field experiment to understand vehicle maintenance mechanisms by collecting real-time sensor data from a commercial connected car platform for PHM. Specifically, we investigated the feasibility of PHM under different driving conditions, varying vehicle models, vehicle conditions, a driver’s speeding propensity, and road conditions. We collected data through a two-stage model of vehicle communication using an on-board diagnostics (OBD) scanner and data transmission using wireless communication. In our field experiment, we determined that device defects could be predicted based on driving conditions such as driving mode, mechanical characteristics of the vehicle, and a driver’s speeding propensity.
The main contributions of this research are summarized as follows: (1) The research demonstrates that large-capacity sensing data of machinery and big data analytics can provide information that creates business value. In other words, our research highlights that the sensing data have a wide range of applications in extended fields such as connected cars. (2) In addition, this research collects real-time streamed data through the OBD scanner, wireless communications platform, and big data storage technologies. Such real-time data collection proves the possibility of real-time prognosis of connected cars. (3) This research is also meaningful as it incorporates behavioral sensor data with prognostics for connected cars. In other words, this is the first study to simultaneously perform prognostics and detect driver behavior using a sensor-based approach. Our experimental results confirmed the feasibility of business to consumer (B2C) PHM service for connected cars.
The remainder of this research is organized as follows: First, we review related works on PHM, prognostics in the automobile industry, and driver behaviors. Next, we describe our research design, including experimental settings, data collection process, hypotheses, and methodology. Then, we present our data analysis process and experimental results. Finally, we discuss theoretical and practical implications of our findings.
Background
PHM
In the manufacturing industry, mechanical damage due to partial faults or degradation of equipment may cause an entire system to shut down, resulting in enormous social and economic damages. Furthermore, damage to certain components may lead to car accidents and casualties. Therefore, most machines and systems, including automobiles, rely on routine preventive maintenance performed at regular intervals. However, routine preventive maintenance has limited capacity to prevent unexpected failure and can incur costs associated with unnecessary replacement of undamaged parts. Therefore, the importance of condition-based management (CBM) and PHM, which can be performed by analyzing data collected through a wireless sensor network (WSN), has recently been highlighted. 3
PHM provides the following services for systems or devices in operation: (1) health monitoring for faults or degradation, (2) diagnosis of abnormalities, (3) prognosis of remaining useful life (RUL), and (4) notification when maintenance is necessary.4,5 Although a considerable amount of research has been conducted on health monitoring and diagnosis, full-scale research of prognostics has been performed only recently.
In general, there are three methods for conducting prognostics: experience-based, data-driven, and model-based approaches. 6 Experience-based approaches predict the RUL by fitting a probability distribution to actual failure or accident data. This approach has a wide range of applications, without the need for complicated theories; however, it cannot be regarded as real prognostics because it does not provide real-time monitoring. Data-driven approaches estimate the reliability and soundness of a system by applying statistical methods to data. Machine learning, which is one of the most commonly used techniques, predicts future failures by training an input–damage relationship. 7 Typically, this technique includes an artificial neural network, a Gaussian process regression model, and a relevance vector machine (RVM). Model-based approaches predict and diagnose failures based on a physical breakdown model. 8 This approach allows a model to be created with a small amount of failure data; however, its predictive ability is reduced if the failure mechanism is difficult to identify or there are a large number of variables. The particle filter and Bayesian methods are typical examples of model-based approaches.
Prognostics in the automotive industry
The PHM technology has been adopted in the automotive industry to predict safety-related failures, determine the maintenance policy for core components, enhance the reliability of components using on-road condition monitoring, and reduce maintenance costs. In fact, the automotive industry initiated rigorous research on PHM in the 21st century, yielding interesting findings. In 2008, Luo and colleagues8,9 presented prognostic techniques for a vehicle suspension system. To determine the thresholds for the presence of faults, they employed statistical techniques, such as the Kalman filter and interacting multiple models (IMMs). In addition, Goebel et al. 10 predicted the RUL of lithium-ion batteries using a particle filter framework. In the artificial charge/discharge cycles of a lithium-ion battery, they used a linear relationship between the capacitance and impedance measured through electrochemical impedance spectroscopy to determine the degradation characteristics. Using an RVM, they developed a regression model for capacitance variations depending on the number of cycles to estimate related variables; furthermore, they employed a particle filter algorithm while monitoring the real-time battery impedance to calculate the RUL. In 2008, Zhang et al. 11 reported that the concept of intravehicular network–based connected vehicle diagnostics and prognostics (CVDP) would be reflected in actual mass production. Lall et al. 12 employed Kalman filter models to predict the RUL under shock and vibration loads mainly occurring within automobiles and published research findings that applied the concept of prognostics to various electronic components. Based on the physics of failure, a technique for developing models and data-driven methodology, the Korea Electronics Technology Institute 13 devised a prognostics model for a ball grid array (BGA) assembly in a vibration environment. Hu et al. 14 presented a method in which the state of charge (SOC) and the state of health of a lithium-ion battery can be estimated using measurable variables such as battery current and voltage. To this end, they employed a multiscale framework based on the extended Kalman filter. Meanwhile, the Center for Advanced Life Cycle Engineering 15 presented four types of health management approaches for automotive electrical equipment: built-in-tests, fuse and canary devices, monitoring precursors to failure, and monitoring environmental and usage loads.
Brand name car manufacturers, as well as research institutes, are competitively applying for automotive PHM-related patents. Ford owns a patent that presents a vehicle structure with a built-in prognostics module such as OBD. 16 To determine the characteristics of degradation, the vehicle-mounted prognostics module compares on-road internal data received from the battery, inverter, and electronic motor with results obtained from preliminary modeling of the conditions of key components. In a patent from 2012, General Motors (GM) described the specific analytical procedures for PHM technology. 17 Specifically, GM detailed the relationship between key vehicle components and failure modes, as well as the related failure precursor parameters. Honeywell owns a patent that particularizes a prognostics feature mounted into a vehicle system. 18
Driver state and intention detection
The detection of driver behavior is another important topic relevant to traffic safety. Swan 19 argued that detecting driver fatigue, which is one of the main causes of car accidents, would be an essential feature for preventing fatal accidents in connected cars. Saini and Saini, 20 along with Ghule and Katariya, 21 reviewed the systems and techniques for detecting driver drowsiness. Research on driver behavior detection has been conducted by many scholars using sensors and computer vision methods. Lee and Chung 22 proposed an alert system that recognizes facial features and bio-signals to determine whether a driver is exhausted or distracted, while Ghimire et al. 23 measured the time intervals between blinks to determine whether a driver is drowsy. In addition, some studies measured the steering wheel speed 24 and analyzed driver’s voice to measure inattentiveness caused by driver stress. 25
However, none of the previous studies incorporated behavioral understanding of drivers with prognostics for connected cars. Our research is particularly meaningful as we incorporated previous findings on driver behavior with prognostics for automobiles utilizing a sensor-based data and empirically tested such relationships in the field. Table 1 summarizes prior studies on prognostics in the automotive industry and driver behavior detection.
Automotive studies on prognostics and driver behavior detection.
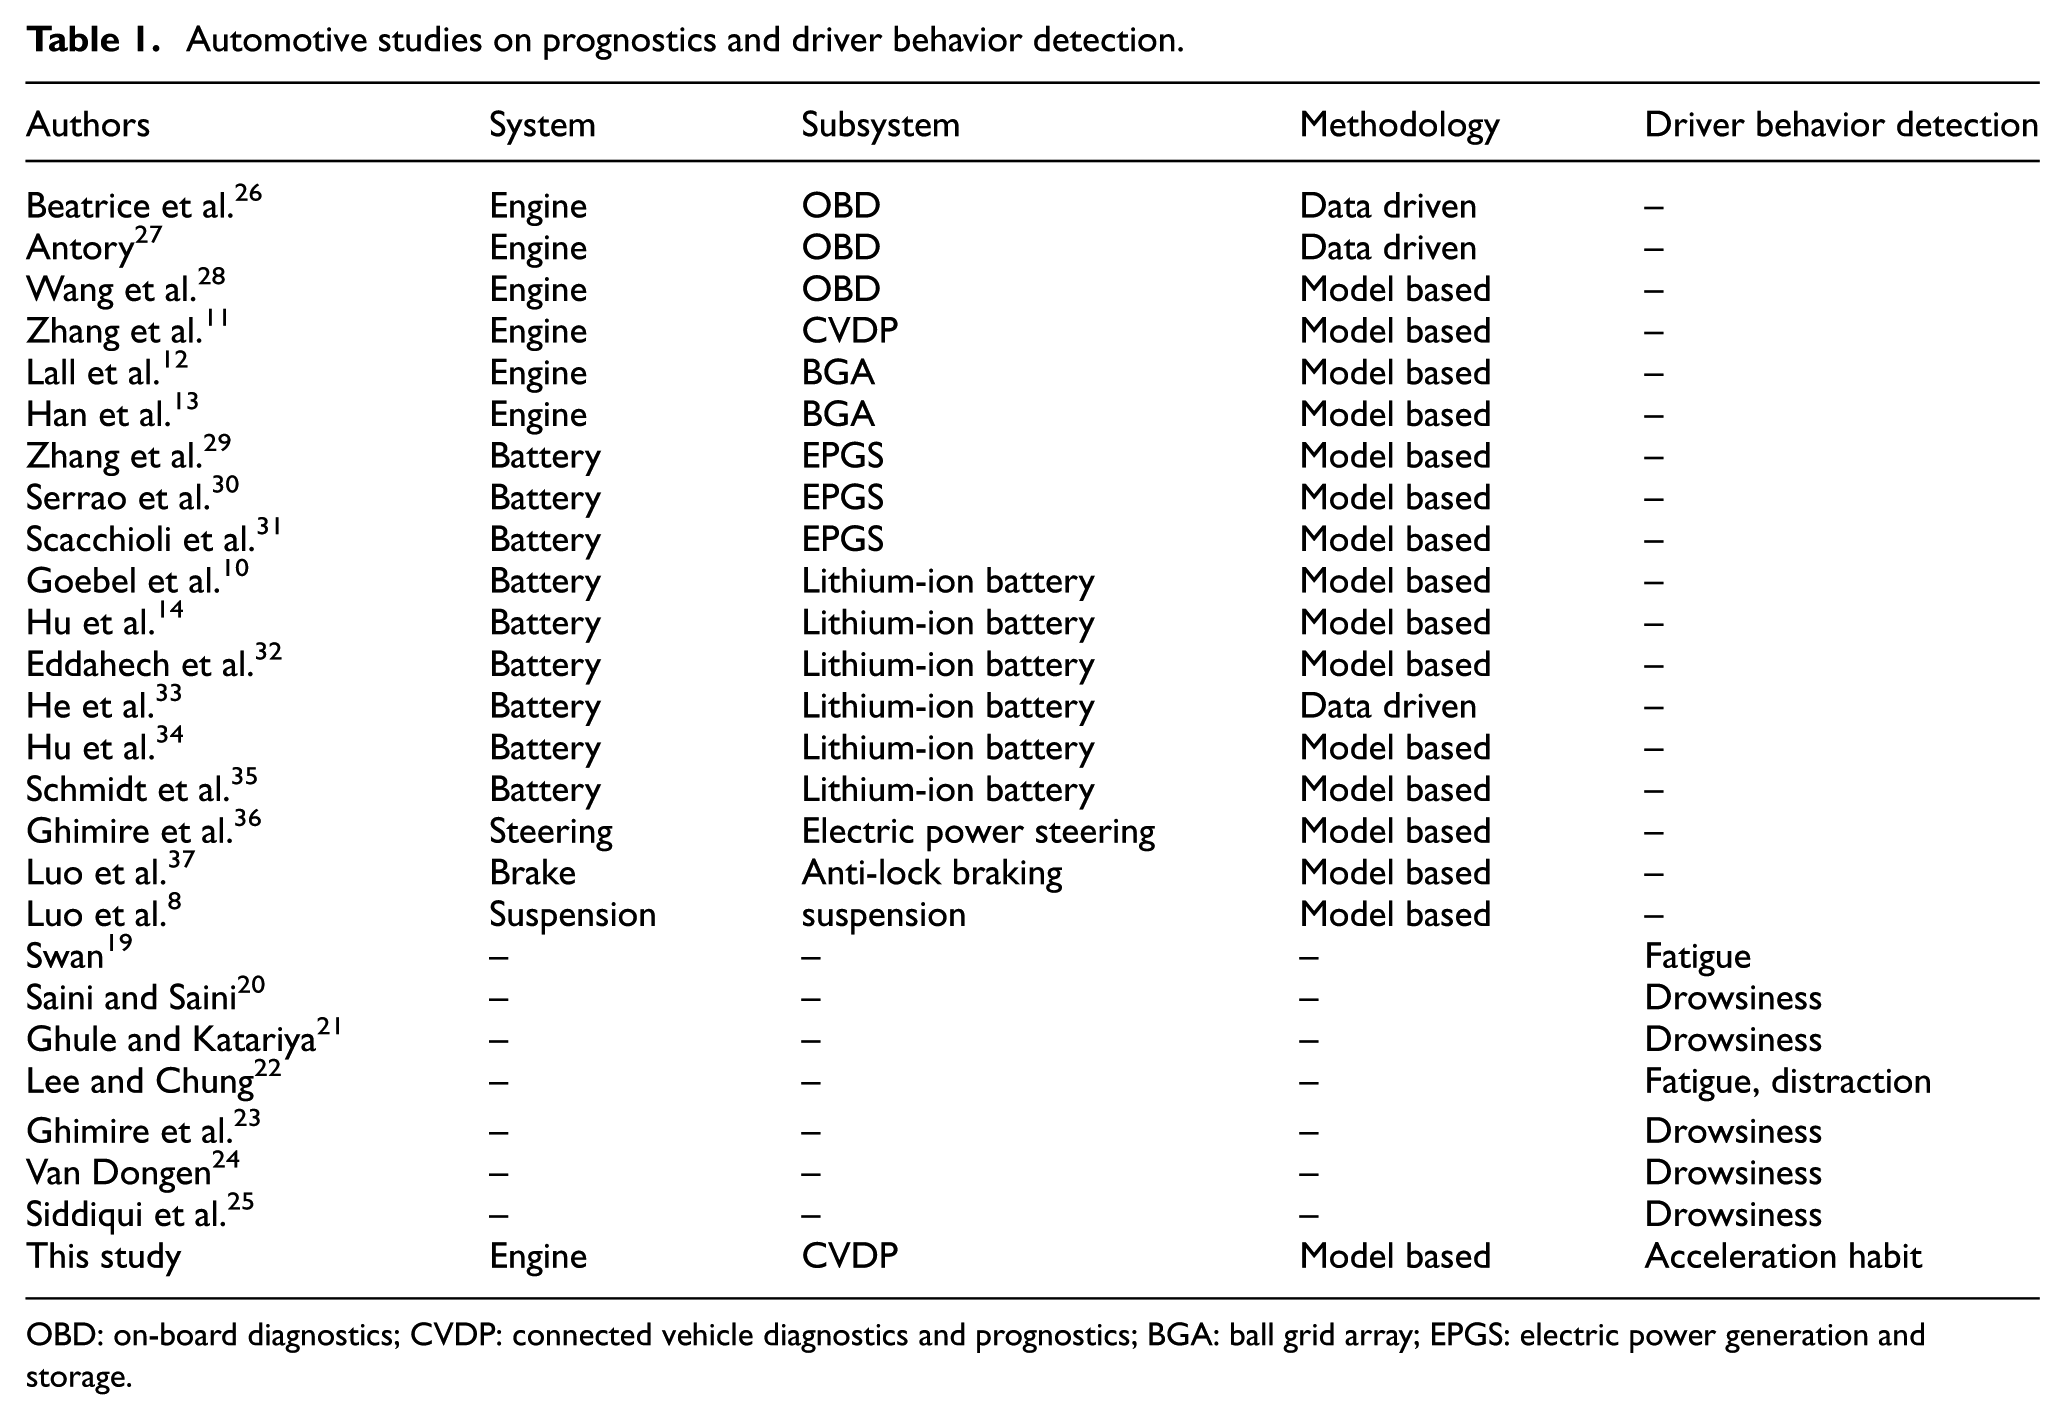
OBD: on-board diagnostics; CVDP: connected vehicle diagnostics and prognostics; BGA: ball grid array; EPGS: electric power generation and storage.
Design
Data collection and experimental settings
The objective of our field experiment was to investigate the feasibility of PHM under different driving circumstances, with variable vehicle models, vehicle conditions, driver propensity for speeding, and road conditions. We designed our field experiment based on professional advice (master craftsman for the field of motor vehicle maintenance) and the existing literature on automobile maintenance. In particular, we made artificial modifications to the vehicle’s major equipment to compare the PHM results in the normal and malfunctioning conditions. Professionals in the automobile industry were deeply involved in the experimental design process and confirmed that none of the car modifications would create any safety-related issues.
We created an intentional flaw by modifying or eliminating particular components from the devices connected to the engine system that the vehicle’s internal sensors can detect. For this purpose, an artificial situation of irregular strokes in the cylinder was created to collect sample data. Furthermore, after consulting expert opinions and prior studies,38–40 parameters such as engine malfunction, fuel penalty, and unstable revolutions per minute (RPM) were selected for this study as phenomena that may be caused by the artificial experimental conditions. These phenomena are representative and common vehicle problems that a driver can recognize under normal circumstances. Finally, vehicle sensor data were gathered from two types of vehicles for quantitative verification. All participants were fully informed about the process and artificial modifications in the car and agreed to participate.
In total, 40 gasoline-powered vehicles (Hyundai Avante 1.6 GDi) were operated over the same road section for 5 h. In total, 20 of these vehicles were forced into an abnormal state by intentionally removing the ignition plug from Cylinder 2, forming the experimental group, whereas the remaining 20 vehicles were unmodified, forming the control group. To control the bias caused by driver speeding propensity, testing was conducted on a second day, in which the drivers from the experimental and control groups were swapped so that each driver would operate vehicles from both the control and experimental groups. The total travel distance in the tested Metro Seoul area circuit (Company A location → motor service center → Central Park in Songdo → Incheon International Airport → Heiri Town in Paju → Company A) was approximately 208.4 km, and the travel time was approximately 280 min. Similarly, 30 LPG-fueled cars (Hyundai YF Sonata 2.0 LPi) were divided into two groups of 15 vehicles each and operated in the same road section for 2 days; similarly, on the second day, drivers from the experimental and control groups were swapped to compensate for driver speeding propensity. All 70 GDi and LPi vehicles selected for the experiment were within the mileage range of 40,000–85,000, with no history of major maintenance to the engine or transmission. The Carman AUTOi-300 was used as a scanner device for data collection. The main sensor data were selected based on professional advice. As shown in Table 2, the data were collected from 27 and 28 sensors for the GDi and LPi vehicles, respectively.
Data collection variables.

Hypotheses development
As described earlier, the ignition plugs were removed from Cylinder 2 in the experimental group vehicles, intentionally creating irregular strokes. Previous studies have reported that ignition plug failure disrupts the power stroke of the engine, which in turn increases the overall likelihood of incomplete combustion.41,42 Therefore, the following hypothesis was established:
Hypothesis 1. Irregular stroke in a cylinder has a positive impact on incomplete combustion.
The stroke irregularity in a cylinder can cause the idle RPM to surge, leading to RPM instability. For example, unlike the steady operation in the 600–700 RPM range when a vehicle is stopped, RPM instability appears as a change in pulse variance or an increase in pulse frequency.43,44 The following hypothesis was established accordingly:
Hypothesis 2. Irregular stroke in a cylinder has a positive impact on RPM instability when idling.
Previous studies43,45 have suggested that incomplete combustion is related to the degree of oxygen enrichment in the combustion gas, detected by an oxygen sensor located in front of the three-way catalytic converter. Accordingly, it can be assumed that lean combustion reduces the fuel injection time such that the fuel injection quantity is reduced. In LPi vehicles, the ECU employs self-learning to minimize fuel consumption by controlling the solenoid internal magnetic field, thus reducing the fuel injection time (not an interval). In contrast to LPi vehicles, the fuel injection time of GDi vehicles is fixed at 0.8 ms, and the fuel injection quantity is determined according to pressure changes in the fuel pump. As a result, the following hypothesis was formulated from this study:
Hypothesis 3. Incomplete (lean) combustion has a negative impact on the injection time for LPi (reduces injection time for LPi) and on fuel pressure for GDi (reduces fuel pressure for GDi).
Previous studies suggested that the most striking effect of RPM instability is the excessive null-point opening angle of the throttle-opening value for idle RPM.46,47 Serving as a screen for air volume control in the throttle body connected to the intake manifold, the null-point opening angle of the throttle valve has a tendency to gradually open when affected by self-learning based on the driver’s habits or by carbon buildup in the throttle body due to vehicle deterioration. However, the history of the default null-point opening angle of the throttle valve was unknown for each test vehicle. Therefore, as an alternative value, the min–max distribution of the opening angle in the idle state was used to establish a causal relationship between the distribution of the null-point opening angle of the throttle valve and the RPM instability represented by the idle RPM variance. Based on this cause and effect relationship, the following hypothesis was formulated:
Hypothesis 4. RPM instability has a positive impact on the distribution of the null-point opening angle of the throttle valve when idling.
Finally, this study determined that the sensor data obtained from the two vehicle types should be classified into idling and driving modes in Hypothesis 3 because the causal relationship between the sensor data collected from each vehicle was limited to the idling state in Hypothesis 4. In fact, it is rather difficult to directly observe the vehicle sensor data collected in the driving state. Even a master craftsman with 30 years of experience in driving tests would usually perform maintenance in the idle state by using an oscilloscope to examine the voltage or current waveforms. Therefore, the following hypothesis was added to investigate the moderating effect of operation mode (driving or idling), that is, we expected that the sensor data in the driving state would have new characteristics because the data are based on real road driving rather than the in-circuit test driving performed by automobile manufacturers when aiming at functionality enhancement (Figure 1):
Hypothesis 5. Incomplete combustion has a different level of influence on fuel pressure for GDi (or injection time for LPi) according to operation mode (i.e. driving or idling).
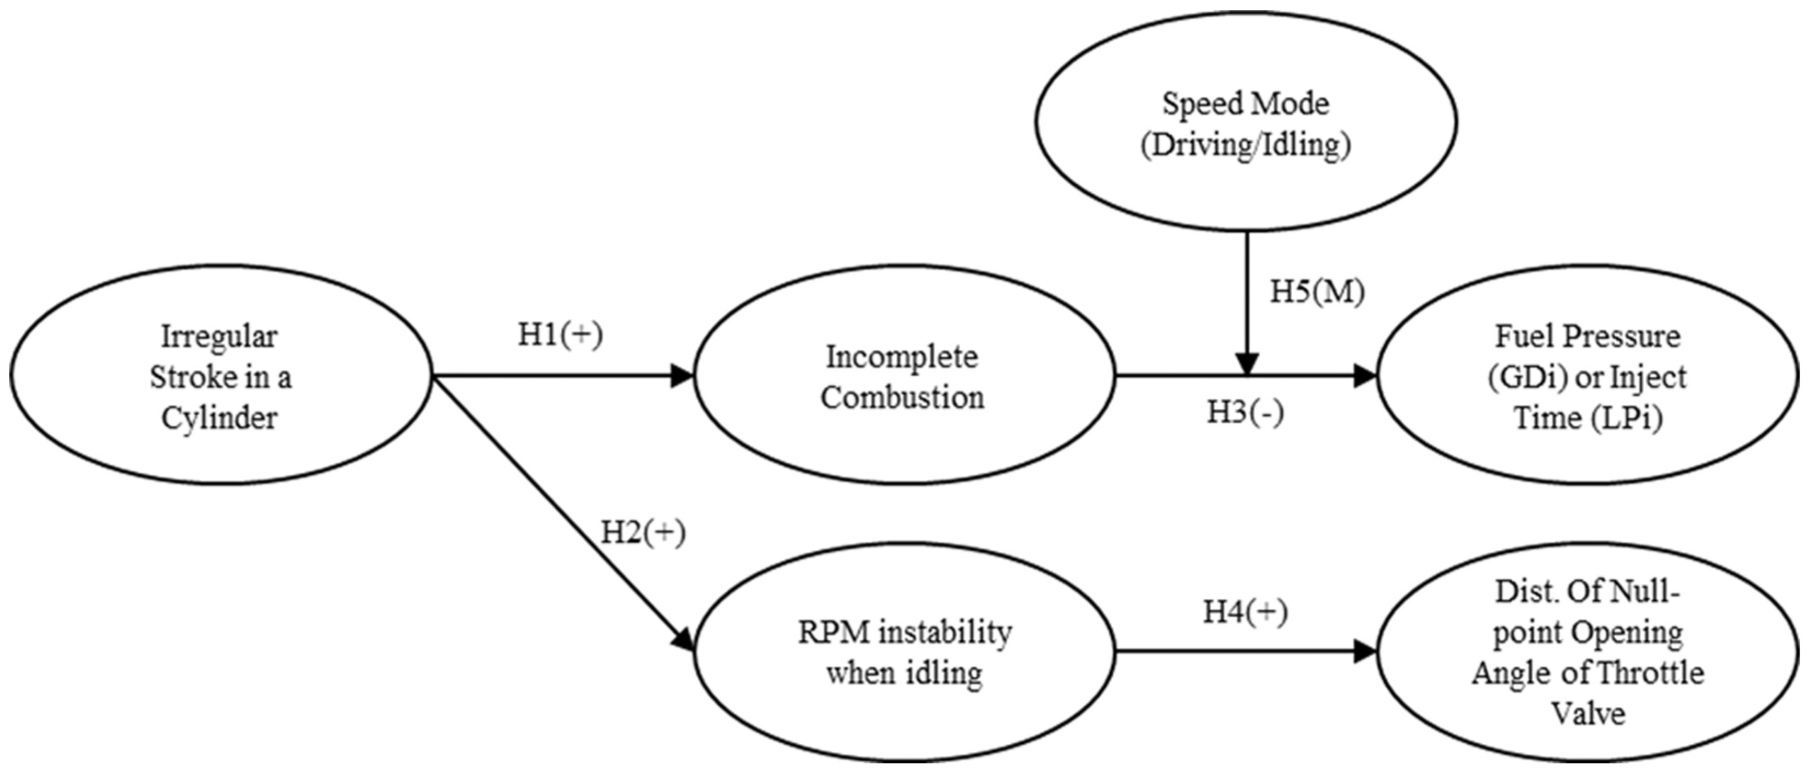
Conceptual model.
Methodology
In this study, statistical software packages (SAS v.9.4, SAS e-Miner v.13.1, and SmartPLS v.3.0) were applied to analyze sensor data for statistical verification of the causal relationships determined in each hypothesis. During data preprocessing, the groups (i.e. experimental and control) were treated as a dummy variable. Manual data that did not go through a sensor, such as vehicle model, year, and driver ID indicator, were included in the dataset using a Java auto-loop input process. In addition, vehicle speed sensor data were used to create a new dummy variable for the operation mode divided into idling (0 km/h) and driving (>0 km/h) modes. For combinations of data types, logistic regression is usually employed to determine the significance of the explanatory variable, assuming that the explanatory and response variables fall into the continuous and categorical types, respectively. In this study, this rule also applied when the estimated coefficient for each variable was used in determining a significant causative variable (first-round analysis), followed by a path analysis to test each hypothesis (second-round analysis).
Table 3 summarizes the variables, sensor data (and their corresponding abbreviations), and operational definitions of variables. As mentioned earlier, in the first-round analysis, in which all but the response variables are explanatory, logistic regression was performed to identify key causative variables that have a significant effect on abnormal conditions. Most sensor data are continuous values, showing skewness and wide variation, which do not conform to a normal distribution. Therefore, the natural logarithm of the corresponding variable was taken. In the second-round analysis, the causal relation between variables was examined based on the five hypotheses using a path analysis, wherein the variables yielding significant results in the first-round analysis were selected for each control variable.
Operational definition of variables.
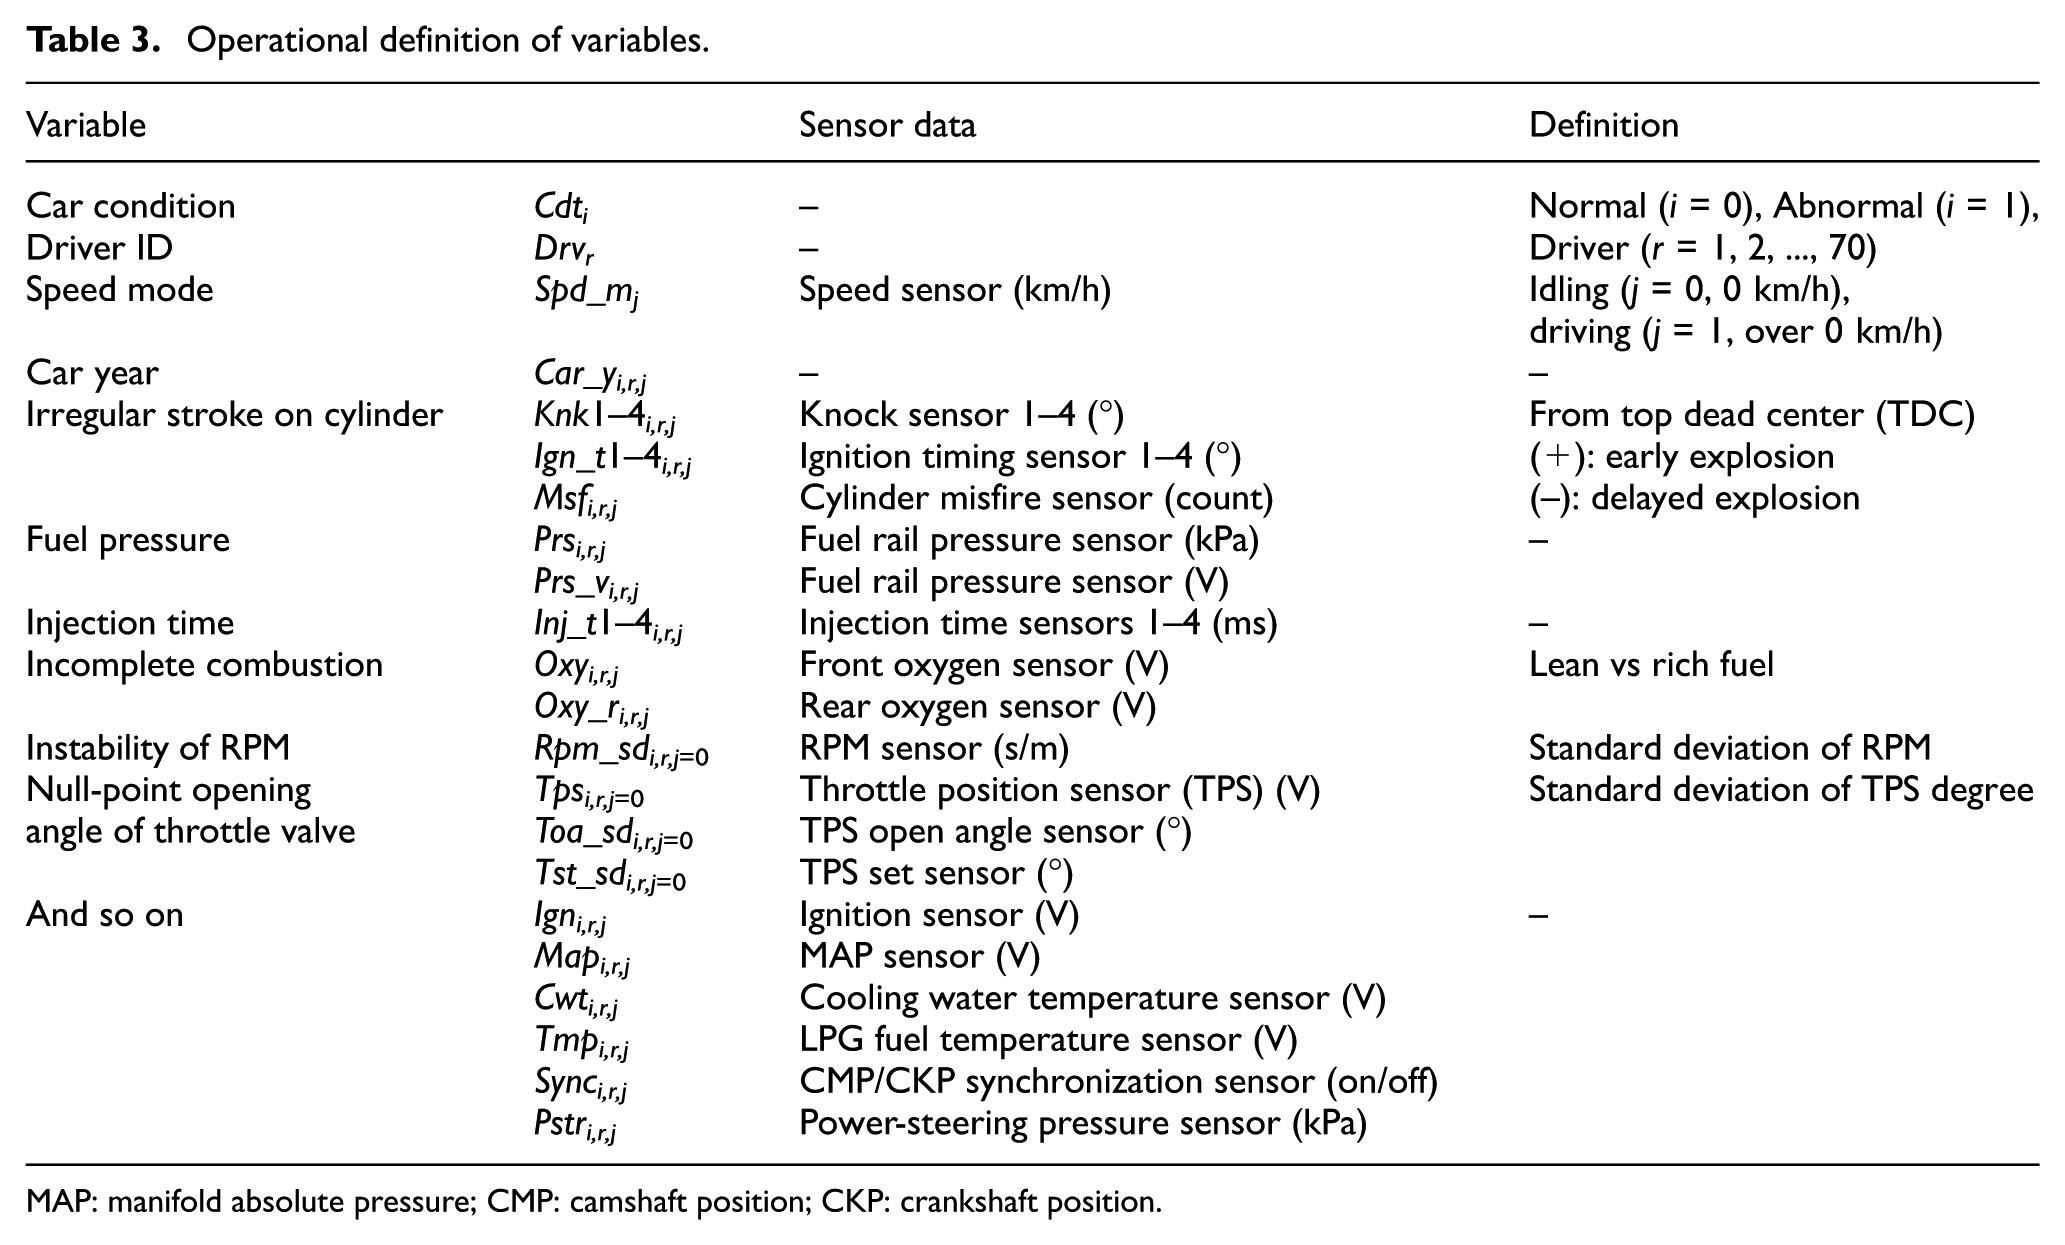
MAP: manifold absolute pressure; CMP: camshaft position; CKP: crankshaft position.
Data were gathered at a rate of 8–12 samples per second, depending on vehicle model, feature, and model year. During the 2-day driving tests for the 40 GDi vehicles, 2,570,070 and 2,480,334 dataset samples were obtained for the control and experimental group vehicles, respectively. Similarly, for the 30 LPi vehicles, 1,850,619 and 1,690,940 dataset samples were collected for the control and experimental group vehicles, respectively. Table 4 shows the descriptive statistics of the main variables for each vehicle.
Descriptive statistics (constant main variables).

SD: standard deviation; MAP: manifold absolute pressure; TPS: throttle position sensor.
Experimental evaluation
Result of first-round analysis
The economic model for logistic regression (first-round analysis) can be expressed as follows
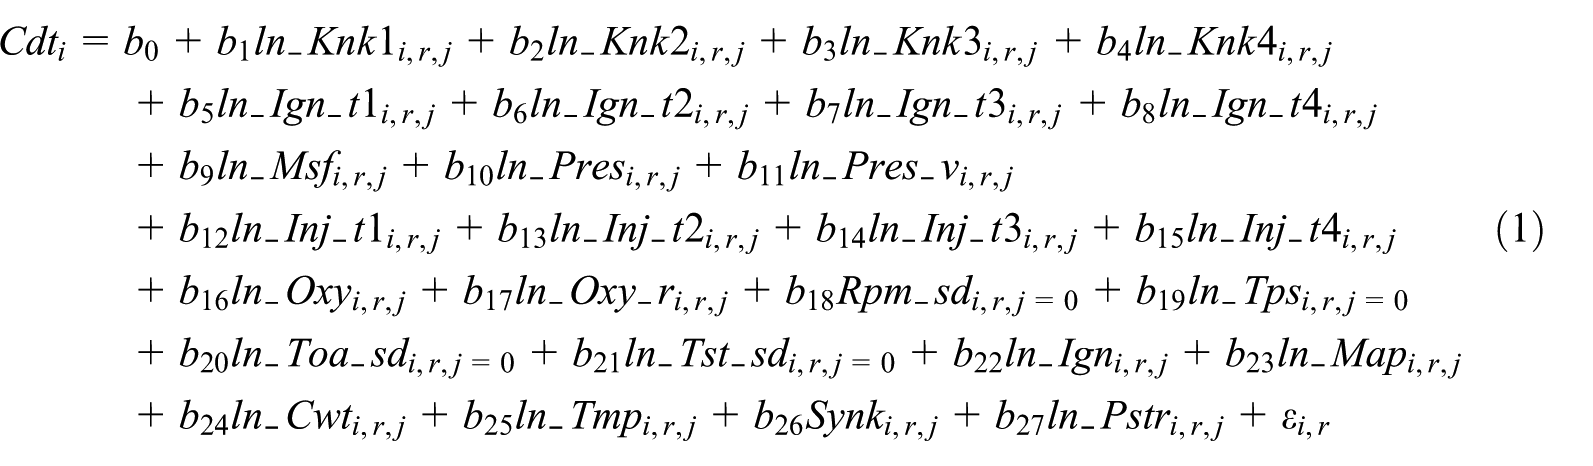
Equation (1) is an econometric model of a GDi vehicle; the natural logarithm has been applied to all continuous variables, and the results follow a normal distribution. The indices i, r, and j denote the vehicle condition (i.e. normal or abnormal), driver ID, and operation mode (i.e. idling or driving), respectively. For the LPi vehicles, RPM variation was adopted as a variable using the standard deviation of the throttle open angle.
Table 5 summarizes the results of the first-round analysis, wherein statistical tests were performed on each significant variable for the categorical response variable, that is, the vehicle condition. The operation mode (Spd_mj) was rejected as a significant variable because speed reflects driver confidence rather than device condition; as a result, it could not be used to identify the vehicle condition. In addition, all of the knock sensors located in each cylinder (variable Knk#i,r,j, where # is the cylinder number), except for the one in Cylinder 2, were rejected owing to intentional removal of the ignition plug in Cylinder 2. In the LPi vehicles, Knock Sensor 2 has a negative influence coefficient, indicating that cylinder stroke will lead to delayed explosion after top dead center (TDC). This difference could be regarded as the cause of the irregular stroke, exhibiting a statistically significant difference. Moreover, there was no statistically significant variation in the rear oxygen sensor (variable Oxy_ri,r,j); in contrast, the front oxygen sensor (variable Oxy_ri,r,j) was statistically significant owing to carbon filtering posttreatment through the three-way catalytic converter. The ignition timing sensor (variable Igni,r,j) had a constant coefficient tuned to the cylinder stroke, regardless of vehicle modifications. Finally, the injection time (variable Inj_t1 i,r,j ) of GDi vehicles showed a constant value of approximately 9.8 ms throughout all cylinders, indicating no statistically significant difference. On the contrary, the LPi vehicles showed statistically significant results across all cylinders.
Results of logistic regression (constant main variable).

p < .05, **p < .01.
Results of second-round analysis
Based on the data analysis, the statistically insignificant variables were eliminated, and path analysis (second-round analysis) was performed to test each hypothesis. As a result, Hypotheses 1, 2, and 4 were directly supported, while Hypothesis 3 was conversely supported, as shown in Table 6. Therefore, the irregular stroke in a cylinder had positive impacts on incomplete combustion (H1 supported) and RPM instability when idling (H2 supported). Moreover, RPM instability had a positive impact on the distribution of the null-point opening angle of the throttle valve when idling (H4 supported). However, Hypothesis 3 was conversely supported, implying that incomplete combustion had a positive impact on fuel pressure for GDi (or injection time for LPi). Therefore, the conventional hypothesis produced results that were opposite to the assumption that fuel pressure for GDi (or injection time for LPi) will be reduced by the ECU to control fuel injection quantity if the value of the front oxygen sensor is richer than average. In this study, data collection was performed on vehicles during real operation, whereas existing car maintenance procedures have only focused on mechanical properties in the idle state. These results warrant further behavior analysis of driver features when handling vehicles.
Results of path analysis.
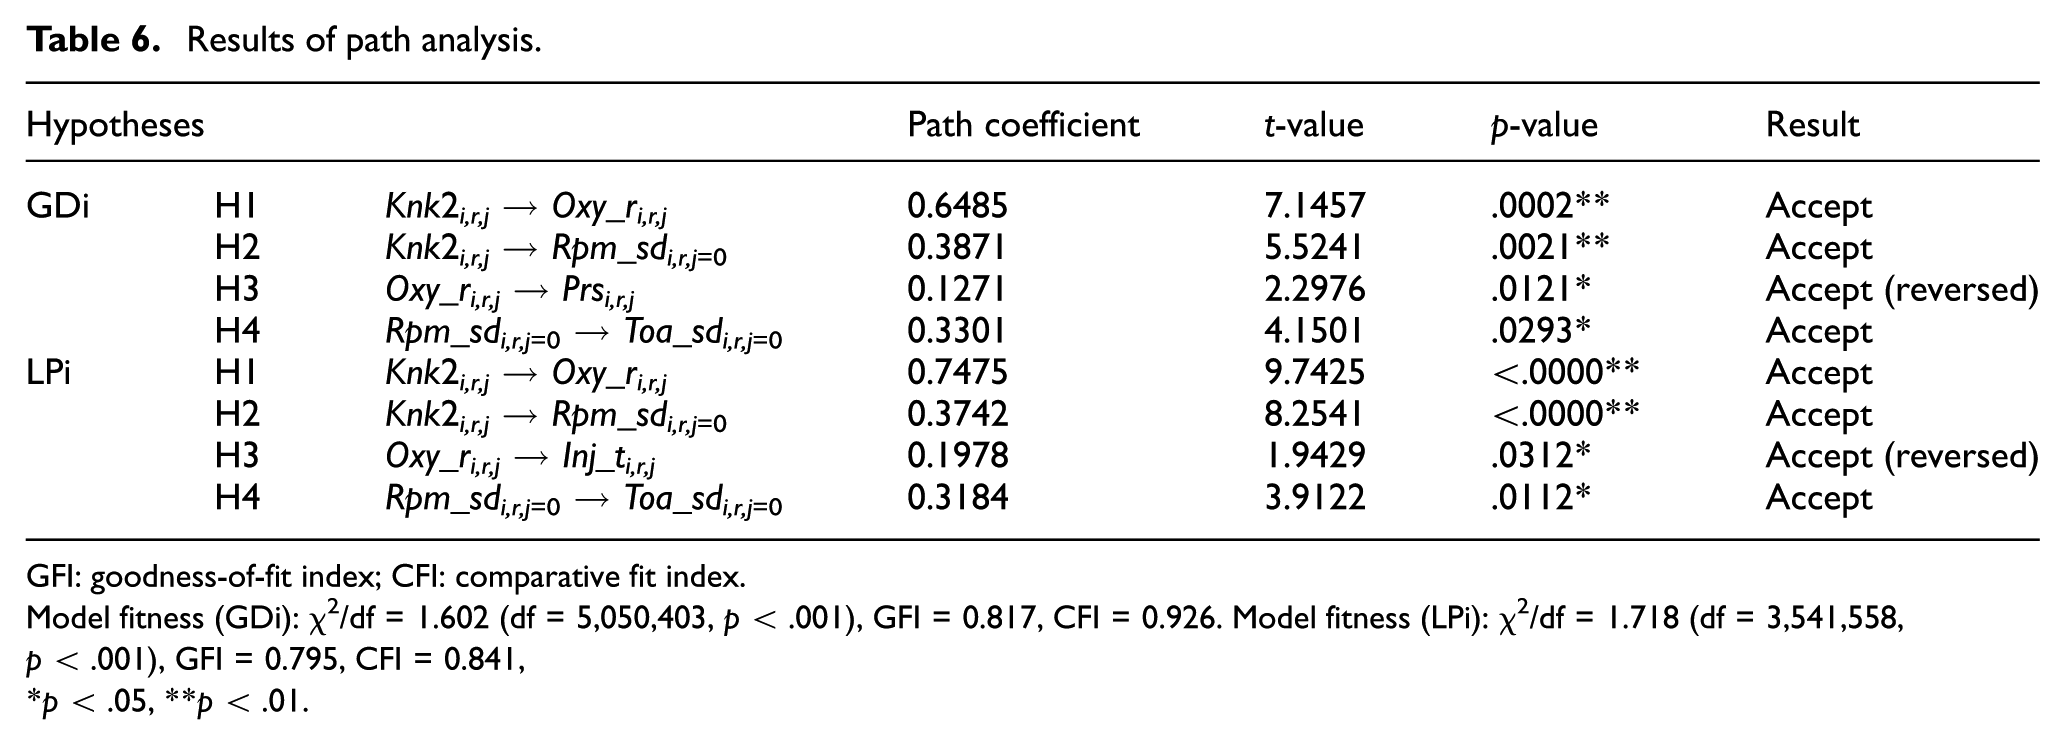
GFI: goodness-of-fit index; CFI: comparative fit index.
Model fitness (GDi): χ2/df = 1.602 (df = 5,050,403, p < .001), GFI = 0.817, CFI = 0.926. Model fitness (LPi): χ2/df = 1.718 (df = 3,541,558, p < .001), GFI = 0.795, CFI = 0.841,
p < .05, **p < .01.
Analysis of moderating effect
Among the existing hypotheses established based on the review of previous literature and the experience of a master craftsman, Hypothesis 3 was conversely supported for both GDi and LPi vehicles, implying that further studies are needed. Additionally, Hypothesis 5, which could not be reviewed in path analysis, suggests a moderating effect between fuel pressure for GDi (or injection time for LPi) and incomplete combustion while idling or driving. Therefore, by broadening the scope of the study beyond the idling state, which is the focus during automobile maintenance, variations could be observed during acceleration. As shown in Table 7, the unstandardized coefficients were compared between the idling and driving states and then divided into the constrained and unconstrained models of the chi-squared test to determine whether the moderating effect is statistically significant. The results showed a significant difference in both the GDi and LPi vehicles. Regarding the relationship between the oxygen sensor and fuel injection quantity, the coefficients in the idling state (0 km/h; approximately 20% of speed data for all vehicles in operation) were negative; this is consistent with previous findings and the comments of an experienced master craftsman. Converse results were obtained when the vehicles were being driven. As a result, the moderating effect test identified a statistically significant difference between the two states. This study found that gasoline and LPG vehicles showed the same result in the test, indicating that the differences between the unconstrained and constrained models, that is, Δχ2 values of 41.03 and 10.60, respectively, are statistically significant. Figure 2 illustrates the relationships defined in Table 7.
Results of the moderating effect test.

p < .05, **p < .01.

Trend from the difference of driving mode.
The negatively significant effect was observed in Hypothesis 3 when the driving and idling modes corresponded to the idling behavior. However, when considering only the driving mode, incomplete combustion increases the fuel pressure (or fuel injection time), showing a positive effect. The following explanations can be inferred from these results. First, considering only device control (vehicle maintenance), the device to self-learning adapts to incomplete combustion by reducing fuel injection quantity, avoiding unnecessary fuel wastage, and improving fuel efficiency. Second, if a driver feels that the vehicle engine does not output the expected power, the driver presses the gas pedal to maintain speed, further increasing power output, which in turn increases fuel injection quantity.
Driving behavior analysis
Based on the empirical study of data-driven vehicle prognostics, we aimed to provide device prognostics and customized analysis for each driver. To test this, participants were divided into two groups according to their speeding propensity, which was calculated by analyzing driving patterns of each driver participating in the experiment. Subsequently, we analyzed data to determine whether the difference in fuel injection quantity created a significant difference between the two groups.
To calculate speeding propensity, we used two criteria. First, an internationally accepted overspeed formulation was borrowed from the US National Transportation Policy to calculate the precise criteria for objective determination of driver speeding propensity among the 70 drivers participating in this test (gasoline 40, LPG 30). The results are shown in Figure 3, and each road section had a different speed limit in 1-min intervals denoted as t. This test calculated the overspeed frequency for an average speed limit of 70 km/h.

Overspeed formulation.
Second, overspeed frequency was computed from the overspeed formulation of all 70 drivers, and the vehicles were divided into two groups based on the overspeed frequency of each vehicle. Type 1 drivers driving the gasoline vehicles (rggas = 0, 20 participants) were over the speed limit for an average of 36.2 min of the total driving time, whereas Type 2 drivers (rggas = 1, 20 participants) exhibited an average of 21.7 min. Similarly, the LPG vehicle group was divided into two groups of 15 participants each. For these vehicles, Type 1 drivers (rglpg = 0, 15 participants) exhibited an average frequency of 31.7 min, whereas Type 2 drivers (rglpg = 1, 15 participants) exhibited overspeeding of 18.4 min of total driving time. Accordingly, the overspeed formulation was used (Figure 3) to separate gasoline vehicles into two groups (rggas_speed = 0, rggas_nonspeed = 1) and LPG vehicles into another two groups (rgLPG_speed = 0, rgLPG_nonspeed = 1) according to the participant’s speeding propensity and to test the moderating effect of a driver’s speeding propensity on fuel injection quantity.
As a result, the left-hand graph in Figure 4 shows a positive moderating effect between fuel pressure for GDi (or injection time for LPi) and incomplete combustion when driving. However, the graph exhibits a negative moderating effect for Type 2 drivers (rggas_nonspeed = 1). In this relatively nonspeeding group, the drivers reduced speed according to the vehicle condition rather than maintaining the speed to match their normal driving pattern. In contrast, Type 1 drivers (rggas_speed = 0) tended to press the gas pedal harder than normal to match their normal driving speed when recognizing vehicle abnormalities, such as slowdown.

Moderating effect of driver propensity for speeding.
The difference between the two groups can be confirmed by two pieces of information obtained from the empirical test. The first step is to compare the voltage of the throttle position sensor (TPS), which shows how hard a driver steps on the gas pedal while driving. The second step is to compare the fuel pressure in the modified vehicles; this pressure varies with speed in the driving mode. The average TPS value for the group with high overspeed frequency was 1.8 V (minimum–maximum of 0.7–2.5 V), which was higher than the average TPS value (average 1.6 V, minimum–maximum of 0.7–2.2 V) observed when drivers from the same group operated normal-condition vehicles. Compared to the group with lower overspeed frequency, in which the TPS value when driving modified vehicles averaged 1.3 V (minimum–maximum of 0.6–2.3 V), a difference was clearly observed in the degree to which the gas pedal was pushed, depending on the driver group.
The second piece of information compared the changes in the fuel pressure of abnormal vehicles according to speed variation using actual speed data and not operation mode to examine how the marginal rates (slope angles) of fuel pressure between the two groups differed as the modified vehicles accelerated. This parameter, in turn, shows the differences in driving behavior. In Figure 4, the right-hand graph illustrates that the slope of fuel pressure for GDi (or injection time for LPi) in the group with lower overspeed frequency in the driving mode is smaller than that of the group with higher overspeed frequency. As described earlier, information from the two test datasets can provide prognostic values for detecting mechanical features.
Conclusion
This research tested the feasibility of a connected car platform for PHM. The supports of vehicle and driver participants, empirical tests, and pilot analysis were required for this feasibility assessment. Our field experiment included several stages: (1) understanding of general vehicle maintenance, (2) vehicle data collection (two-stage model of vehicle communication using an OBD scanner and data transmission using wireless communication), (3) construction of data storage and real-time processing systems using Hadoop, (4) development of analysis enablement platform, and (5) customized analytics model development. Using a real-time data analysis, we found that device defects could be predicted based on vehicle conditions, such as the driving mode, mechanical characteristics, and the driver’s speeding propensity. Specifically, we demonstrate that the development of data integration technology and sensor networks helps both automakers and car owners to analyze drivers’ behaviors in real time. The drivers’ behavior analysis can help us measure the life cycle of engine, transmission, and electronic control. Our study can help practitioners test the feasibility of B2C service and create business value from the drivers’ behavioral data collected from the real-time wireless communication. By collecting large amounts of data using a Hadoop system, companies will be able to provide more accurate maintenance services for their customers.
Footnotes
Handling Editor: Kye-Shin Lee
Declaration of conflicting interests
The author(s) declared no potential conflicts of interest with respect to the research, authorship, and/or publication of this article.
Funding
The author(s) received no financial support for the research, authorship, and/or publication of this article.